Abstract
Aims
To develop and assess the use of computerized laboratory data as a detection support tool of adverse drug reactions (ADRs) in hospital.
Methods
This was a retrospective observational study of 153 sequential medical admissions during a 2-month period to the 34-bed medical ward at the Hadassah University Hospital, Jerusalem, Israel. Measurements made were 1) Retrospective chart review for recognized and unrecognized adverse drug reactions (ADRs) and 2) Analysis of computerized laboratory data according to defined automatic laboratory signals (ALS) for adverse reactions.
Results
Forty ADRs have been detected in 38 out of the 153 hospital admissions (24.8%). Nine reactions were considered severe. Altogether 212 ALS were generated involving 86 admissions. In 25 (65.8%) of the ADR-positive admissions ADRs were detected through automatic signals generated from the laboratory data. ALS were detected in 56 out of the 115 (48.7%) ADR-negative admissions. Twenty-four (60%) of the ADRs were not recognized as such by the attending physicians. Two of these reactions were severe. ALS could have generated an alert for 19 (79.2%) of the unrecognized reactions.
Conclusions
Application of automatic laboratory signals can increase the rate of recognition of ADRs and thereby improve medical care. The sensitivity and specificity of the method might be increased by refinement and redefinition of the signals.
Keywords: hospital pharmacoepidemiology, hospital information systems, adverse drug reactions, drug surveillance
Introduction
Adverse drug reactions (ADRs) are encountered in as many as 30% of hospitalized patients and lead to 2–6% of all medical admissions [1–5]. Drug-induced morbidity leads to increased suffering, prolongs hospital stay and causes a significant increase in hospital expenditure [6, 7]. The need to monitor ADRs in hospitals has often been stressed and is an important element of post-marketing surveillance [8]. In 1988 the Joint Commission on Accreditation of Healthcare Organization in the United States (JCAHO) recommended that hospitals should monitor ADR more carefully [9]. A number of attempts to reduce the rate and morbidity of ADR have been carried out through the undertaking of active and prospective monitoring programmes of ADRs and subsequent dissemination of knowledge between health professionals. It had been shown that such activities often, though not always, reduce the rate of ADRs [1, 10–12]. Ongoing intensive surveillance systems are expensive, require specially trained staff and therefore are hard to maintain on a long-term basis. Voluntary programs are ineffective [13].
A more recent approach attempts the use of special alerts provided by the hospital information systems and data bases for tracking, monitoring and preventing ADRs in hospitals. Such programmes may include computerized alerts of drug allergies, standardized antibiotic administration doses and timely notification of physicians of all ADRs [13–15].
The most comprehensive and well known system of that nature is the ‘HELP’ system developed in the Salt Lake City Hospital [16]. Computerized programmes were based on the integrated hospital information system to allow for multiple source early detection of potential ADRs. Signals of potential ADRs were both voluntary and automated and included medication stop orders, antidote ordering and certain abnormal laboratory values. At our hospital integrated patient data base is limited. However, laboratory data are fully computerized. We tried to test the potential of automatic laboratory signals generated from the laboratory data base to alert for ADRs and to evaluate whether these alerts could be of relevance to the practicing physician and the quality of patient care.
Methods
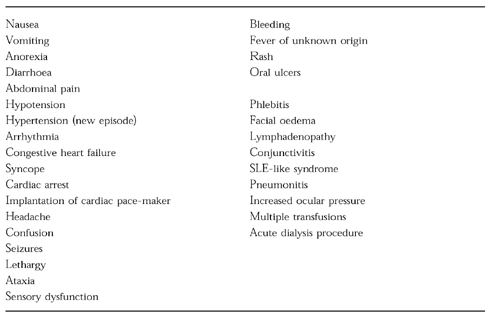
All admissions to Ward A of the department of Medicine of the Hadassah University Hospital, Jerusalem, Israel, during the 2 month period April-May, 1995 were the study base. Charts were reviewed after discharge by a clinical pharmacologist. Each chart was carefully examined for mention of possible ADRs. At the Hadassah University Hospital all patient laboratory data are available on computer file. Absolute values of, or changes in the routine laboratory tests (blood counts, liver and kidney function tests, serum electrolytes and glucose and drug plasma levels) which may indicate potential ADRs have been defined and used as automatic laboratory signals (ALS) (Table 1). The laboratory data-base for all admissions was screened for ALS by a specially developed computer programme. In addition charts were examined for clinical evidence of possible ADRs according to the clinical manifestations listed in Table 2. All these manifestations and signals were evaluated by a team consisting of a clinical pharmacologist and a senior physician for their severity and likelihood of being ADR and whether or not they were recognized as such by the staff physicians during hospitalization. For verification of ADR the following sources of drug information were used: Iowa Drug Information Service, Micromedex, Medline 1966–1996 and adverse-drug reaction-oriented home database of the Hadassah University Hospital Drug Information Center. For evaluation of the probability of an event being an ADR, the Naranjo algorithm score was used [17]. Only probable (score 5–8) and definite (score >9) ADRs were taken into consideration. Severe ADRs were defined as those which were fatal, life-threatening or disabling; moderate ADRs were defined as those leading to prolongation of hospitalization or causing discomfort; mild ADRs were defined as those not causing discomfort and not leading to prolongation of hospitalization. The sensitivity of the system was defined as the number of ADR-positive admissions, detected through ALS out of the total number of ADR-positive admissions. The specificity was defined as the number of ADR-negative admissions without ALS out of the total number of ADR-negative admissions. For statistical analysis the Wilcoxon non-paired rank sum test was used.
Table 1.
Definition of automatic laboratory signals used for detection of ADRs
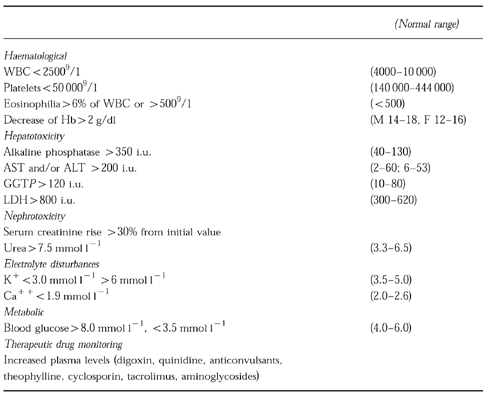
Table 2.
List of clinical events used for survey of ADRs
Results
Patient's sample characteristics
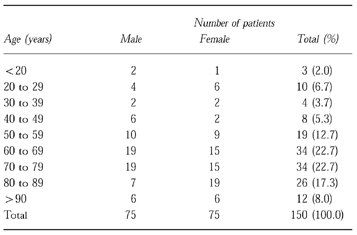
There were 153 admissions (150 patients) and 146 discharges. Seven patients died in hospital. The distribution of the patients by age and sex is shown in Table 3. About 70% of patients were more than 60 years old. The most common primary reasons for admissions were acute ischaemic heart disease (21.6%), urinary tract infections (15.7%), respiratory infections (12.4%), exacerbation of chronic obstructive lung disease (6.5%), chest pain (5.9%), arrhythmia (5.2%) and acute hepatitis (2.6% of all admissions). The most common discharge diagnoses were ischaemic heart disease (37%), hypertension (35%), congestive heart failure (25%) and diabetes mellitus (21% of all admissions). The distribution of age, sex and diagnoses was similar to that expected in the ward, based on the hospitals’ annual statistics.
Table 3.
Distribution of patients by sex and age
Identification of ADR by the expert team
Forty ADRs have been detected in 38 of the 153 admissions (24.8%), 19 occuring in males and 19 in females. Eleven of the ADRs presented on admission and 9 (5.9%) of all admissions were evaluated as being the cause for hospitalization. Eleven ADRs were scored as mild, 20 as moderate and 9 as severe. None was thought to have been a cause of death. The median age was 71 (interquartile range 60–79) years in the ADR-positive admissions and 66 (interquartile range 56–80) years in the ADR-negative admissions (P>0.05). The median duration of hospital stay was 10 (interquartile range 6–14) days for patients with an ADR and 7 (interquartile range 4–10) days for patients without an ADR (P<0.003).
Identification of ADRs by ALS
Twenty-six (65%) out of 40 ADRs were identified through ALS. These 26 ADRs occurred in 25 admissions (in 1 patient hyperkalaemia induced by spironolactone was followed by renal impairment induced by captopril and frusemide). Eleven of these ADRs were mild, 9 moderate and 6 severe. There were 8 ADRs which manifested as renal impairment (6 mild, 2 moderate), 5 of hepatic impairment (1 mild, 4 moderate), 5 of eosinophilia (2 mild, 3 moderate), 4 of drug toxicity (1 moderate and 3 severe), 2 of hyperkalaemia (severe), 1 hypoglycemia (mild) and 1 case of severe anaemia. Seven out of the 8 renal function impairment ADRs were due to the combination of ACE-inhibitors with frusemide in patients with hypertension, ischaemic heart disease, congestive heart failure and/or diabetes mellitus.
Hepatotoxicity presented on five admissions as an increase in liver enzymes. Eosinophilia induced by antibiotics or streptokinase was transient in all five patients and resolved spontaneously after cessation of the drugs. Toxic blood drug levels were identified on four admissions (digoxin 2, theophylline 1 and phenytoin 1) and drug-induced hyperkalaemia occurred on two admissions.
Fourteen out of 40 ADRs presented with manifestations which are currently ‘non-automatic’ in our system (Table 2). These ADRs occurred in 13 admissions (one patient presented on admission with levodopa-carbidopa-induced tardive dyskinesia and later, following prednisone therapy developed hypertension). Eleven of these reactions were moderate and three severe. Five were cardiovascular, 3 gastrointestinal, 1 was interstitial lung disease, 1 infusion phlebitis, 1 hypoglycaemia (discovered by bedside determination), 1 haematuria, 1 increased ocular pressure and 1 tardive dyskinesia.
Generation of automatic laboratory signals (ALS)
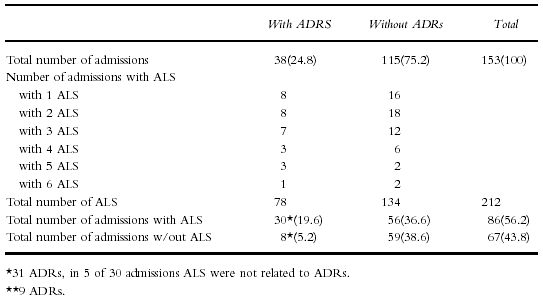
ALS were generated in 86 (56.2%) admissions. Altogether 212 ALS were counted (Table 4). Seventy-eight ALS occurred in 30 (78.9%) ADR-positive admissions (2.6 ALS per admission). However, in 5 of these admissions the signal did not relate to an ADR. Altogether 37 ALS were thought to be related to 26 ADRs in 25 admissions (1.5 ALS per admission).
Table 4.
Distribution of automatic laboratory signals (ALS) comparing admissions with and without ADRs (% of all admissions)
Sensitivity and specificity
In 25 out of the 38 ADR-positive admissions ADR were detected through ALS (sensitivity 65.8%). In 56 out of the 115 ADR-negative admissions, ALS were generated (specificity 51.3%).
Analysis of automatic signals and their potential to detect ADRs (Table 5)
Table 5.
Distribution of automatic laboratory signals (ALS) comparing patients with and without ADRs
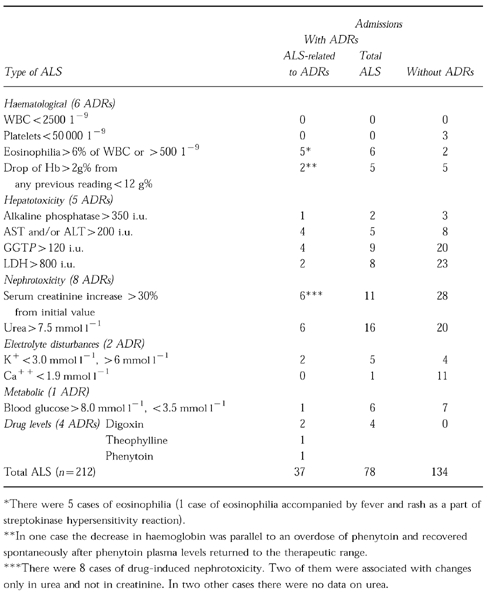
The most frequent ALS indicated disturbed liver function. Eleven ALS related to the five patients thought to have drug-induced liver disease (two were confirmed by biopsy). Fifty-four disturbed liver function ALS in the ADR-negative admissions related to 17 cases of acute viral hepatitis and cirrhosis. Signals indicating impaired renal function were distributed as follows: 12 out of the 27 ALS in the ADR-positive admissions were related to 8 cases of drug-induced nephrotoxicity, while the 48 ALS in the ADR-negative admissions related to 24 cases of renal diseases. Other signals were hypocalcaemia (one ALS not- related to an ADR in ADR-positive admission and 11 ALS in ADR-negative admissions), hypoglycaemia (6 ALS, 1 related and 5 not-related to an ADR in ADR-positive admissions and 7 ALS in ADR-negative admissions) and eosinophilia (6 ALS, 5 related and 1 not-related to an ADR in ADR-positive admissions and 2 ALS in ADR-negative admissions).
Severity of ADRs and recognition by physicians during hospitalization
Unrecognized ADRs
Twenty-four out of 40 ADR (60%) were not recognized by the treating physicians. These included 19 out of 26 ADRs (73%) identified through ALS and 5 out of 14 ADRs (35.7%) identified retrospectively through non-automatic signals (Table 6). Among the ADR not recognized by physicians and identified by ALS, there were 1 severe (theophylline cardiotoxicity), 9 moderate and 9 mild reactions. Among 5 ALS-negative ADR unrecognized by physicians, 1 was severe (methyldopa-induced severe diarrhoea and rash) and 4 were moderate (prednisone-induced hypertension, vancomycin-induced infusion phlebitis, nifedipine and isosorbide mononitrate-induced hypotension, verapamil-induced bradycardia). The physicians were aware of the clinical manifestations of severe ADRs (both ALS-negative and -positive) but they did not suspect drug-induced aetiology (for example, cardiotoxicity induced by overdose of theophylline leading to prolongation of hospitalization).
Table 6.
Distribution of ADRs according to detection, severity and recognition by the attending physician

Recognized ADRs
Among ADRs recognized by physicians, 5 out of 7 ADRs identified through ALS and 2 out of 9 through non-ALS were severe.
Discussion
An adverse drug reaction, according to the WHO definition, is any response to a drug which is noxious, unintended and which occurs at doses normally used in man for the prophylaxis, diagnosis or therapy of disease [18]. ADRs continue to be an important source of morbidity in hospitalized patients but in most cases they are overlooked and are not reported to existing reporting systems [8, 19, 20]. Most ADRs are potentially avoidable, for example, the Medical Practice Study found that 65% of ADRs were due at least in part, to an error in management [8, 21].
In spite of the small scale of the present study our findings showing that ADRs occurred during hospitalization in 20.3% of the admissions, and that ADRs were the cause of 6% of the admissions are consistent with those previously reported by us and others [1, 2]. The finding that 60% of all ADRs were not recognized as such by the attending physician is disturbing but not surprising and has led others to examine the use of hospital information systems in monitoring and prevention of ADRs [22, 23]. Computer-assisted systems can be used to obtain, process, store, retrieve, analyze and distribute data. In a study by Bates et al. [24] three hierarchical levels of computerized information system sophistication for monitoring adverse events were suggested. Level 1 included demographic data, results of all diagnostic tests and current medications available on-line. Level 2 included all orders entered on-line by physicians and level 3—additional clinical data such as automated problem lists available on-line. At present, our hospital computerized information systems includes only level 1 elements. We found that 65% of ADRs could be identified through ALS while Bates identified 53% of all ADRs at level 1.
It is striking that 19 out of the 26 ADR identified through ALS (or 47.5% of all ADR) had not been recognized by the attending physicians. Ten of these unrecognized ADRs were severe or moderate. The most common presentation was nephrotoxicity caused by the combined use of a diuretic with angiotensin converting enzyme inhibitor. Obviously, a lack of recognition of the synergistic negative renal effect of this combination could be easily changed through computerized intervention programmes. Several studies have demonstrated the effects of such programmes [14, 25]. Pioneering work has been done at the Salt Lake City Hospital, Utah, where the hospital information system (HELP) contains integrated patient data-base and an interactive modular knowledge base. The data are processed and rearranged to produce alerts, namely, automatic notification of appropriate providers of time-critical decisions [16, 26].
The use of laboratory data for the detection of ADRs has been investigated elsewhere. Scanning of laboratory data as a part of interactive programmes including patient medication and catalogues concerning drug effects on laboratory tests are now being implemented to detect ADRs occurring in hospitals in Finland [27]. It was recently estimated that the use of abnormal laboratory results as an ADR monitor would potentially identify 29% of adverse reactions [24].
In our hospitals, as in many other medical centres, the computerization of pharmacy records and of medical records lags behind that in clinical laboratories [15]. Nevertheless, ALS by themselves can serve, if used correctly, to alert physicians to the presence of an ADR and to allow earlier detection of ADRs.
Based on the results presented, we suggest the ongoing use of ALS listings as routine part of the daily morning report. This reminder or detection support tool, will assist physicians in case capturing information, to be evaluated during the discussion (and decision-making) of adverse outcomes, usually from the previous 24 h. The attending physicians can utilize this opportunity to discuss the clinical circumstances leading to an ADR. Some of these events will require further review and reporting [28]. This programme can supplement other in-house physician reporting strategies based on physician self-referral [29]. The educational and patient benefits of the proposed programme could be substantial, as almost half of the ADRs in this study were identified by ALS and at the same time were not recognized by the attending physicians. Early recognition of ADRs by the attending physicians will result in drug and dosage changes and may hinder the progression of mild ADRs to a more severe form.
The cost of the programme appears to be reasonable when considered in the context of the annual cost of ADRs in hospital patients, which has been estimated in the U.S. as more than 4.5 billion dollars [30]. The costs are much less than an average 2–3 day increase in hospital stay in patients with ADRs as suggested by this study and by others [6, 7, 31].
The successful implementation of the programme as an educational and detection support tool would serve well to further development of clinical information systems and the improvement of healthcare delivery.
The use of the system may also be beneficial in changing prescribing and/or patient monitoring patterns to reduce the occurrence of preventable ADRs and provide earlier detection of type B ADRs, such as hepatotoxicity and haematological reactions.
The finding that in a third of the admissions for ADRs ALS were not generated can perhaps be improved by redefinition of the ALS. The specificity of the method could probably be increased by the elimination of signals through pre-screening for non-drug aetiologies of adverse events, e.g. anaemia in patients admitted for bleeding oesophageal varices.
Acknowledgments
Dr Levy is a Lise Meitner-Alexander von Humboldt Awardee at the Institute of Experimental and Clinical Pharmacology and Toxicology, University of Erlangen, Germany.
References
- 1.Levy M, Kletter-Hemo D, Nir I, Eliakim M. Drug utilization and adverse drug reactions in medical patients: comparison of two periods, 1969–72 and 1973–76. Isr J Med Sci. 1977;13:1065–1072. [PubMed] [Google Scholar]
- 2.Levy M, Kewitz H, Altwein W, Hillerbrand J, Eliakim M. Hosptial admissions due to adverse drug reactions: a comparative study from Jerusalem and Berlin. Eur J Clin Pharmacol. 1980;17:25–31. doi: 10.1007/BF00561673. [DOI] [PubMed] [Google Scholar]
- 3.Michel DJ, Knodel LC. Program coordinated by a drug information service to improve adverse drug reaction in a hospital. Am J Hosp Pharm. 1986;43:2202–2205. [PubMed] [Google Scholar]
- 4.Kennedy DL, Johnson JM, Nightingale SL. Monitoring of adverse drug events in hospitals. JAMA. 1991;266:2878. [PubMed] [Google Scholar]
- 5.Chan TYK. Computer-assisted pharmacovigilance in hospitalized patients. Ann Pharmacother. 1995;29:788–789. doi: 10.1177/106002809502907-828. [DOI] [PubMed] [Google Scholar]
- 6.Bates DW, Spell N, Cullen DJ, et al. The costs of adverse drug events in hospitalized patients. JAMA. 1997;277:307–311. [PubMed] [Google Scholar]
- 7.Classen DC, Pestotnik SL, Scott Evans R, Lloyd JF, Burke JP. Adverse drug events in hospitalized patients. JAMA. 1997;277:301–306. [PubMed] [Google Scholar]
- 8.Leape LL, Brennan TA, Laird NM, et al. The nature of adverse events in hospital patients: Results of the Harvard Medical Practice Study II. N Engl J Med. 1991;324:377–384. doi: 10.1056/NEJM199102073240605. [DOI] [PubMed] [Google Scholar]
- 9.Joint Commission on Accreditation of Healthcare Organizations. Accreditation of Healthcare Organizations; 1988. [Google Scholar]
- 10.Crawford SY, Myers CE. ASHP National Survey of Hospital-Based Pharmaceutical Services. 1992; Am J Hosp Pharm. 1993;50:1371–1404. [PubMed] [Google Scholar]
- 11.Smith CC, Bennett PM, Pearce HM, et al. Adverse reactions in a hospital general medical unit meriting notification to the Committee on Safety of Medicines. Br J Clin Pharmacol. 1996;42:423–429. doi: 10.1046/j.1365-2125.1996.04376.x. [DOI] [PMC free article] [PubMed] [Google Scholar]
- 12.Prosser TR, Kamysz PL. Multidisciplinary adverse drug reaction surveillance program. Am J Hosp Pharm. 1990;47:1334–1339. [PubMed] [Google Scholar]
- 13.Evans SR, Pestotnik SL, Classen DL, Horn SD, Bass SB, Burke JP. Preventing adverse drug events in hospitalized patients. Ann Pharmacother. 1994;28:523–527. doi: 10.1177/106002809402800417. [DOI] [PubMed] [Google Scholar]
- 14.Bates DW, Cullen DJ, Laird N, et al. Incidence of adverse drug events and potential adverse drug events. JAMA. 1995;274:29–34. [PubMed] [Google Scholar]
- 15.Grasela CH, Walawander CA, Kennedy DL, Jolson HM. Capability of hospital computer systems in performing drug-use evaluations and adverse drug event monitoring. Am J Hosp Pharm. 1993;50:1889–1895. [PubMed] [Google Scholar]
- 16.Classen DC, Pestotnik SL, Evans RS, Burke JP. Computerized surveillance of adverse drug events in hospital patients. JAMA. 1991;266:2847–2851. [PubMed] [Google Scholar]
- 17.Naranjo S, Busto U, Sellers EM, et al. A method for estimating the probability of adverse drug reactions. Clin Pharmacol Ther. 1981;30:239–245. doi: 10.1038/clpt.1981.154. [DOI] [PubMed] [Google Scholar]
- 18.World Health Organization International Drug Monitoring. The role of the hospital. WHO Tech Rep Ser. 1969;426:5–24. [PubMed] [Google Scholar]
- 19.Schiff GD. Using a computerized discharge summary data base check box for adverse drug reaction monitoring. Qual Rev Bull. 1990;16:149–155. doi: 10.1016/s0097-5990(16)30357-8. [DOI] [PubMed] [Google Scholar]
- 20.Berry LL, Segal R, Sherrin TP, Fudge KA. Sensitivity and specificity of three methods of detecting adverse drug reactions. Am J Hosp Pharm. 1988;45:1534–1539. [PubMed] [Google Scholar]
- 21.Leape LL, Lawthers AG, Brennan TA, Johnson WG. Preventing medical injury. Qual Rev Bull. 1993;19:144–149. doi: 10.1016/s0097-5990(16)30608-x. [DOI] [PubMed] [Google Scholar]
- 22.Hulse RK, Clark SJ, Jackson JC, Warner HR, Gardner RM. Computerized medication monitoring system. Am J Hosp Pharm. 1976;3:1061–1064. [PubMed] [Google Scholar]
- 23.Evans RS, Pestotnik SL, Classen DC, et al. Development of a computerized adverse drug event monitor. Symp Comput Appl Med Car. 1991;15:23–27. [PMC free article] [PubMed] [Google Scholar]
- 24.Bates DW, O'Neil AC, Boyl D, Teich J, Chertow GM, Komaroff AL, Brennan TW. Potential identifiability and preventability of adverse events using hospital information systems. J Am Med Informatics Assoc. 1994;5:404–411. doi: 10.1136/jamia.1994.95153428. [DOI] [PMC free article] [PubMed] [Google Scholar]
- 25.Leape LL, Bates DW, Cullen DJ, et al. Systems analysis of adverse drug events. JAMA. 1995;4:35–43. [PubMed] [Google Scholar]
- 26.Classen DC, Burke JP. The computer-based patient record: The role of the hospital epidemiologist. Infec Contol Hosp Epidemiol. 1995;6:729–736. doi: 10.1086/647049. [DOI] [PubMed] [Google Scholar]
- 27.Gronroos P, Irjala K, Heiskanen J, Troniainenk K, Forsstrom JJ. Using computerized individual medication data to detect drug effects on clinical laboratory tests. Scand J Lab Invest. 1995;55(Suppl 223):31–36. doi: 10.3109/00365519509088448. [DOI] [PubMed] [Google Scholar]
- 28.Sivaram CA, Johnson S, Tirmizi SN, Robertson V, Garcia D, Sorrells E. Morning report: A forum for reporting adverse drug reactions. J Comm J Qual Improv. 1996;22:259–263. doi: 10.1016/s1070-3241(16)30229-2. [DOI] [PubMed] [Google Scholar]
- 29.O'Niel AC, Petersen LA, Cook F, Bates DW, Lee TH, Vrennan TA. Physician reporting compared with medical record review to identify adverse medical events. Ann Int Med. 1993;119:370–376. doi: 10.7326/0003-4819-119-5-199309010-00004. [DOI] [PubMed] [Google Scholar]
- 30.Hershey LA. Avoiding adverse drug reactions in the elderly. Mt Sinai J Med. 1988;55:244–250. [PubMed] [Google Scholar]
- 31.Evans RS, Classen DC, Stevens LE, et al. Using a hospital information system to assess the effects of adverse drug events. Proc Ann Symp Comput Appl Med Care. 1993:161–165. [PMC free article] [PubMed] [Google Scholar]


