Abstract
Aims
Application of single methods to assess liver blood flow (LBF) yielded conflicting results on the magnitude and duration of effect on LBF of oral nifedipine and captopril. The aim of this study was to investigate the influence of these drugs on LBF by simultaneous use of ICG infusion and echo-Doppler.
Methods
The study was performed according to a double-blind, placebo-controlled, randomized, cross-over design in nine healthy male volunteers. After an overnight fast and an equilibration period, subjects received a continuous i.v. indocyanine green (ICG) infusion for 4 h. At presumed ICG steady state (t=45 min), subjects were dosed with oral nifedipine (20 mg), captopril (50 mg) or placebo. During the experiment, blood sampling for ICG assay and measurement of portal venous blood flow (echo-Doppler) took place regularly. Treatments were compared using analysis of variance. Differences are reported with 95% confidence intervals (CI).
Results
The area under the curves (AUC) for ICG over 1 h and over 3 h after nifedipine were 15% (difference in AUC: +0.6, +7.0 mg l−1 min) and 22% (+7.0, +28.4 mg l−1 min) lower compared with placebo. After captopril, the AUC values were 8–10% lower compared with placebo but the 95% CIs included zero. Portal venous flow was 15% (+5, +86 ml min−1) higher compared to placebo after nifedipine but not after captopril (−3%; −49, +33 ml min−1). The duration of effect on liver blood flow lasted approximately 2 h but was variable (range: 40–160 min). The time to maximal blood flow increase and the duration of effect after nifedipine were very similar for both measures of LBF. Changes in ICG concentrations could be reasonably well predicted from the changes in portal blood flow.
Conclusions
Nifedipine increases LBF for a substantial period of time but the effect is variable between subjects. This effect could be detected by both the ICG method and echo-Doppler and the findings of both methods were in agreement. In this respect it is likely that captopril does not influence LBF in healthy volunteers as no effect was detected with either method.
Keywords: liver blood flow, ICG clearance, echo-Doppler, nifedipine, captopril
Introduction
Liver blood flow (LBF) is an important determinant of the elimination of endogenous compounds and xenobiotics with high-hepatic clearance properties. Calcium antagonists and ACE-inhibitors are widely used cardiovascular drugs with possible actions on LBF. The influence of nifedipine on LBF is well documented [1-3]. Nifedipine can even be considered as a model compound to study the influences of increased LBF. However, there is doubt concerning the duration of increased LBF after nifedipine administration. In view of the lack of effect of nifedipine (20 mg capsules) administration on the plasma concentrations of endogenous tissue plasminogen activator (tPA) antigen despite a doubling of LBF, it was suggested that the increase in LBF was too short to influence (r)t-PA clearance [4]. This conclusion was supported by the observation that nifedipine did not change steady state indocyanine green (ICG) concentrations during a continuous i.v. infusion [5]. This is, however, debatable since nifedipine is reported to increase LBF from approximately 10 min [6] up to at least 1 h after administration [2, 7, 8]. Also, assessment of LBF with Duplex scanning showed that increases in portal vein and hepatic vein blood flow were present up to 3 h after administration [9].
The influence of captopril on LBF is even less clear. Animal experiments showed that ACE inhibition is associated with redistribution of cardiac output at the expense of splanchnic blood flow [10]. The effect in humans is controversial; it has been reported that captopril decreases LBF or has no influence, both in patients and in healthy subjects [11, 12]. Enalapril, a more potent ACE inhibitor, is reported to decrease LBF markedly after oral administration [13]. In contrast, captopril (50 mg orally) in normal subjects [14] and enalapril (10 mg i.v.) in salt-depleted volunteers [15] increases splanchnic blood flow. Differences in dose may partly explain the differences of ACE inhibitor-induced changes in LBF observed in the different studies in man, in analogy to the observations in animals [16]. It appears from the literature that low dose ACE-inhibitor therapy has less influence on LBF than high dose therapy. Alternatively, total LBF does not change because increases in portal vein blood flow as observed with echo-Doppler after captopril [14] are accompanied by a decrease in hepatic arterial blood flow rendering the net change for total LBF zero.
Previous experiments were carried out using a single experimental technique (either ICG pharmacokinetics or echo-Doppler). Simultaneous application of both techniques should theoretically offer the advantage of checking for internal consistency of experimental findings and thus reducing the degree of uncertainty. Therefore, the present study was designed to assess the influence of oral nifedipine and captopril on liver blood flow with a continuous ICG infusion and Duplex scanning.
Methods
Design
The study was executed according to a double-blind, randomized (3×3 Latin squares), cross-over design, with a washout period between treatments of 1 week. The study was performed in nine, non-smoking healthy male volunteers, aged between 18–35 years and with a body weight within 20% of ideal body weight according to the Geigy scientific tables. Each subject participated after giving written informed consent and the study protocol was approved by the Medical Ethics Committee of Leiden University Hospital.
Study days
The subjects were studied after an overnight fast from 24.00h. Following i.v. cannulation in suitable antecubital veins (one cannula to infuse ICG and a second cannula in the contralateral arm for blood sampling), blood was drawn as a ICG-assay blank and for the determination of the subject's haematocrit. The sampling cannula was kept patent with a slow i.v. 0.9% saline drip. Following a supine rest period of at least 15 min after cannulation, a continuous ICG infusion (Cardiogreen®, Hynson, Westcott & Dunning, Baltimore, MD, USA) was started. A total dose of 95 mg (38ml) ICG was infused intravenously in 240 min, using a calibrated infusion pump (Harvard Pump 22, Harvard Apparatus, South Natick, Mass., USA), concomitant with an equal volume of 0.9% saline to prevent irritation at the infusion site. Throughout this period the subjects remained supine. Forty-five min after the start of the ICG infusion drug/placebo administration took place. Nifedipine (20 mg), captopril (50 mg) and placebo were administered as identically appearing capsules containing powdered drug, which were prepared at the Leiden University Hospital pharmacy.
Blood samples for ICG assay (2.5 ml; lithium heparin tubes (Monovette® Sarstedt, Germany) were drawn at 15, 5 and 1 min before oral drug intake at and 8–9 min intervals thereafter. Plasma, obtained by centrifugation (6000g for 6 min) immediately after blood collection, was stored at −40° C until analysis. ICG plasma levels were measured using a validated h.p.l.c. method [3]. Blood pressure and heart rate were measured using an automated oscillometric blood pressure monitor (MPV 1072, Nihon Kohden, The Netherlands). Blood flow volume in a portal vein branch (QRPV) was measured with an echograph (Toshiba SSA 250A, Toshiba, Tokyo, Japan) equipped with a 3.75 MHz pulsed Doppler transducer by one of the investigators using previously reported methodology [17].The measurements were done before (twice) and at 15, 30, 45, 60, 75, 105, 135, 165 and 195 min after drug intake.
After completion of the infusion, the subjects were allowed to eat and to move freely. Measurements of blood pressure and heart rate continued until 7 h after the start of the ICG administration. If no significant alterations in haemodynamics were noted at this time point, the subjects were discharged from the unit.
Data analysis
The analyses were performed for two time spans during the period of assumed ICG steady state. The first period evaluated was the first hour after drug administration and the second time span was the period from drug administration until completion of the ICG infusion (t=240 min). For both time spans the area under the ICG plasma concentration-time curve (AUC) was calculated using trapezoidal integration. Mean arterial pressure (MAP) was calculated from the blood pressure measurements as: MAP=(SBP+(2×DBP))/3. Blood flow volume in the portal vein branch was calculated as QRPV=CSA×vmean, in which CSA is the cross-sectional area of the vessel calculated from the vessel diameter and vmean is the time-averaged and intensity-weighed blood flow velocity. For all haemodynamic parameters the area under the effect curve (AUEC) was calculated using trapezoidal integration over the indicated time spans. Parameters are reported as mean and standard deviation. Drug effects were assessed using factorial ANOVA with subject, study day and treatment as factors and in the case of the haemodynamic measures the pre-intervention values were used as covariate. Contrasts are reported as mean differences with its 95% confidence intervals (95%CI). Data management was performed using SPSS for Windows v6.1.2 (SPSS, Inc., Chicago, IL), AU(E)Cs were calculated using BMDP/Dynamic version 7.0 (BMDP statistical software Inc., Los Angeles, CA) and statistical analysis was performed using SAS for Windows V6.10 (SAS Institute, Inc., Cary, NC)
Results
Nine male subjects (age: 21–29 years; weight 59–84 kg) participated in the study. All subjects completed the study and no adverse events were noted.
ICG pharmacokinetics
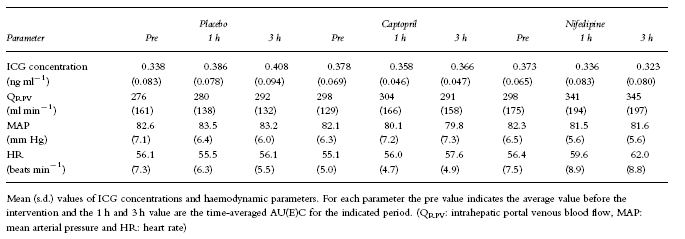
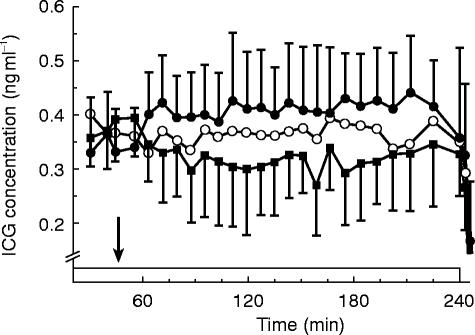
The average ICG concentration time-profiles for the three treatments are given in Figure 1. The placebo curve indicates that at the time of the intervention, which occurred 45 min after the start of the ICG infusion, ICG levels were still increasing. In the first hour after placebo administration the average concentrations rose 17% (s.d.: 22%) and levels were another 5% (s.d.: 8%) higher in the following time span. This was however mainly due to an increase in ICG concentrations in one subject, in whom the average ICG concentration over the first hour was 73% higher compared with the pre-intervention levels. When the data from this subject were left out the increase in the first hour after administration was 10% (s.d.: 7%). We have no explanantion for the aberrant pattern in the single subject and could not identify possible factors. Therefore, the entire data set was analysed including the data from this subject (Table 1). The AUC over the first hour after nifedipine intake was 3.8 mg l−1 min (95%CI: +0.6, +7.0 ng ml−1 min) lower, approximately 15%. For the AUC over the period from drug intake to completion of the infusion this difference amounted to 17.7 (+7.0, +28.4) ng ml−1 min, a 22% decrease. After captopril the AUC value over the first hour after administration was 2.1 ng ml−1 min (95%CI: −1.1, +5.2; 8%) lower compared with placebo. For the longer time interval a 10% lower AUC value was obtained (8.4 ng ml−1 min) but the 95% CI included zero (−2.3, +19.0 ng ml−1 min). Also for the comparison between captopril and nifedipine non-significant differences (7% and 13% for the short and long time span respectively) were observed.
Figure 1.
Average ICG (s.d.; n=9) concentrations (ng ml−1) following oral administration of the respective treatments (▪ nifedipine 20 mg, ○ capatopril 50 mg and • placebo). Drug intake (t=45 min) is indicated by the arrow and the i.v. ICG infusion (95 mg in 240 min,) is indicated by the box. The error bars for the captopril treatment have been omitted for clarity
Table 1.
Summary of ICG pharmacokinetics and haemodynamic parameters

Haemodynamics
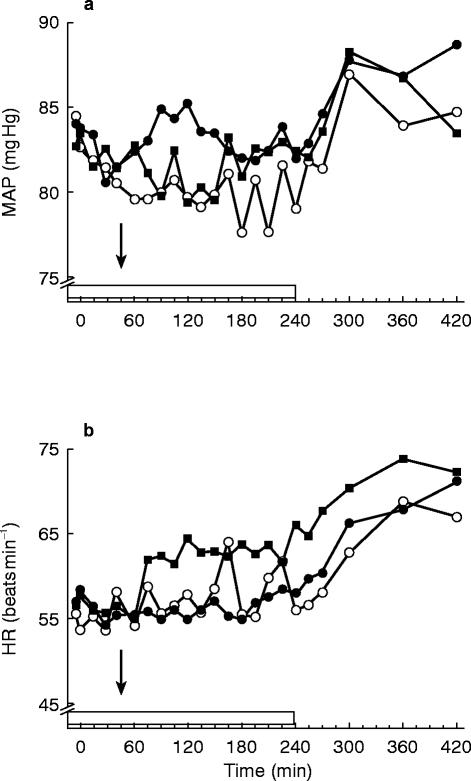
Both captopril and nifedipine slightly decreased MAP compared with placebo (Figure 2). The differences from placebo reached statistical significance only for the average value over the first hour after administration following captopril during which MAP was 3 mm Hg (+1, +5 mm Hg) lower. Heart rate was higher after nifedipine during both time spans. The average heart rate was 4 beats min−1 (+2, +6 beats min−1) and 6 beats min−1 (+3, +9 beats min−1) higher over the first hour after administration and over the entire period of ICG infusion respectively. After captopril HR remained unaltered.
Figure 2.
Haemodynamic profiles; a) the average mean arterial pressure (MAP) profiles b) the average heart rate (HR) profiles after oral administration (arrow) of nifedipine 20 mg (▪), capatopril 50 mg (○) and placebo (•). The box indicates the i.v. ICG infusion
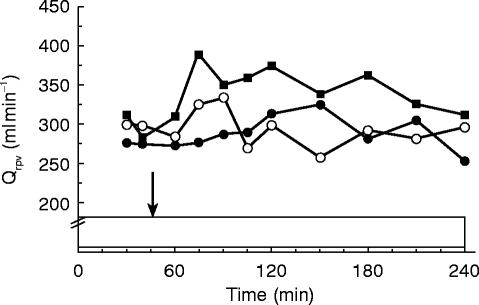
Average intrahepatic portal venous blood flow (QRPV; Figure 3) increased following nifedipine over both time spans. The differences in AUEC compared with placebo treatment were 17% (49 ml min−1; CI: −9, +107 ml min−1) over the first hour and 15% (45 ml min−1; CI: +5, +86 ml min−1) over the 3 h time span. Following captopril the average difference in flow compared with placebo were 3% (7 ml min−1; CI: −50, +65 ml min−1) for the 1 h period and −3% (−8 ml min−1; CI:-49, +33 ml min−1) for the entire study period. Flow values after nifedipine were higher when compared with the captopril treatment; 14% (42 ml min−1; CI: −13, +96 ml min−1) for the first interval and 19% (54 ml min−1; CI: +14, +93 ml min−1) for the entire experiment.
Figure 3.
Average portal venous blood flow following oral administration nifedipine 20 mg (▪), capatopril 50 mg (○) and placebo (•). Drug intake (t=45 min) is indicated by the arrow and the i.v. ICG infusion (95 mg in 240 min,) is indicated by the box
Relationship between ICG levels and echo-Doppler flow
Since flow changed only after the nifedipine treatment, the relationship between the two measures of LBF was investigated for this treatment. Firstly, the time course of changes was investigated. The lowest ICG concentrations were noted at 79 min (s.d.: 38; range 26–150 min) after drug intake and the highest portal flow values occurred slightly earlier at 73 min (s.d.: 38; range 15–135 min). In view of the different precision with which they were estimated a reasonable correlation between the parameters existed (r=0.78). The duration of the period of elevated flow values above baseline was 113 min (s.d.: 45; range 30–165 min). This was slightly shorter than the time span over which lower ICG levels were noted of 128 min (s.d.: 39; range 40–162 min). These parameters were highly correlated (r=0.93). Secondly, on the assumption that the average values over the different time spans reflect steady state ICG levels, and also that changes in portal venous flow are representative for total LBF, changes in echo flow can be used to predict changes in ICG levels [17]. If these assumptions hold for the average values, the measured increase in flow from baseline (approx. 15–17%) would theoretically lead to a 10% decrease in ICG level, which corresponds well with the observed 10–13% decrease.
Discussion
Altered hepatic blood flow can potentially influence plasma levels of endogenous and exogenous substances. As information on the influence of nifedipine and captopril on LBF with regard to magnitude and duration measured with a single experimental technique is ambiguous, the effects of these drugs on splanchnic blood flow in the present study was assessed by two independent measures. The echo-Doppler methodology used in this study has previously been shown to be sensitive enough to detect increases in portal venous flow [17] and to possess acceptable reproducibility [18]. Although it is recognised that the technique measures only one component of LBF, it is thought that with the simultaneous application of both techniques it should be possible to relate changes in one measure to changes in the other measure in order to obtain consistent information on the effects of the employed drugs.
Both the ICG method and the echo-Doppler measurements showed that oral nifedipine increased hepatic flow. More important however is the finding that the magnitude and the time course of the change in flow corresponded well. It was found that the maximal changes and the duration of changes correlated well providing evidence that they both measure the same phenomenon. The fact that the maximal changes were measured somewhat earlier with the echo technique is compatible with the notion that it takes some time for changes in flow to be translated into changes in ICG concentrations. The high correlation between the two measures of the period of elevated LBF also strengthens the agreement of the two methods. The similarity between the observed and predicted decreases in ICG concentrations based upon the change in portal blood flow corroborates these findings. Furthermore, it was shown with both methods that the increase in flow was already apparent within the first hour after administration and lasted for a substantial period. It cannot be easily explained why others have failed to find changes in other high clearance compounds after nifedipine while using more or less continuous methods of assessment [5]. The presented data refute the suggestion that the increase in LBF after nifedipine is too short to achieve such change. Alternatively, it may be related to the use of different nifedipine formulations with differential effects on LBF. It has been shown that i.v. and oral administration of the dihydropyridine calcium antagonist nisoldipine, resulting in comparable drug levels and systemic effects, differed markedly with regard to their effect on liver blood flow. Oral administration resulted in a substantial increase while i.v. administration hardly changed liver blood flow [19]. Also, if it is assumed that drug concentrations within the portal circulation are important for splanchnic vasodilation, it is conceivable that formulations with identical doses but different profiles of drug input into the splanchnic circulation may differ in magnitude and duration of effect. These possibilities have never been investigated properly, and should be further evaluated. The discrepancy may also be related to the inter-individual variability. In this study it was noted that the time between maximal increase in LBF and nifedipine intake and the duration of effect varied substantially. The discrepancy between the findings of nifedipine-induced changes in LBF and the absence of effect on tPA clearance may be related to other factors since it has been shown that tPA clearance, although liver blood flow-dependent, is much lower compared to ICG.
Also, for captopril both measures used to assess LBF showed internally consistent and comparable results. As some studies with higher doses of ACE-inhibitors had shown significant increases in either invasively estimated splanchnic blood flow [15] or portal venous flow [14], we employed a relatively high dose of captopril in this study. In addition, the data were analysed over two different time spans to account for any concentration-dependent changes that may have occurred. The results of this study are consistent with the majority of data in the literature showing no effect of captopril on measures of LBF. Even with the 50 mg dose employed in this study no changes could be detected in either ICG kinetics or echo-Doppler.
We thus conclude that simultaneous application of two independent techniques to evaluate drug-induced changes in LBF showed internally consistent findings with regard to the effects of oral nifedipine and captopril on LBF.
References
- 1.Feely J. Nifedipine increases and glyceryl trinitrate decreases apparent liver blood flow in normal subjects. Br J Clin Pharmacol. 1984;17:83–85. doi: 10.1111/j.1365-2125.1984.tb05003.x. [DOI] [PMC free article] [PubMed] [Google Scholar]
- 2.Bauer LA, Stenwall M, Horn JR, Davis R, Opheim K, Greene L. Changes in antipyrine and indocyanine green kinetics during nifedipine, verapamil and diltiazem therapy. Clin Pharmacol Ther. 1986;40:239–242. doi: 10.1038/clpt.1986.169. [DOI] [PubMed] [Google Scholar]
- 3.Soons PA, Kroon JM, Breimer DD. Effects of single-dose and short-term oral nifedipine on indocyanine green clearance as assessed by spectrophotometry and high performance liquid chromatography. J Clin Pharmacol. 1990;30:693–698. doi: 10.1002/j.1552-4604.1990.tb03628.x. [DOI] [PubMed] [Google Scholar]
- 4.DeBoer A, Kluft C, Kasper FJ, et al. Liver blood flow as a major determinant of the clearance of recombinant human tissue-type plasminogen activator. Thromb Haemostas. 1992;67:83–87. [PubMed] [Google Scholar]
- 5.Soons PA. Variability and stereoselectivity in pharmacokinetics, metabolism and effects of dihydropyridine calcium entry blockers in man. 1991. PhD Thesis Leiden University. [Google Scholar]
- 6.Nitsch J, Kuhnen R, Lüderitz B. Zunahme des Leberblutflusses unter Nifedipin. Klin Wochenschr. 1986;64:1113–1118. doi: 10.1007/BF01726871. [DOI] [PubMed] [Google Scholar]
- 7.Bengtsson-Hasselgren B, Rönn O, Blychert L, Edgar B, Raner S. Acute effects of felodipine and nifedipine on hepatic and forearm blood flow in healthy man. Eur J Clin Pharmacol. 1990;38:529–533. doi: 10.1007/BF00278576. [DOI] [PubMed] [Google Scholar]
- 8.Bauer LA, Murray K, Horn JR, Opheim K, Olsen J. Influence of nifedipine therapy on indocyanine green and oral propranolol pharmacokinetics. Eur J Clin Pharmacol. 1989;37:257–260. doi: 10.1007/BF00679780. [DOI] [PubMed] [Google Scholar]
- 9.Reiss WG, Bauer LA, Horn JR, Zierler BK, Easterling TR, Strandness DE., Jr The effects of oral nifedipine on hepatic blood flow in humans. Clin Pharmacol Ther. 1991;50:379–384. doi: 10.1038/clpt.1991.154. [DOI] [PubMed] [Google Scholar]
- 10.Gavras H, Liang C, Brunner HR. Redistribution of regional blood flow after inhibition of the angiotensin-converting enzyme. Circ Res. 1978;43((s1)):I-59–I-63. [Google Scholar]
- 11.Shepherd AN, Hayes PC, Jacyna M, Morrison L, Bouchier IAD. The influence of captopril, the nitrates and propranolol on apparent liver blood flow. Br J Clin Pharmacol. 1985;19:393–397. doi: 10.1111/j.1365-2125.1985.tb02659.x. [DOI] [PMC free article] [PubMed] [Google Scholar]
- 12.Crossley IR, Bihari D, Gimson AES, Westaby D, Richardson PJ, Williams R. Effects of converting enzyme inhibition on hepatic blood flow in man. Am J Med. 1984;76((5B)):62–65. doi: 10.1016/0002-9343(84)90886-6. [DOI] [PubMed] [Google Scholar]
- 13.Geneve J, Le Dinh T, Brouard A, Bails M, Segrestaa JM, Caulin C. Changes in indocyanine green kinetics after the administration of enalapril to healthy subjects. Br J Clin Pharmacol. 1990;30:297–300. doi: 10.1111/j.1365-2125.1990.tb03779.x. [DOI] [PMC free article] [PubMed] [Google Scholar]
- 14.Ray-Chaudhuri K, Thomaides T, Maule S, Watson L, Lowe S, Mathias CJ. The effect of captopril on the superior mesenteric artery and portal venous blood flow in normal man. Br J Clin Pharmacol. 1993;35:517–524. doi: 10.1111/j.1365-2125.1993.tb04178.x. [DOI] [PMC free article] [PubMed] [Google Scholar]
- 15.Stadeager C, Hesse B, Henriksen O, et al. Effects of angiotensin blockade on the splanchnic circulation in normotensive humans. J Appl Physiol. 1989;67:786–791. doi: 10.1152/jappl.1989.67.2.786. [DOI] [PubMed] [Google Scholar]
- 16.Bar-Meir S, Prigojon H, Bruck R, Krepel Z, Avni Y. The effect of chronic captopril administration on hepatic blood flow of the rat. J Pharm Pharmacol. 1990;42:515–516. doi: 10.1111/j.2042-7158.1990.tb06610.x. [DOI] [PubMed] [Google Scholar]
- 17.Burggraaf J, Schoemaker RC, Cohen AF. Assessment of changes in liver blood flow after food intake—comparison of ICG clearance and echo-Doppler. Br J Clin Pharmacol. 1996;42:499–502. doi: 10.1046/j.1365-2125.1996.44115.x. [DOI] [PMC free article] [PubMed] [Google Scholar]
- 18.Lycklama à Nijeholt GJ, Burggraaf J, Wasser MNJM, et al. Variability of splanchnic blood flow measurements using MR velocity mapping under fasting and post-prandial conditions—comparison with echo-Doppler. J Hepatol. 1997;26:298–304. doi: 10.1016/s0168-8278(97)80045-1. [DOI] [PubMed] [Google Scholar]
- 19.Harten van J, Burggraaf J, Danhof M, Brummelen van P, Breimer DD. The contribution of nisoldipine-induced changes in liver blood flow to its pharmacokinetics after oral administration. Br J Clin Pharmacol. 1989;27:581–586. doi: 10.1111/j.1365-2125.1989.tb03420.x. [DOI] [PMC free article] [PubMed] [Google Scholar]


