

Abstract
Aims
To assess the effects of the protease inhibitor ritonavir on the pharmacokinetics of ethinyl oestradiol in healthy female volunteers.
Methods
This was an open-label, single centre study in 23 subjects who received two single doses of oral contraceptive containing 50 μg ethinyl oestradiol on Day 1 (alone) and on Day 29 during concomitant ritonavir. Each subject received 16 days of every 12 h doses of ritonavir from Day 15 through Day 30. Blood samples were collected for serum ethinyl oestradiol concentrations for 48 h after each dose and for plasma ritonavir on Day 29 at 0 and 4 h postdose.
Results
Statistically significant decreases in ethinyl oestradiol mean Cmax (−32%) and mean AUC (−41%), and a statistically significant increase in the mean terminal elimination rate constant (+31%) were observed during concomitant ritonavir. The harmonic mean terminal half-life decreased from 17 h to 13 h during concomitant ritonavir. No statistically significant change was noted in tmax. The ratios of means (95% confidence intervals) for Cmax and AUC were 0.682 (0.612–0.758) and 0.595 (0.506–0.694), respectively. The changes in ethinyl oestradiol pharmacokinetics were consistent with an increase in clearance from enzymatic induction of glucuronidation and/or cytochrome P450 hydroxylation. Mean steady-state ritonavir concentrations of 6.5 and 13.4 μg ml−1 were observed at 0 and 4 h postdose, respectively.
Conclusions
Considering the extent of the decrease in ethinyl oestradiol concentrations, the use of alternate contraceptive measures should be considered when ritonavir is being administered.
Keywords: ritonavir, protease inhibitor, ethinyl oestradiol, pharmacokinetics, induction, glucuronidation, drug interaction, oral contraceptive
Introduction
Human immunodeficiency virus (HIV) protease is a constitutive enzyme of HIV that processes the viral gag and gag-pol polyproteins essential for the maturation of infectious virions; therefore, it represents a key target for intervention in the development of novel therapeutic agents for the acquired immunodeficiency syndrome (AIDS) [1]. Ritonavir is an HIV protease inhibitor that has been tested extensively for its ability to inhibit the HIV protease enzyme and HIV viral replication in cell culture. It has demonstrated a broad spectrum of activity against HIV types 1 and 2, including zidovudine-resistant HIV, in a variety of transformed and primary human cell lines [2]. Ritonavir administered in HIV positive patients was well tolerated and showed potent antiviral activity [3, 4]. Ritonavir (NorvirTM ) has recently been approved by several regulatory agencies for the treatment of HIV infection. Studies using human liver microsomes have shown that ritonavir is an inhibitor of CYP-mediated biotransformations [5]. Ritonavir was found to be a potent inhibitor of CYP3 A-mediated biotransformations using 17α-ethinyl oestradiol 2-hydroxylation (IC50=2.0 μm ), nifedipine oxidation (IC50=0.07 μm ) and terfenadine hydroxylation (IC50=0.14 μm ) as metabolic probes. Further evaluation of the effect of ritonavir on various CYP isozymes indicated that other isozymes were inhibited by ritonavir including CYP2D6 (IC50=2.5 μm for dextromethorphan-O-demethylase) and CYP2C8/9/10 (IC50=8.0 μm for tolbutamide methyl hydroxylase). CYP1 A2 was only marginally inhibited by ritonavir (33% inhibition of 7-ethoxyresorufin O-deethylase with 50 μm ritonavir) and CYP2E1 and CYP2 A6 were not inhibited. Therefore, the potency rank order for inhibition by ritonavir was CYP3 A≫CYP2D6>CYP2C9/10.
Ethinyl oestradiol, the major oestrogen component in oral contraceptives, is metabolized via CYP3 A-mediated 2-hydroxylation and undergoes conjugation with glucuronic acid and sulphate [6–8]. Hydroxylation at the 2- or 4- position has been reported to account for ≈29% of the ingested dose [6, 9]. Several interactions with oral contraceptives have been documented in the literature [10]. Decreases in ethinyl oestradiol concentrations have been observed with coadministration of phenytoin, carbamazepine, rifampicin and phenobarbitone. These agents are known inducers of cytochrome P450 enzymes, resulting in an increased ethinyl oestradiol clearance and potential therapeutic failure.
Since ritonavir has been shown to inhibit CYP3 A, the drug interaction potential of steady-state ritonavir on single dose ethinyl oestradiol pharmacokinetics was evaluated in the present study. In vitro studies in human liver microsomes indicated that ritonavir is metabolized via cytochrome CYP3 A to produce the two metabolites M-1 and M-11 as well as via both CYP3 A and CYP2D6 to form M-2 [5]. These experiments have shown that none of the known CYP3 A substrates/inhibitors, e.g. ketoconazole, troleandomycin and 17α-ethinyloestradiol, were able to completely inhibit ritonavir metabolism even at high concentrations [5]. Since high concentrations (100 μm, ≈30 μg ml−1 ) of 17-α-ethinyl oestradiol could not completely inhibit the formation of ritonavir metabolites, it is unlikely that ethinyl oestradiol would have a clinically significant effect on ritonavir pharmacokinetics. Therefore, the effects of ethinyl oestradiol and ethynodiol on ritonavir pharmacokinetics were not evaluated in the present study. To reduce the effect of menstrual cycle on ethinyl oestradiol pharmacokinetics, the oral contraceptive was administered during the same respective phase of the cycle for each subject, i.e. at a 1-month interval, but the phase varied among subjects [11]. The dose of ethinyl oestradiol was 50 μg to ensure good assay detection.
Methods
Subjects
Healthy females between the ages of 18 and 45 years, with weight within the acceptable range for the subject's height according to the amended New York Metropolitan Life Insurance Standard Height and Weight Table, were eligible to participate in the study. Subjects were to have no recent history of drug or alcohol abuse, were not to be users of tobacco products, and were to be negative for hepatitis B virus. Subjects were postmenopausal or, if of childbearing potential, were included only if they were not nursing, were surgically sterilized, practiced total abstinence, or maintained a monogamous relationship with a vasectomized partner, and had a negative urine/serum pregnancy test. The subjects were not receiving an oral contraceptive during the 6 months prior to the study. All subjects gave written, informed consent in compliance with FDA regulations, and Institutional Review Board approval was obtained.
Subjects were excluded from study participation if any of the following criteria were met: history of serious drug hypersensitivity reactions, active or recent substance abuse, psychiatric illness, or known or suspected central nervous system disorders; use of any investigational drug within the preceding 4 weeks of the study; use of any other drug including over-the-counter medications during the course of the study; blood donation within two months prior to study start or blood transfusion within 12 weeks prior to study start; history of chronic ibuprofen (or other nonsteroidal anti-inflammatory agents) administration for menstrual cramps; history of hepatitis or thromboembolic event; evidence of significant cardiovascular, hepatic, renal, metabolic, gastrointestinal, neurologic or endocrine diseases.
Study design
This was an open-label, single-centre study. Subjects received the first dose of oral contraceptive (Demulen® 1/50, GD Searle & Co.) containing 50 μg ethinyl oestradiol and 1 mg ethynodiol diacetate on Day 1. Each subject received 16 days of every 12 h doses of ritonavir from Day 15 through Day 30, with 300 mg every 12 h on Day 15, 400 mg every 12 h on Day 16, and 500 mg every 12 h thereafter. Ritonavir was administered via oral syringe as an 80 mg ml−1 solution. The second dose of oral contraceptive was administered on Day 29, with the morning dose of ritonavir. All doses were administered with ≈240 ml of water and within 15 min following a meal.
Subjects were confined for 64 h from Day −1 (day prior to the initial dose) through the first 48-h blood collection (morning of Day 3) and for 64 h from Day 28 through the second 48-h blood collection (morning of Day 31). In addition, subjects came to the clinical testing unit as outpatients for meals, dosing and other study activities twice daily for a total of 14 consecutive days, starting on Day 15. Strenuous activity during confinement was not permitted. All meals were standardized with regard to content during confinement. Breakfast, lunch, and dinner were served at ≈07.30h, 13.00h and 19.30h and snacks were provided at ≈22.00h.
Sample collection and analysis
Serial 7 ml blood samples were collected for serum ethinyl oestradiol concentrations at the following times relative to the oral contraceptive dose on Day 1 and Day 29: prior to dosing (0 h) and at 0.5, 1, 2, 3, 4, 6, 8, 10, 12, 18, 24, 30, 36, and 48 h postdose. In addition, blood samples (7 ml) were collected for plasma ritonavir concentrations on Day 1 at 0 h and at steady state on Day 29, at 0 h (prior to morning dosing) and 4 h postdose. Serum concentrations of ethinyl oestradiol were determined by gas chromatography/mass spectrometry, at Pharmaco LSR, Richmond, VA. Samples were assayed in analytical batches which consisted of human serum blanks, calibration curves, quality controls, and subject samples. Standard curves ranged from 2.00 to 256 pg ml−1. Quality control samples (6.00, 24.0 and 144 pg ml−1 ) had between-run coefficients of variation ≤11.4%. Plasma samples were analysed for ritonavir concentrations at Oneida Research Services, Inc., Whitesboro, NY using a validated high performance liquid chromatography (h.p.l.c.) assay with ultraviolet detection [12]. The method was originally developed at Abbott Laboratories. Standard curves for ritonavir ranged from 0.010 to 16.00 μg ml−1; between-run coefficients of variation for the quality control samples (0.150, 7.500 and 12.00 μg ml−1 ) were ≤12.9%.
Pharmacokinetic and statistical methods
Ethinyl oestradiol pharmacokinetic parameters (tmax, Cmax, AUCt, AUC, λz, and t1/2,z ) were estimated for each oral contraceptive dose, using noncompartmental methods. The terminal elimination rate constant was calculated using concentrations starting at 18 h postdose. A paired t-test was performed on the change in tmax, Cmax, AUC and λz between Day 1, when the oral contraceptive was administered alone, and Day 29, during every 12 h ritonavir administration. For both Cmax and AUC a 95% confidence interval was obtained for the ratio of the mean on Day 29, during every 12 h ritonavir administration, to the mean on Day 1, when the oral contraceptive was administered alone [13].
Results
Subjects
A total of 27 subjects were enrolled in the study. Four subjects failed to complete the study and did not receive the second oral contraceptive dose. Data from these four subjects were therefore excluded from summary statistics and statistical analyses. One subject was prematurely terminated from the study (on Day 19) because of personal reasons and the occurrence of an adverse event (mild chest pain), two subjects were found to be noncompliant and chose to withdraw from the study on Day 19, and one subject tested positive for hepatitis B surface antigen and was terminated on Day 3. The mean±s.d. age of the 23 healthy female volunteers who completed the study was 34±10 years (range: 19–45 years). The mean±s.d. weight was 67.3± 10.9 kg (range: 50.8–90.3 kg), and the mean±s.d. height was 167±7 cm (range: 155–180 cm).
Pharmacokinetics
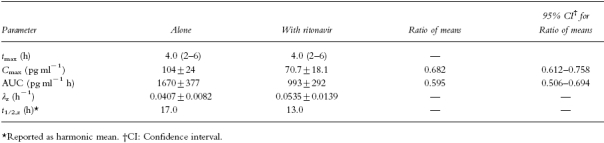
Following administration of a single dose of oral contraceptive, serum ethinyl oestradiol concentrations peaked at ≈4 h postdose and declined thereafter with a typical terminal elimination half-life of 17 h (Figure 1). Administration of the second dose of oral contraceptive on Day 29, after approximately 2 weeks of 500 mg every 12 h ritonavir, resulted in a 32% lower ethinyl oestradiol mean Cmax (P<0.001) and a 41% lower mean AUC (P<0.001), compared with administration of the oral contraceptive alone (Table 1). In addition, the mean terminal elimination rate constant increased by 31% (P<0.001) with concomitant ritonavir, with a harmonic mean half-life of 13 h. The effect on AUC was consistent across individuals as is evident from the relatively narrow 95% confidence interval of the ratio of AUC means (0.506–0.694). All subjects except one had a decrease in AUC with ritonavir dosing. No statistically significant change was noted in tmax (P=0.387).
Figure 1.

Mean±s.d. serum ethinyl oestradiol concentration vs time profiles after administration of the oral contraceptive alone (○) and with ritonavir (•). Inset is a semi-logarithmic profile.
Table 1.
Ethinyl oestradiol pharmacokinetic parameters (mean±s.d., n=23) after administration of the oral contraceptive alone and with ritonavir.
Every subject had detectable ritonavir concentrations after 2 weeks of dosing with mean steady-state concentrations on Day 29 of 6.5 and 13.4 μg ml−1 at 0 and 4 h postdose, respectively. The relationship between the magnitude of the change in ethinyl oestradiol AUC and steady-state ritonavir concentrations was examined. A statistically significant but minor positive relationship was observed with the 4h ritonavir concentrations (P=0.023,r2=0.232, Figure 2), with ritonavir concentrations explaining 23% of the variability observed in ethinyl oestradiol AUC ratios (Day 29/Day 1). However, no relationship was found between ethinyl oestradiol AUC ratios and trough ritonavir concentrations (P=0.287,r2=0.05).
Figure 2.

Individual ethinyl oestradiol AUC ratios (Day 29:Day 1) vs steady-state ritonavir concentrations at 4 h postdose. Symbols represent individual data, line represents the results of the regression analysis. The parameters of the regression line were: intercept: 0.252±0.159; slope: 0.0282±0.0115, P=0.023; r2: 0.232.
Four subjects missed one or more doses of ritonavir on Days 29 and 30, during pharmacokinetic sampling for ethinyl oestradiol for various reasons (listed in parentheses). One subject missed the second dose on Day 29 (vomiting 10.7 h after the morning dose), the second subject missed both doses on Day 30 (serum liver function test elevations and elevated serum triglycerides), the third subject missed the second dose on Day 29 (vomiting 9.7 and 10.5 h after the morning dose and elevated temperature) and both doses on Day 30 (nausea and elevated temperature), and the last subject missed all doses on Days 29 and 30 (serum liver function test elevations). It should be noted that even though these subjects missed ritonavir doses on Day 29 and/or 30, very low ethinyl oestradiol AUC values for the Day 29 oral contraceptive dose were observed, with AUC ratios relative to Day 1 ranging from 0.261 to 0.561.
Adverse events
Most treatment emergent adverse events in this study were rated as mild. The most frequently reported adverse events during administration of ritonavir were circumoral paresthesia, nausea, asthenia and vasodilation, headache and hypesthesia, which were reported at least once by a majority of the subjects. In controlled clinical trials, these adverse events are relatively common with ritonavir.
Discussion
The present study was designed to evaluate the potential interaction between ethinyl oestradiol and steady-state ritonavir. The dose of ritonavir selected in the present study was slightly lower than the therapeutic dose intended for the treatment of AIDS/ARC (AIDS-related complex), i.e. 600 mg every 12 h, due to the apparent lower tolerability of ritonavir in normal volunteers. The duration of treatment was adequate to achieve steady state for ritonavir, based on earlier findings that ritonavir trough concentrations stabilized after dosing for 2 weeks [14]. Ritonavir concentrations measured at 0 and 4 h on Day 29 after 2 weeks of every 12 h administration, averaged 6.5 and 13.4 μg ml−1, respectively. These concentrations are well above the protein-binding adjusted IC90 of 2.1 μg ml−1 for HIV protease [3].
The significant decrease in ethinyl oestradiol concentrations as well as the increase in the elimination rate constant reported in the present study are consistent with an increase in ethinyl oestradiol clearance from enzymatic induction. A decrease in absorption cannot be the sole mechanism of the interaction since an increase in ethinyl oestradiol terminal elimination rate constant was observed with ritonavir. The ritonavir dose was missed in one subject on the morning of Day 29, when the oral contraceptive was administered. Even in this subject, ethinyl oestradiol AUC on Day 29 was 31% of the AUC measured on Day 1, suggesting enzyme induction rather than altered absorption as the probable cause of the interaction. The enzyme γ-glutamyl transpeptidase (GGT) has been used as an indicator of enzymatic induction [15]. In the present study, GGT was measured as part of the serum chemistry panel for safety assessment. The difference in GGT concentrations between screening and poststudy was evaluated to provide indirect evidence of enzyme induction. A statistically significant increase in GGT was observed on Day 28 from baseline values (P=0.002, paired t-test), with a ratio of mean GGT concentrations of 1.72 and individual ratios ranging between 1.00 and 3.59. Another possibility for the increase in ethinyl oestradiol clearance would be an increase in the free fraction of the drug. However, due to the large excess of albumin binding capacity, displacement of ethinyl oestradiol by ritonavir is very unlikely.
Ethinyl oestradiol is metabolized via hydroxylation, glucuronidation and sulphation, with large interindividual variability observed for each route of metabolism [16–18]. The extent of each pathway of metabolism is unknown, although hydroxylation has been reported to account for ≈29% of the ingested dose [10]. The 2-hydroxylation reaction has been reported to be CYP3 A-dependent but may be mediated via other cytochrome P450 s [18]. In vitro studies performed in human liver microsomes indicated that ritonavir inhibited 17α-ethinyl oestradiol 2-hydroxylation, which is presumably mediated via CYP3 A, with a reported IC50 of 2.0 μm [5]. In addition to the in vitro results, in vivo inhibition of CYP-mediated metabolism has been observed with ritonavir coadministration with clarithromycin [19], saquinavir [20, 21] and indinavir [22]. Marked effects were observed on clarithromycin pharmacokinetics with practically complete inhibition of the CYP3 A-mediated formation of the 14- [R]-hydroxy-metabolite, observed after 4 days of concomitant clarithromycin and ritonavir administration. If ethinyl oestradiol is primarily metabolized via CYP3 A, one would expect an increase in ethinyl oestradiol concentrations with an in vitro IC50 for ritonavir of 2 μg ml−1. However, the results reported herein demonstrated a decrease in ethinyl oestradiol AUC indicating enzymatic induction by ritonavir. Although ritonavir has been shown to be a potent competitive inhibitor of CYP3 A with a very high affinity for the enzyme, there is evidence of enzymatic induction occurring after chronic administration. Experiments have shown that ethinyl oestradiol glucuronyl transferase activity was increased in rat microsomal preparations after 14 days of ritonavir oral administration [23]. The magnitude of increase was in the same range as that obtained with phenobarbitone, which was used as a positive control. Ritonavir was also shown to decrease zidovudine AUC by 25%, probably due to induction of glucuronidation [24]. A clinical interaction study of ritonavir and theophylline resulted in a 43% decrease in theophylline AUC during concomitant ritonavir administration [25]. Results from this study indicated that CYP1 A2 metabolic pathway was induced by chronic ritonavir administration. Furthermore, predose concentrations of ritonavir decreased by 30 to 70% over time during multiple dosing [14]. Concentration-dependent autoinduction (CYP3 A) was found to be the most likely mechanism for the time-dependent pharmacokinetics. Thus, despite the inhibitory effect of ritonavir on CYP3 A enzyme, administration of ritonavir resulted in an overall increase in ethinyl oestradiol clearance. This effect may be explained by both induction of glucuronidation and other CYP-mediated pathway.
The magnitude of the decrease in ethinyl oestradiol AUC observed in this study is similar to the effects of the known enzyme inducers (e.g. phenobarbitone, rifampicin, phenytoin), with reported decreases in AUC of 42–49%. Ethinyl oestradiol AUC(0,24 h) increased from 1014 pg ml−1 h after a single 50 μg dose during rifampicin therapy to 1747 pg ml−1 h when administered without rifampicin [26]. Phenytoin reduced ethinyl oestradiol AUC after a single 50 μg dose of ethinyl oestradiol from 806 to 411 pg ml−1h, while decreases from 1163 pg ml−1 h to 672 pg ml−1 h were observed with carbamazepine [27]. These pharmacokinetic changes have been attributed to induction of cytochrome P-450 enzymes, presumably increasing the oxidative metabolism of ethinyl oestradiol. Studies in human liver microsomes have shown that the hydroxylation of ethinyl oestradiol was increased by about four-fold during rifampicin treatment [28]. However, these inducers are generally not specific for one isozyme, and have been implicated in increasing glucuronidation reactions as well. In a liver obtained from a patient chronically treated with phenytoin and phenobarbitone, the rate of ethinyl oestradiol glucuronidation was about 2.4 fold higher than that in controls [29].
A positive relationship was observed between ethinyl oestradiol AUC ratios (Day 29:Day 1) and the 4 h ritonavir concentrations; at high ritonavir concentrations, the magnitude of the change in ethinyl oestradiol AUC was smaller. However, no significant relationship was observed between ethinyl oestradiol AUC ratios and trough ritonavir concentrations. Since the 24 h ritonavir AUC was not determined, the implication of the inconsistent correlation with the 0- and 4 h concentrations is unclear.
Considering the large decrease observed in ethinyl oestradiol concentrations with concomitant ritonavir administration, this interaction is most likely clinically significant, with an increased risk of failure of the oral contraceptive. The use of alternate contraceptive measures should be considered when ritonavir is being administered with ethinyl oestradiol.
References
- 1.Robins T, Plattner J. HIV protease inhibitors: their anti-HIV activity and potential role in treatment. J Acquir Immune Defic Syndr. 1993;6:162–170. [PubMed] [Google Scholar]
- 2.Kempf DJ, Marsh KC, Denissen JF, et al. ABT-538 is a potent inhibitor of human immunodeficiency virus protease and has high oral bioavailability in humans. Proc Natl Acad Sci. 1995;92:2484–2488. doi: 10.1073/pnas.92.7.2484. [DOI] [PMC free article] [PubMed] [Google Scholar]
- 3.Danner SA, Carr A, Leonard JM, et al. A short-term study of the safety, pharmacokinetics, and efficacy of ritonavir, an inhibitor of HIV-1 protease. N Engl J Med. 1995;333:1528–1533. doi: 10.1056/NEJM199512073332303. [DOI] [PubMed] [Google Scholar]
- 4.Markowitz M, Saag M, Powderly WG, et al. A preliminary study of ritonavir, an inhibitor of HIV-1 protease, to treat HIV-1 infection. N Engl J Med. 1995;333:1534–1539. doi: 10.1056/NEJM199512073332204. [DOI] [PubMed] [Google Scholar]
- 5.Kumar GN, Rodrigues AD, Buko AM, Denissen JF. Cytochrome P450-mediated metabolism of the HIV-1 protease inhibitor ritonavir (ABT-538) in human liver microsomes. J Pharmacol Exp Ther. 1996;277:423–431. [PubMed] [Google Scholar]
- 6.Orme ML, ’E ’E, Back DJ, Breckenridge AM. Clinical pharmacokinetics of contraceptive steroids. Clin Pharmacokin. 1983;8:95–136. doi: 10.2165/00003088-198308020-00001. [DOI] [PubMed] [Google Scholar]
- 7.Newburger J, Goldzieher JW. Pharmacokinetics of ethinyl estradiol: A current view. Contraception. 1985;32:33–44. doi: 10.1016/0010-7824(85)90114-3. [DOI] [PubMed] [Google Scholar]
- 8.Shenfield GM, Griffin JM. Clinical pharmacokinetics of contraceptive steroids—An update. Clin Pharmacokin. 1991;20:15–37. doi: 10.2165/00003088-199120010-00002. [DOI] [PubMed] [Google Scholar]
- 9.Guengerich FP. Minireview: Metabolism of 17α-ethinylestradiol in humans. Life Sci. 1990;47:1981–1988. doi: 10.1016/0024-3205(90)90431-p. [DOI] [PubMed] [Google Scholar]
- 10.Orme ML’E, Back DJ, Ball S. Pharmacokinetic drug interactions with oral contraceptives. Clin Pharmacokin. 1990;18:472–484. doi: 10.2165/00003088-199018060-00004. [DOI] [PubMed] [Google Scholar]
- 11.Jung-Hoffman C, Kuhl H. Pharmacokinetics and pharmacodynamics of oral contraceptive steroids: Factors influencing steroid metabolism. Am J Obstet Gynecol. 1990;163:2183–2197. doi: 10.1016/0002-9378(90)90560-t. [DOI] [PubMed] [Google Scholar]
- 12.Marsh KC, Eiden E, McDonald E. Determination of ritonavir, a new HIV protease inhibitor, in biological samples using reversed-phase high-performance liquid chromatography with electrochemical detection. J ChromatogrB. in press. [DOI] [PubMed]
- 13.Fieller E. Some problems in interval estimation. J Royal Stat Soc B. 1954;16:175–185. [Google Scholar]
- 14.Hsu A, Granneman GR, Witt G, et al. Multiple-dose pharmacokinetics of ritonavir in human immunodeficiency virus-infected subjects. Antimicrob Agents Chemother. 1997;41:898–905. doi: 10.1128/aac.41.5.898. [DOI] [PMC free article] [PubMed] [Google Scholar]
- 15.Perucca E. Clinical consequences of microsomal enzyme-induction by antiepileptic drugs. Pharmacol Ther. 1978;2:285–314. doi: 10.1016/0163-7258(87)90042-8. [DOI] [PubMed] [Google Scholar]
- 16.Guengerich FP. Oxidation of 17α-ethinylestradiol by human liver cytochrome P-450. Mol Pharmacol. 1988;33:500–508. [PubMed] [Google Scholar]
- 17.Temellini A, Giuliani L, Pacifici GM. Interindividual variability in the glucuronidation and sulphation of ethinyloestradiol in human liver. Br J Clin Pharmacol. 1991;31:661–664. doi: 10.1111/j.1365-2125.1991.tb05589.x. [DOI] [PMC free article] [PubMed] [Google Scholar]
- 18.Orme ML’E, Back DJ, Ball S. Interindividual variation in the metabolism of ethynylestradiol. Pharmacol Ther. 1989;43:251–260. doi: 10.1016/0163-7258(89)90121-6. [DOI] [PubMed] [Google Scholar]
- 19.Ouellet D, Hsu A, Granneman GR, et al. Assessment of the pharmacokinetic interaction between ritonavir (R) and clarithromycin (C) Clin Pharmacol Ther. 1996;59:143. doi: 10.1016/S0009-9236(98)90065-0. [DOI] [PubMed] [Google Scholar]
- 20.Hsu A, Granneman GR, Sun E, et al. Assessment of single- and multiple–dose interactions between ritonavir and saquinavir. ‘Abstract LB.B.6041’. XI International Conference on AIDS; 1996 July 7–12, Vancouver, BC, Canada.
- 21.Merry C, Barry MG, Mulcahy F, et al. Saquinavir pharmacokinetics alone and in combination with ritonavir in HIV-infected patients. AIDS. 1997;11:F29–F33. doi: 10.1097/00002030-199704000-00001. [DOI] [PubMed] [Google Scholar]
- 22.Hsu A, Dennis S, Baroldi P, et al. Pharmacokinetic interaction between ritonavir and indinavir. Keystone Conference on AIDS Pathogenesis; 1997 April 8–13, Keystone, CO.
- 23.Kumar GN, Grabowski B, Lee R, Denissen JF. Hepatic drug metabolizing activities in rats after 14 days of oral administration of the HIV-1 protease inhibitor ritonavir (ABT-538) Drug Metab Disp. 1996;24:615–617. [PubMed] [Google Scholar]
- 24.Cato A, Hsu A, Granneman R, et al. Assessment of the pharmacokinetic interaction between the HIV-1 protease inhibitor ABT-538 and zidovudine. ‘Abstract I34’. 35th ICAAC Annual Meeting; 1995 September 17–20, San Francisco, CA.
- 25.Hsu A, Granneman GR, Witt G, et al. Assessment of multiple doses of ritonavir on the pharmacokinetics of theophylline. ‘Abstract Mo.B.1200’. XI International Conference on AIDS; 1996 July 7–12, Vancouver.
- 26.Back DJ, Breckenridge AM, Crawford FE, et al. The effect of rifampicin on the pharmacokinetics of ethinylestradiol in women. Contraception. 1980;21:135–143. doi: 10.1016/0010-7824(80)90125-0. [DOI] [PubMed] [Google Scholar]
- 27.Crawford P, Chadwick DJ, Martin C, Tjia J, Back DJ, Orme M. The interaction of phenytoin and carbamazepine with combined oral contraceptive steroids. Br J Clin Pharmacol. 1990;30:892–896. doi: 10.1111/j.1365-2125.1990.tb05457.x. [DOI] [PMC free article] [PubMed] [Google Scholar]
- 28.Bolt HM, Kappus H, Bolt M. Effect of rifampicin treatment on the metabolism of oestradiol and 17α-ethinyloestradiol by human liver microsomes. Eur J Clin Pharmacol. 1975;8:301–307. doi: 10.1007/BF00562654. [DOI] [PubMed] [Google Scholar]
- 29.Pacifi GM, Back DJ. Sulfation and glucuronidation of ethinyloestradiol in human liver in vitro. J Steroid Biochem. 1988;31:345–349. doi: 10.1016/0022-4731(88)90360-3. [DOI] [PubMed] [Google Scholar]