Introduction
Post-marketing surveillance (PMS) is essential because the safety database on newly licensed drugs is limited by both the number and characteristics of the patients involved. In the UK, for example, successful applications for product licences for medicines containing new active substances include, as a safety database, information on a median number of 1480 (range 129–9400) patients [1]. Most of these patients will have been carefully chosen to have only one disease being treated with one drug. Few, if any of them, will be typical of the patients likely to receive the drug once it has been marketed.
The identification of uncommon, even if serious or lethal, adverse reactions from such a small number of highly selected patients is unlikely. This led the Committee on Safety of Drugs (the forerunner of today's Committee on Safety of Medicines) to conclude that ‘It is well recognised that no drug which is pharmacologically effective is without hazard. Furthermore not all hazards can be known before a drug is marketed: neither tests in animals nor clinical trials in patients will always reveal all the possible side effects of a drug. These may only be known when the drug has been administered to large numbers of patients over considerable periods of time’. The Committee on Safety of Drugs Annual Report [2] which contained these remarkable conclusions was for 1969/1970. Thus, for almost 30 years it has been recognised that drug safety in clinical practice cannot depend solely upon pre-marketing data.
The backbone of the post-marketing techniques that have been developed to survey the use of newly marketed drugs in large populations is provided by the hypothesis-generating methods, including spontaneous adverse drug reaction (ADR) reporting and prescription-event monitoring (PEM). The findings of such studies can be confirmed or refuted by hypothesis-testing techniques, such as case-control or cohort studies or randomised controlled clinical trials.
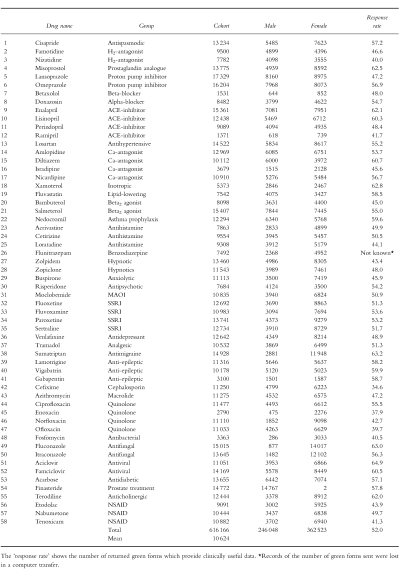
Computerised clinical data are currently available from completed PEM studies of 58 newly marketed medicines and, as shown in Table 1, these studies have an average cohort size of 10 624 (median 11 081; range 1371–17 329) patients. Thus, PEM frequently enlarges the available safety database on newly marketed medicines. It also provides information on the ‘real-world’ use of these medicines: the data show the age, sex and geographical distribution that typifies the everyday clinical use of these drugs in general medical practice.
Table 1.
Details of 58 complete PEM studies.
This paper briefly reviews the methodology of PEM and the current and planned activities that relate to this technique.
Methods
PEM is a non-interventional, observational cohort form of pharmacovigilance. It is non-interventional in the sense that nothing happens to interfere with the doctor's decision regarding which drug to prescribe for each individual patient. If ‘real-world’ data are required then this is essential.
In the UK virtually all persons are registered with a general practitioner (GP) who provides primary health care and issues prescriptions (FP10s) for the medicines considered medically necessary. The patient takes the prescription to a pharmacist who dispenses the medication and then sends the FP10 to a central Prescription Pricing Authority (PPA) which arranges the reimbursement of the pharmacist. The Drug Safety Research Unit (DSRU) is, under long-standing and confidential arrangements, provided with electronic copies of all those prescriptions issued throughout England for the drugs being monitored by PEM. These arrangements continue for a collection period adequate to allow exposure data (FP10s) to be collected for twenty to thirty thousand patients. For each of these patients the DSRU prepares a longitudinal record comprising, in date order, all prescriptions for the monitored drug. Thus, in PEM, the exposure data are national in scope throughout the collection period and unaffected by the kind of selection and exclusion criteria that characterise clinical trials data. The exposure data are of drugs dispensed and provided to the patient but there is no method of measuring compliance or the use of non-prescription medication.
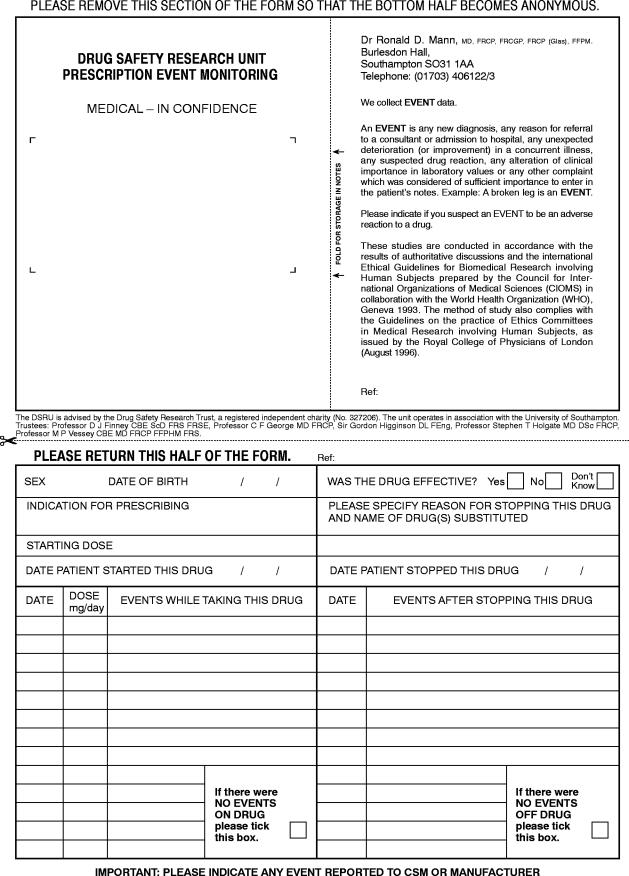
After an interval of 3 to 12 (usually 6) months from the first prescription for each patient the DSRU sends to the prescriber a ‘green form’ questionnaire seeking information on any ‘events’ which may have occurred since the drug was first prescribed. This takes place on an individual patient basis but no more than four green forms are sent to each doctor in any 1 month. The green form is illustrated in Figure 1 which includes the definition of an event and shows the other information requested of the GP.
Figure 1.
The ‘Green Form’ questionnaire.
The doctor is not paid to provide this information which is given in the interests of drug safety. The arrangements allow good contact between the doctor and the DSRU and this facilitates the collection of any follow-up data that may be considered necessary by the research physicians monitoring each study and working within the DSRU. All pregnancies during treatment or within 3 months of stopping the drug being monitored, and any deaths for which the cause is not known or which may be related to the medication, are followed up by contact with the GP, the Office for National Statistics or the authorities of the National Health Service.
Over the 58 studies listed in Table 1 an average of 58.2% of the green forms have been returned by the GPs to the DSRU. The cohort sizes, as given in Table 1, are derived from the mean 52.0% of returned green forms which provide clinically useful data.
It should be noted that PEM collects event data and does not ask the doctor to determine if any particular event is due to an adverse drug reaction (ADR). If, however, the doctor does consider the event to be an ADR or he has completed a yellow card (a spontaneous adverse drug reaction report) regarding the event, then he is asked to indicate this on the green form.
Each PEM study starts as soon as possible after the new drug has been marketed in England. Each study aims to collect clinically useful data on a minimum of 10 000 patients. The drugs to be included in the system are (as recommended by the 2nd Grahame-Smith Working Party Report [3]) those intended for wide-spread, general practitioner use. The exposure data are derived from the prescriptions written by GPs attending the patients; the outcome data are derived from the green forms completed by these same GPs. Each green form is seen by a medical or scientific member of the DSRU staff on the day of receipt so that important events can be investigated straight away. All data are computerised in the DSRU and important events, pregnancies and deaths are further investigated by the DSRU Research Fellows who can, with the permission of the GP, access the patient's life-time medical records, death certificate etc.
Interim analyses are prepared to summarise the data on each study every 2500 patients. These analyses include a listing, by month since the beginning of treatment, of all events reported. They are, if possible, discussed with the Product Licence holder so that reporting obligations to the regulatory bodies can be fulfilled. PEM is undertaken in a collaborative but never commissioned relationship with the drug originator. The DSRU is an independent registered medical charity (No.327206) but is extensively supported by donations from the pharmaceutical industry.
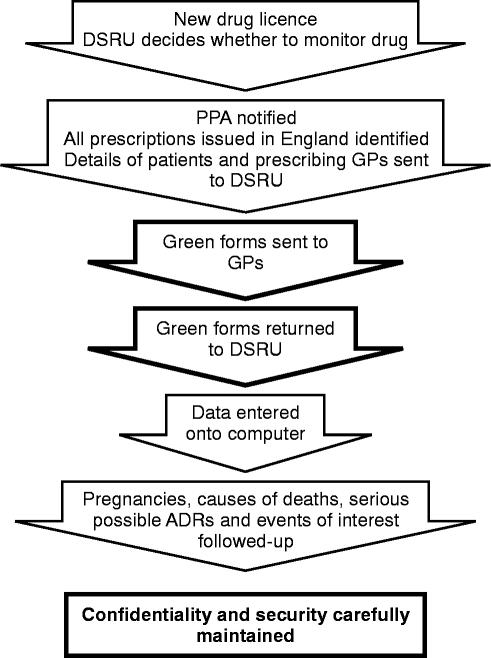
The methodology of PEM is summarised in Figure 2 and further details including the methods of data coding, computerisation and analysis, have been provided in recent publications [4–6].
Figure 2.
Prescription-event monitoring (PEM) method.
Recent activities
1 Incidence density
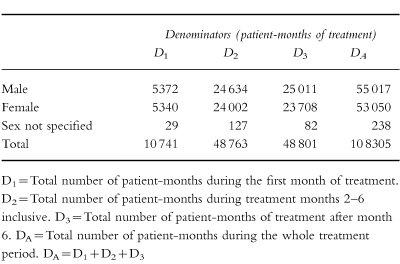
PEM provides a numerator (the number of reports) and a denominator (the number of patient-weeks or months of exposure), both collected within a known time frame (the difference, for each patient, between the start and stop dates of the drug being monitored).
The Incidence Density (ID) for a given time period, t, for each of the 1658 event terms in the DSRU dictionary is calculated, as follows:-
 |
The IDs are then ranked to give estimates of the frequency of reported events.
An example, for lamotrigine, is given in Tables 2a and 2b. These tables show the IDs of the five most commonly reported events with this anti-epileptic agent. Extensive additional examples, giving the ranked IDs for 40 drugs examined by PEM, have recently been provided in a separate publication [4].
Table 2.
(a) Lamotrigine denominators. (b)Lamotrigine incidence densities.

2 Comparison of ‘Reasons for withdrawal’ and incidence densities
The green form asks the doctor to specify the ‘Reason for stopping’ the drug being monitored if, in fact, treatment was stopped. The DSRU has collected this information since 1987 and has computerised the results since 1991. For 21 long-term use drugs, the ‘Reasons for stopping’ (in terms of the number of reports of each event) have been compared with the IDs for the first month of therapy in each individual patient (ID1 ). As an example, data for the proton-pump inhibitor, lansoprazole, are given in Table 3. A number of other examples have been recently published [5, 6].
Table 3.
The ranked incidence density and the ranked ‘Reasons for stopping’. Lansoprazole (proton-pump inhibitor) Cohort size 14 874.
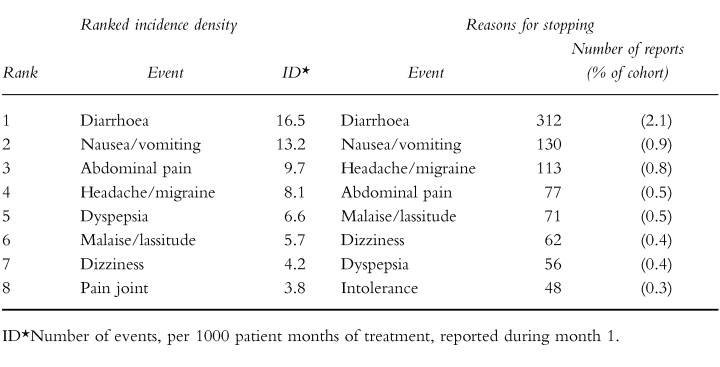
The top ten reasons for stopping have been compared with the top ten ID1 values for the 21 drugs. Sixteen (76%) of the 21 drugs had seven or more events common to both lists.
For these 21 drugs it is possible to quantify the degree of correlation between ‘Reason for stopping’ and ID1 and work continues on studying this correlation and its clinical significance.
3 The outcome of exposed pregnancies
All pregnancies reported during PEM studies are followed up by the medical and scientific staff of the DSRU in order to determine the outcome in those babies exposed in utero to the drugs being monitored.
A recent report [7] has shown that 2508 pregnancies have been followed up in 34 PEM studies. The study drug was known to have been dispensed during 904 of these pregnancies (839 during the first trimester and 65 during the second/third trimesters). The first trimester pregnancies produced 553 live births among which 20 (3.6%) abnormalities were reported.
These data will soon be published in final and amended form because they add substantially to those currently available.
This work is of interest as these observational data may be of especial value to those who need to advise on the care and continuation of pregnancies exposed to newly marketed medicines.
4 Generation and exploration of signals
Signals can be generated by an event having an unusually high ID or high ranking in the ‘Reasons for stopping’ medication. Alternatively, it may be noticed that the pattern of the number of reports from week to week or month to month may suggest a relationship to exposure to the drug being monitored. Such a signal can be strengthened by comparing the age and sex adjusted relative risks of the drug being monitored with these values for comparable drugs already studied by PEM. Such comparisons can be stratified by time period and are facilitated by the existing size of the PEM database. They are at their best when the comparator drugs and the monitored drug have the same indication for clinical use. Nested case-control studies can also be undertaken when necessary.
Statistically confirmed signals can be validated by medical follow-up of each report for the event concerned so that the nature of an apparent association (chance, bias, confounding, channelling or causality etc.) can be explored.
The most recently published confirmed and validated signal was gynaecomastia with finasteride [8]. This side effect was detected prior to the relevant specific warning being included in the data sheet for the drug. We have also reported on visual field defects in patients taking vigabatrin [9], the incidence of hallucinations associated with tramadol [10], gastrointestinal intolerance due to acarbose [11] and oesophageal reactions associated with alendronate [12].
5 Long latency adverse reactions
Delayed reactions can be detected by sending out further questionnaires relating to those patients shown in the initial PEM survey to be receiving long-term medication. One such study has provided reassuring data on the safety of long-term lamotrigine in epilepsy [13] and a similar study is planned to explore further the problem of visual field defects in patients taking vigabatrin [9, 14]. Whenever delayed or long latency reactions are suspected or need to be excluded the incidence densities for each month of the study can be tested for trend effects and repeat surveillance with a second set of green forms or questionnaires can be sent out, as with lamotrigine [13].
6 Investigation of diseases
The PEM database provides a valuable opportunity to study diseases as well as drugs. It has been noticed that the incidence density of upper respiratory tract infections in the first month of exposure to long-term medications (ID1 ) varies only slightly from that in the second to sixth months of therapy (ID2 ). This is perhaps to be expected for such infections occurring during the use of newly marketed drugs of the types studied are unrelated to either the drug or the disease being treated. A report [15] on this study is in press and further studies of diseases are in progress.
Discussion
Spontaneous reporting schemes such as that in the UK are concerned only with suspected ADRs. They depend on the suspicion of the reporter that the reaction may be due to a drug. They rely on the clinician taking the initiative to report. PEM, by contrast, is concerned with all events: it does not require the clinician to make a judgement regarding causality, and it prompts the making of a report by issuance of the green form.
PEM is best regarded as a hypothesis-generating method of pharmacovigilance. Hypothesis testing methods include case-control studies, comparative cohort studies and randomised controlled clinical trials. As an example of these methods, the protocol for a retrospective nation-wide study of myocardial infarction and oral contraceptives [16] has been published by the DSRU and the study is in progress.
The advantages of PEM are that it is non-interventional (and thereby minimises the biases that occur when the study design interferes with the doctor's choice of drug for the individual patient), that it is national in scale (so that the cohort comprises all patients in England given the drug immediately after its launch into general practice) and that the system prompts all prescribers who automatically receive a green form for each patient prescribed the drug being monitored. These features ensure that the studies are population based and that they disclose the real-life clinical experience with the drug: there are no exclusions and all patients prescribed the drug are monitored even if they are very old, very young, or receiving several drugs concurrently for multiple illnesses. Because the data are concerned with events the system could theoretically detect side-effects which none of the doctors has suspected to be due to the drug. Additionally, the technique allows direct contact between the doctors working in the DSRU so that follow-up surveillance of individual cases, deaths or pregnancies can be undertaken. PEM can also explore the possibility of long-latency adverse reactions. Additional advantages accrue from the size of the PEM database which has been built up since 1984 using essentially unchanged methods of data gathering and computerisation. This database contains information on 58 drugs and over 600 000 patients. As time passes and more studies are completed (20 are currently in progress) the value of the database as a research tool increases progressively.
The disadvantages and limitations of PEM are, however, real. Over the 58 separate studies listed in Table 1 an average of 58.2 (range 39.6 to 74.1) per cent of the green forms sent out have been returned. This represents riches compared with the reporting rate in spontaneous ADR reporting schemes but could conceal biases as we have not yet demonstrated whether the patients whose doctors do return the green forms are in any way different from those whose doctors fail to complete and return the questionnaire. Since 1984 the mean response rate has fallen only very slowly (at a rate of 1% per 2 years 10 months). PEM does not yet extend into hospital monitoring although pilot studies are underway. Thus, for drugs started in hospital it is important to follow-up reports of interest in order to identify the first prescriptions. Even so, a ‘survivor bias’ seems likely to operate because patients who both started and stopped a drug in hospital may never receive a GP prescription and may, therefore, be undetected by PEM in its present form. None of the current methods of pharmacovigilance is ideal in respect of this problem—hence the importance of extending PEM into hospital practice. An additional limitation is that there is no measure of compliance (although data are gathered on dispensed prescriptions only). As with other hypothesis-generating methods of pharmacovigilance the data may include unidentified confounders and this possibility limits the usefulness of the findings and may necessitate further studies using hypothesis-testing methods, such as randomised controlled clinical trials. Illegible prescriptions are not a problem in PEM as they are sorted out by the PPA. There is a possible bias introduced into the data if the patients of the doctors who do not return the green form differ from those of the responding doctors. We already know that these two groups of GPs differ very little in the distribution of ages in which they became principals or in their geographical distribution [17] but studies of this possible bias continue. A final problem is the operational difficulties concerned with collecting the outcome data by paper-based questionnaire. These practical problems will not disappear until fully computerised general practice is established throughout England.
Future plans concern hospital monitoring, establishing a registry of iatrogenic diseases, monitoring by community pharmacists, pan-European monitoring by networking with other suitable units and the establishment of an investigational unit in which the mechanisms of some uncommon ADRs identified by PEM can be explored.
Conclusions
Prescription-Event Monitoring is a valuable and well-established method of hypothesis-generating pharmacovigilance. Its use since 1984 has produced a substantial database which itself forms an important research tool. The future developments of this technique and of the other methods of pharmacoepidemiology associated with it have been outlined.
Acknowledgments
I wish to thank the vast number of general practitioners who have taken part in these studies. I am also most grateful for the cooperation of the Prescription Pricing Authority and the NHS authorities. My colleagues and collaborators in these studies have been Dr Lynda Wilton, Dr Nick Dunn, Dr Fiona Mackay, Dr Richard Martin, Mrs Gill Pearce and Mr Shayne Freemantle. I also wish to thank Mrs Georgina Spragg for administrative assistance.
References
- 1.Rawlins MD, Jefferys DB. Study of United Kingdom product licence applications containing new active substances, 1987–9. Br Med J. 1991;302:223–225. doi: 10.1136/bmj.302.6770.223. [DOI] [PMC free article] [PubMed] [Google Scholar]
- 2.Committee on Safety of Drugs. Report for 1969 and 1970. London: HMSO; 1971. [Google Scholar]
- 3.Mann RD. The yellow card data: the nature and scale of the adverse drug reactions problems. In: Mann RD, editor. Adverse drug reactions. Carnforth, UK: Parthenon Publishing; 1987. pp. 62–63. [Google Scholar]
- 4.Freemantle SN, Pearce GL, Wilton LV, Mackay FJ, Mann RD. The incidence of the most commonly reported events with 40newly marketed drugs—a study by Prescription-Event Monitoring. Pharmacoepidemiology and Drug Safety. 1997;6:1. [Google Scholar]
- 5.British Medical Association. Reporting Adverse Drug Reactions. A BMA policy document. London: British Medical Association; 1996. [Google Scholar]
- 6.Mann RD, Wilton LV, Pearce GL, Mackay FJ, Dunn NR. Prescription-Event Monitoring (PEM) in 1996—a method of non-interventional observational cohort pharmacovigilance. Pharmacoepidemiology and Drug Safety. 1997;6(Suppl.3):S5–S11. doi: 10.1002/(SICI)1099-1557(199710)6:3+<S5::AID-PDS272>3.0.CO;2-F. [DOI] [PubMed] [Google Scholar]
- 7.Wilton LV, Mackay F, Pearce G, Mann RD. The outcomes of pregnancy in women prescribed newly marketed drugs in 34 studies conducted by Prescription-Event Monitoring (PEM) Pharmacoepidemiology and Drug Safety. 1997;6 Abstract 072. [Google Scholar]
- 8.Wilton L, Pearce G, Edet E, Freemantle S, Stephens MDB, Mann RD. The safety of finasteride used in benign prostatic hypertrophy a non-interventional observational cohort study in 14 772 patients. Br J Urology. 1996;78:379–384. doi: 10.1046/j.1464-410x.1996.00091.x. [DOI] [PubMed] [Google Scholar]
- 9.Stephens MDB, Wilton LV, Pearce G, Mann RD. Visual field defects in patients taking vigabatrin. Pharmacoepidemiology and Drug Safety. 1997;6(Suppl.2) doi: 10.1002/(sici)1099-1557(199904)8:1+<s9::aid-pds406>3.3.co;2-3. Abstract 041. [DOI] [PubMed] [Google Scholar]
- 10.Dunn N, Wilton LV, Pearce G, Mann RD. The incidence of hallucinations associated with tramadol. Pharmacoepidemiology and Drug Safety. 1997;6(Suppl.2) Abstract 042. [Google Scholar]
- 11.Mackay F, Wilton LV, Pearce G, Freemantle S, Mann RD. Acarbose and gastrointestinal intolerance. Pharmacoepidemiology and Drug Safety. 1997;6(Suppl.2) Abstract 044. [Google Scholar]
- 12.Mackay F, Wilton LV, Pearce G, Freemantle S, Mann RD. Alendronate and oesophageal reactions. Pharmacoepidemiology and Drug Safety. 1997;6(Suppl.2) doi: 10.1002/(SICI)1099-1557(199707)6:4<235::AID-PDS293>3.0.CO;2-3. Abstract 045. [DOI] [PubMed] [Google Scholar]
- 13.Mackay FJ, Wilton LV, Pearce GL, Freemantle SN, Mann RD. Safety of long-term lamotrigine in epilepsy. Epilepsia. 38:881–886. doi: 10.1111/j.1528-1157.1997.tb01252.x. [DOI] [PubMed] [Google Scholar]
- 14.Eke T, Talbot JF, Lawden MC. Severe persistent visual field construction associated with vigabatrin. Br Med J. 1997;314:180–181. doi: 10.1136/bmj.314.7075.180. [DOI] [PMC free article] [PubMed] [Google Scholar]
- 15.Wilton LV, Freemantle S, Martin RM, Mann RD. Is the incidence of upper respiratory infections independent of drug treatment in large cohort studies? Proceedings of the European Society of Pharmacovigilance, Berlin 1997. Pharmacoepidemiology and Drug Safety. (in press) [DOI] [PubMed]
- 16.Dunn NR, Thorogood M, deCaestecker L, Mann RD. Myocardial infarction and oral contraceptives, a retrospective case control study in England and Scotland (‘MICA’ Study) Pharmacoepidemiology and Drug Safety. 1997;6:283–289. doi: 10.1002/(SICI)1099-1557(199707)6:4<283::AID-PDS270>3.0.CO;2-F. [DOI] [PubMed] [Google Scholar]
- 17.Mackay F. Postmarketing Studies: the value of the work of the Drug Safety Research Unit. Drug Safety. 1998. (in press)


