

Introduction
Gentamicin is an aminoglycoside antibiotic that is active against gram-negative aerobic bacilli and is standard therapy in the prophylaxis and treatment of gram-negative infections [1]. Febrile neutropenic patients are at risk of developing overwhelming septicaemia if not treated appropriately and aminoglycosides in combination with beta-lactam antibiotics are the standard empirical therapy in many centres [1].
There is evidence that the efficacy of aminoglycosides in patients with gram-negative bacteriaemia is influenced by the early achievement of a high peak to MIC ratio [2]. Increased aminoglycoside volume of distribution and clearance have been reported in adult patients with several types of solid and haematological malignancies. Manny & Huston [3]) found a distribution volume for all aminoglycosides of 0.41 (0.13 l kg−1 ) while Higa & Murray [4] identified a volume of distribution 1.14 times and clearance 1.63 times higher in cancer patients compared with the rest of the population. More recently, Inciardi et al. [5] performed a population pharmacokinetic study of gentamicin in cancer patients using a nonparametric expectaction maximization (NPEM) algorithm and estimated volume of distribution to be 0.30 l kg−1. Similar results were found by Ordores et al. [6]. Bertino et al. [7] compared the pharmacokinetics of gentamicin in 235 patients with malignancies with 645 patients with no malignancies and they found no differences in volume or clearance. Although both recent chemotherapy and neutropenia have been proposed as explanations for these observations, the reason for the apparent increase in volume is not known.
Creatinine clearance is commonly used as an indicator of renal function and since gentamicin is eliminated almost exclusively by glomerular filtration, creatinine clearance estimates are often employed to determine initial doses of gentamicin. There are several methods of estimating creatinine clearance of which the most widely used is the Cockcroft-Gault equation [8]. This equation was derived from 249 male patients with stable renal function and it relates creatinine clearance to age, weight, sex and creatinine concentration. The factor for females was arbitrarily chosen. However, there are limitations to the value of creatinine concentration as a measure of glomerular filtration rate. Creatinine is produced as a byproduct of muscle metabolism [9] and its formation can be affected by several disease states and factors such as diet, exercise, age, and low muscle mass. Under these circumstances clearance of creatinine estimated from measured creatinine concentrations is a poor indicator of renal function [10, 11]. The correction of the measured creatinine concentration to a minimum of 88.4 μmol l−1 (1 mg dl−1 ) has been proposed by some investigators [11, 12] while others have found that 60 μmol l−1 is a useful cut-off [13].
The purpose of this study was to describe the population pharmacokinetics of gentamicin in patients with cancer. In addition, since several factors have been shown to influence the pharmacokinetics of gentamicin, the aim was to identify possible relationships between clinical covariates and population pharmacokinetic parameter estimates. Finally, this study examines the relevance of existing dosage nomograms in light of the population model developed in these patients.
Methods
Patients
Data were collected prospectively from January 1993 to August 1996. Patients with cancer who received gentamicin and had at least one measured serum gentamicin concentration were eligible for inclusion in the study.
Gentamicin was administered intravenously either by a short infusion over 10–30 min or as a slow bolus over 2–3 min. The exact times of all doses and blood samples were recorded as part of the routine drug monitoring and entered into the database. Initial dosage regimens were calculated according to the patient's renal function [14] and adjusted to achieve peak concentrations (1 h post dose) of 8–12 mg l−1 and troughs <2 mg l−1. For each patient the following information was also collected: gender; weight; age; height; creatinine; urea; albumin; platelets; haemoglobin; white cell count; and temperature. Biochemical and haematological factors, and temperature, were generally checked daily during therapy. Patients were classified as obese if the actual body weight exceeded the ideal body weight by 20% and pyrexia was defined as a temperature equal to or above 38° C. Additional clinical factors such as ideal body weight [15], body surface area [16], body mass index, and lean body mass [17] were determined. The measurement of creatinine concentration closest in time to each measured gentamicin concentration was used to estimate creatinine clearance. Patients with missing clinical, dosage or sampling data and patients with rapidly changing renal function were excluded from the study.
The data were then split into two sets: a population data set comprising two thirds of the data and a test data set comprising the remaining third. Patients were randomly allocated to either the population or the test data set.
Drug assay
Gentamicin serum concentrations were analysed by the Microbiology Department of the West Glasgow Hospitals Trust using fluorescence polarization immunoassay (TDx, Abbott Laboratories). The limit of quantification was 0.1 mg l−1 and the interassay coefficients of variation were 6.3% at 1 mg l−1, 3.7% at 4 mg l−1 and 4.3% at 8 mg l−1.
Population analysis
Data were entered into a spreadsheet package then analysed with the population pharmacokinetic package NONMEM (version IV) developed by Beal & Sheiner [18]. FORTRAN subroutines were compiled using FORTRAN Power Station (version 1.0a, Microsoft Corporation). Both programs were implemented on an Opus personal computer with a Pentium processor.
One and two compartment open models were fitted to the gentamicin concentration-time data and the two compartment model was parameterised to give estimates of clearance (CL), central volume of distribution (V1 ), peripheral volume of distribution (V2 ) and intercompartmental clearance (Q) using the ADVAN 3 and TRANS 4 subroutines.
A log normal distribution was assumed on intersubject variability (η) and the pharmacokinetic parameters of the jth subject (Pj) were therefore described by the following equation:
where P represents the typical population values of clearance, volume of the central compartment, intercompartmental clearance and volume of the peripheral compartment and ηpj, are the differences between the population estimates and the estimate for the jth subject. ηs were assumed to be Gaussian distributed with mean zero and variance ω2η.
The following residual error models were compared:
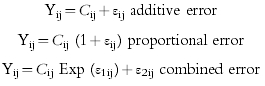 |
where Cij are the predicted and Yij the measured concentrations of the jth individual at the ith sampling time and εij are the residual errors. Residual errors (ε) represent the differences between the model and the data and contain contributions from intraindividual variability, assay error and model misspecification. ε are assumed to follow a normal distribution with a mean of zero and a variance ω η2.
A stepwise approach was used to analyse the data. Exploratory analysis was first carried out to examine distributions of covariates and identify any abnormalities in clinical factors. Pearson correlation coefficients were calculated to identify associations among covariates that might influence the model.
The best structural and variance model was then used to generate individual Bayesian parameter estimates of clearance and volume using the POSTHOC option in NONMEM. Scatter plots were then examined of pharmacokinetic parameters against the following covariates: age; gender; weight; height; ideal body weight; creatinine concentration; urea concentration; albumin concentration; white cell count, haemoglobin; platelet count; temperature; obesity; lean body mass; body mass index and body surface area. Similar scatter plots were also produced using weighted residuals (WRES).
Covariates identified by this preliminary analysis were then investigated using NONMEM. Each was included in the clearance model separately then the one that caused the greatest fall in objective function was retained and others were added sequentially until the best model was obtained. Central volume of distribution (V1 ) peripheral volume (V2 ) and intercompartmental clearance (Q) were examined using a similar approach then a step-down removal of each factor was carried out on the full model.
The influence of low creatinine concentrations was investigated by deriving three new covariates corresponding to three different minimum or ‘threshold’ creatinine values as follows:
(i) All creatinine concentrations less than or equal to 60 μmol l−1 were set to 60 μmol l−1(the lower limit of the reference range used in the hospital).
(ii) All creatinine concentrations less than or equal to 70 μmol l−1 were set to 70 μmol l−1 (an arbitrary intermediate value).
(iii) All creatinine concentrations less than or equal to 88.4 μmol l−1 were set to 88.4 μmol l−1 (equivalent to 1 mg dl−1 as recommended in references 11 and 12).
Models were compared by examining residual plots, the precision of parameter estimates, intersubject and residual variability and the value of the objective function. A reduction in the objective function (−2 log likelihood difference), between a full and reduced model of more than 7.9 was considered statistically significant with P<0.005 and one degree of freedom.
Model evaluation
Evaluation of the models obtained from the population analysis was performed using the test data set. Only the first set of concentration measurements was used in the evaluation since in clinical practice population estimates are only used to determine initial doses and thereafter individualised estimates based on measured concentrations are used to adjust dosage regimens.
Concentrations were predicted for each patient at each sampling time using the dosing history and relevant clinical data. Prediction errors were then calculated to evaluate how well the population model predicted the measured concentrations. These prediction errors were obtained by subtracting the measured concentrations from the predicted concentrations and were defined as percentage prediction error as follows:
where Cij is the jth predicted concentration in ith individual and Yij is the measured concentration. An unpaired t-test was used to test whether the mean prediction error was significantly different from zero, with statistical significance set at P<0.05.
The models and parameter estimates that described interindividual variability and residual error were evaluated by simulating 1000 concentrations for each measured concentration in the test data set using the population model and parameter estimates. The probability that a measured concentration lay within the 2.5–97.5 percentile range of the simulated concentration was calculated for each individual then a mean was determined for the whole test data set. If the variance model adequately described the data, 95% of the measured concentrations should lie within this range.
Dosage guidelines
The best model was used to estimate parameters for the full data set formed by merging the population and test data sets. The results of this analysis were then used to predict the concentration-time profile in simulated patients who were aged 50 years, weighed 70 kg, had heights of 1.70 m and albumin concentrations of 40 g l−1. Two creatinine concentrations were used, which corresponded to creatinine clearances of 25 ml min−1 and 105 ml min−1. One thousand simulations were performed for each simulated patient, and the median (25–75 percentile range) concentration-time profiles were determined according to two published nomograms: one that used a ‘once daily’ regimen [19] and one based on traditional target ranges [14].
Results
Patients
Data were collected from 210 patients of whom 140 were allocated to the population data set and 70 to the test set. The dosing history, time of blood sampling and measured concentrations were recorded in addition to the demographic and clinical characteristics summarized in Table 1. Eighteen percent of measured concentrations were from obese patients and median ideal body weight was 59.2 kg, (range 38.0–82.2 kg). The median body surface area was 1.7 m2 (range 1.3–2.3 m2 ).
Table 1.
Summary of demographic and clinical characteristics of patients included in the study.
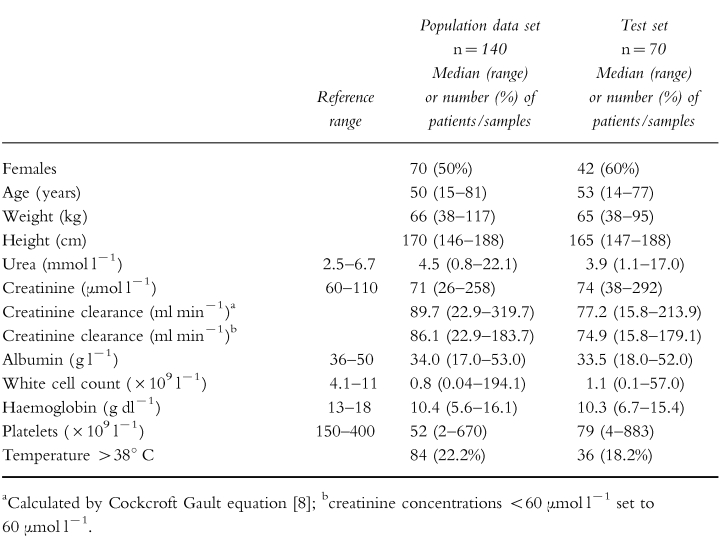
Individual gentamicin doses ranged from 40 mg to 300 mg and the sampling times from 1 to 26 h after the dose. Three hundred and seventy-eight concentrations were available for analysis, ranging from 0.1 mg l−1–13.5 mg l−1 with a median of 1.6 mg l−1. The number of concentrations varied from 1 to 9 per patient, except for three patients who had several different courses of treatment which generated 14, 17 and 22 measurements. Fifty-seven percent of the measured concentrations were troughs and 92% were measured within the first 7 days of therapy.
Data analysis
The two compartment model was found to be superior to the one compartment model. There was a log likelihood difference of 86.3 and an improvement in the plot of weighted residuals against time post-dose. The one compartment model produced a trend towards overestimation of concentrations at early time points and underestimation at later times. In contrast, no pattern was observed with the two compartment model. The combined residual error model was superior to both the additive and proportional models. This basic model yielded a mean population clearance estimate of 4.39 l h−1, V1 of 13.9 l, V2 of 13.4 l and an intercompartmental clearance of 2.21 l h−1. The intersubject variability was 33.9% on CL and 15.5% on V1 but the intersubject variabilities on Q and V2 were very low with wide standard errors, i.e. indeterminate. The standard deviations of the residual error were 0.38 mg l−1 at 1 mg l−1 and 1.17 mg l−1 at 8 mg l−1.
Correlation analysis revealed no unexpected relationships among covariates that might have confounded the analysis. Possible relationships between POSTHOC clearance and age, ideal body weight, weight, lean body mass, height, gender, body surface area, urea, creatinine concentration and creatinine clearance were identified from scatter plots. Haematological indices (haemoglobin, white cell count, platelet count) showed no obvious trends nor did the presence or absence of pyrexia. Volume of distribution tended to increase with indices of body size: weight; height; body surface area; and lean body mass, and decrease with serum albumin concentration.
Analysis of single covariates by NONMEM identified weight, age, height, ideal body weight, albumin, urea, creatinine clearance, gender, body surface area and lean body mass as influencing clearance. These preliminary results identified two approaches that could be used for model development. The first involved building the model from an estimate of creatinine clearance calculated from age, weight, creatinine concentration and gender (the creatinine clearance approach). The second approach used the individual and easily measurable clinical characteristics such as age, weight, height and serum creatinine concentration (the clinical factors approach).
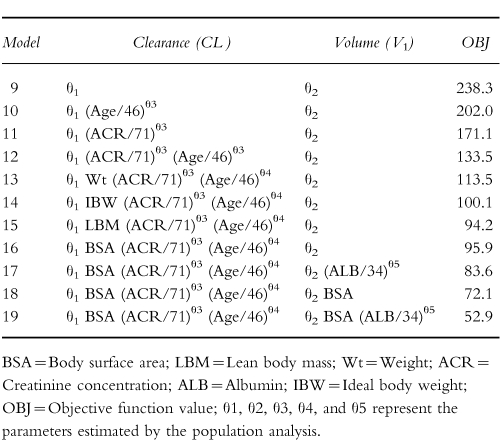
With the creatinine clearance approach, in addition to a linear relationship between creatinine clearance and gentamicin clearance, a linear relationship was found between volume of the central compartment and body surface area (or lean body mass) and a nonlinear relationship with albumin (model 8, Table 2). BSA was chosen for inclusion in the model as a measure of body size because it was superior to weight and is widely used in oncology. No covariates were found that influenced V2 and Q. The comparison of creatinine clearance models produced the results shown in Table 2 and the results of the clinical factors approach are presented in Table 3. The best clinical factors model contained body surface area, creatinine concentration, age and albumin concentration (model 19, Table 3). As BSA gave the same results as height and weight, but required one less parameter, BSA was chosen as the covariate. A step down analysis confirmed the influence of each covariate in the final model. No significant improvement in fit was obtained with the addition of pyrexia, obesity or gender to either of the full models.
Table 2.
Summary of the principal models investigated using creatinine clearance estimates.
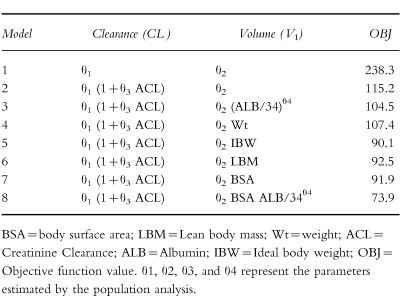
Table 3.
Summary of the principal models investigated using clinical factors.
The results obtained using three different minimum creatinine concentrations are presented in Table 4. With the creatinine clearance model there was no major difference between using a lower value of 60 μmol l−1 or 70 μmol l−1 (they were associated with a drop in objective function of 42 and 45, respectively) but both were superior to 88.4 μmol l−1 (associated with a drop of only 12.9) and with no minimum. In contrast, 70 μmol l−1 proved the optimal minimum with the clinical factor model (improvement in objective function of 35). The weighted residuals plots were consistent with these results.
Table 4.
Results obtained using various creatinine concentration limits in the full models.
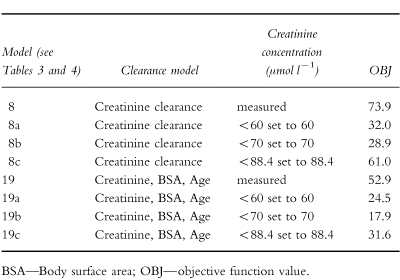
Comparison of the two best models (model 8a and 19b—Table 4) by examination of the plots and by the error associated with the parameter estimates allowed no firm conclusion to be drawn.
Model evaluation
The data set used in the evaluation included 70 patients and 132 concentrations. Table 1 shows the demographic characteristics of this group of patients.
The mean percentage prediction error was −7.2% for the model based on creatinine clearance and −6.6% for the model based on clinical factors. There was no bias in the prediction errors. The probability that a measured concentration lay within the 2.5–97.5 percentile of the simulated concentration was 0.9 for both models. Figure 1 shows the 2.5–97.5 percentile range of the simulated concentration for each data point for all patients with peak and trough concentrations.
Figure 1.

Measured concentrations (•), population predicted concentrations (○) and 2.5–97.5 percentile range of 1000 simulations in the test data set.
Dosage guidelines
The parameters obtained by fitting the full data set are shown in Table 5. Models 8a and 19b, (Table 4) gave similar results, but due to its simplicity, the model based on creatinine clearance (using creatinine concentrations set to 60 μmol l−1 ) was selected for the evaluation of dosage guidelines arising from two nomograms. Figure 2 shows the population mean concentration-time profiles and the 25–75 percentile range when the dosage guidelines were followed in two sets of 1000 simulated patients, one with normal renal function and one with renal impairment.
Table 5.
Parameter estimates from the two best models using the full data set (n=210).
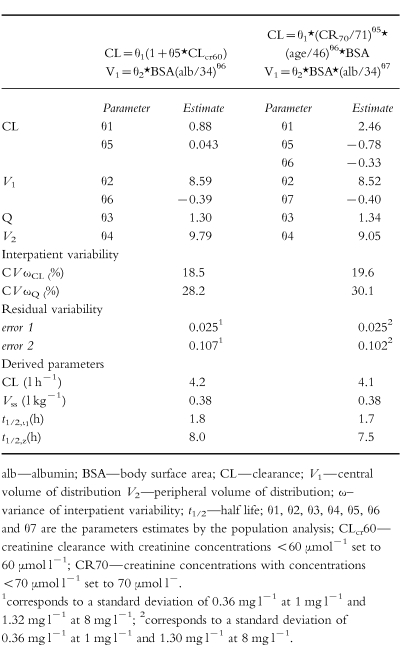
Figure 2.

Simulated mean and the 50% interquartile range of the concentration-time profile obtained using the best model with two different nomograms. Panel a—‘Once daily’ nomogram [19], patient with creatinine clearance 105 ml min−1; b—Once daily nomogram [19], patient with creatinine clearance 25 ml min−1; c—Traditional nomogram [14], patient with creatinine clearance 105 ml min−1; d—Traditional nomogram [14], patient with creatinine clearance 25 ml min−1.
Discussion
Although the pharmacokinetics of the aminoglycoside antibiotic gentamicin have been extensively studied, only limited and conflicting data have been published on the most appropriate pharmacokinetic model. For example, a one compartment model is usually assumed in clinical settings but several studies have found that gentamicin pharmacokinetics are better described by a two or three compartment model [20–22]. Furthermore, with particular respect to patients with cancer, there are conflicting reports about the magnitude of the volume of distribution. In this study, the pharmacokinetics of gentamicin in patients with cancer have been investigated and characterized using a population approach applied to data collected during routine therapeutic drug monitoring.
The population mean clearance estimate was 4.2 l h−1 which is consistent with 4.6 l h−1/1.73 m2 reported by Bertino et al. [7]. As expected, estimated creatinine clearance and serum creatinine concentration were the covariates that had the strongest influence on gentamicin clearance. However, the relatively high intercept obtained is probably because few patients had creatinine clearance estimates <30 ml min−1. It is therefore important that these results are not extrapolated to patients with very poor renal function in whom gentamicin clearance might be overestimated. The use of estimated creatinine clearance as a measure of renal function has some limitations, especially with low serum creatinine concentrations, and to overcome this problem some authors have recommended the use of a creatinine concentration corrected to 88.4 μmol l−1 (1 mg dl−1 ) for concentrations less than or equal to 88.4 μmol l−1 [11, 12]. However, other authors feel this might lead to underdosing of some patients [10, 23]. Duffull et al. [13] found that a better prediction of clearance was obtained when all serum creatinine values below 60 μmol l−1 were set to 60 μmol −1. In our institution, values of creatinine concentration less than 60 μmol l−1 are set to 60 μmol l−1 (the lower limit of the reference range) for estimating gentamicin clearance and calculating dosage recommendations. The present study investigated the consequences of setting low creatinine concentrations to 60 μmol l−1, 70 μmol l−1 or 88.4 μmol l−1. There was little difference using creatinine concentration set to 60 μmol l−1 or 70 μmol l−1 when the creatinine clearance model was applied (model 8), whereas for the model including clinical values (model 19) the best fit was obtained when low creatinine concentrations were set to 70 μmol l−1 (Table 4). With both models the value 88.4 μmol l−1 was too high, however, better than using the measured creatinine concentration.
The influence of gender on gentamicin clearance remains unclear. Cockcroft & Gault [8] suggested a correction factor of 0.85 for women but this value was chosen arbitrarily. Phillips et al. [24] suggested that adjustment for gender was not necessary. In the present study gender included as a single covariate was associated with a significant influence on clearance but, in the final clinical factors model, the influence of gender was not significant. One possible explanation is that any gender difference in clearance is already taken into account via the differences in body surface area.
Gentamicin volume of distribution in oncology patients remains the subject of debate. It is often reported to range between 0.25 and 0.31 l kg−1 in adults from a general population [25, 26] whereas in cancer patients an increased volume of distribution in the range 0.38 l kg−1– 0.43 l kg−1 has been reported [24, 27, 28]. In contrast, however, Bertino et al. [7] performed a study in 235 cancer patients and found a mean volume of distribution of 0.35 l kg−1 compared with 0.34 l kg−1 for the control group. These authors concluded that the volume of distribution of gentamicin was not increased in patients with cancer. More recently, MacGowan et al. [22] reported a volume of distribution of 24.5 l in patients with haematological malignancies. In our study the value of 0.38 l kg−1, equivalent to 24.6 l, is consistent with the values reported by both Bertino et al. [7] and MacGowan et al. [22] in similar patients. However, the differences in volume of distribution in the published literature may simply reflect different sampling protocols and the application of different pharmacokinetic models.
Significant relationships were found between volume of the central compartment (V1 ), measures of body size (IBW, LBM, Wt and BSA) and serum albumin concentration. A relationship between low serum albumin and volume of distribution was also reported by Etzel et al. [29] and, in a study of amikacin in cancer patients, Davis et al. [28] detected a significant influence of albumin on volume of distribution. In contrast, Phillips et al. [24] found no influence of albumin on volume of distribution but they did not report the range of albumin concentrations in their study. Since low serum albumin concentrations have been shown to alter intra- and extra-cellular fluid distributions, leading to an expanded extracellular fluid volume, the low range of values in the present study may have favoured the identification of the influence of albumin on the volume of distribution. In our study volume of distribution ranged from 0.55 to 0.35 l kg−1 with albumin concentrations of 17 g l−1–53 g l−1.
Gentamicin concentration-time profiles are often characterized by two compartment models and in the present study the half-life for the initial phase was 1.7 h (range 0.8–3.8 h), which is similar to previous observations [20–22, 30, 31]. However, the half-life of the late phase was found to be 8.0 h (3.7–17.8) which is significantly shorter than in other reports. Laskin [20], for instance, identified a terminal elimination half-life of 94 h, although this only became dominant 12 h after administration of gentamicin. In contrast, Aarons et al. [30] reported a much shorter terminal half-life of 26.6 h for the related aminoglycoside tobramycin but, according to these authors, limitations of their study design prevented identification of the long-terminal elimination phase. A similar limitation probably applies to our results: a long-terminal half-life was not identified because 71% of the concentrations were measured in the first 12 h post dose and only two patients had concentrations taken 25 h after the gentamicin administration. As our data were collected during the first few days of routine monitoring, tissue accumulation would have been incomplete and the protracted elimination phase would not have been appropriately characterized. Lack of data at later times post dose probably also contributed to the inability to estimate intersubject variability on Q and V2.
The large residual error corresponding to a standard deviation of about 0.36 mg l−1 at low concentration values (1 mg l−1 ) contrasts with the lower residual error, a standard deviation of 1.32 mg l−1 obtained at high concentrations (8 mg l−1 ). Large residual errors may reflect poor assay performance and precision at low concentrations [32] although the assay standard deviation in this case was only 0.06 mg l−1 at 1 mg l−1. Examination of the data identified a few patients in whom trough concentrations were unexpectedly higher or lower than predicted by the model and it is likely that these data points contributed to the high variability observed.
It has been shown that high gentamicin peak concentrations are associated with a better outcome and that target peak serum gentamicin concentrations should ideally be above 7 mg l−1 [2]. The dosage regimen recommended using the traditional nomogram [14] yielded serum gentamicin concentrations within the target range (peak greater than 7 mg l−1 and trough less than 2 mg l−1 ) for patients with normal renal function (Figure 2, panel c). However, in renal impairment, the mean peak concentration obtained from dosage regimens derived from the traditional nomogram [14] was slightly lower than ideal (between 6 and 7 mg l−1 as shown in Figure 2 panel d). Target concentrations for the high dose regimen have not yet been established but very high peaks and low troughs should be obtained in patients with both normal and impaired renal function (Figure 2 panels a and b).
In conclusion, this NONMEM analysis has shown that creatinine clearance estimated from creatinine concentrations was associated with a better fit when low values were set to 60 or 70 μmol l−1 rather than using the measured creatinine concentration. Volume of distribution was similar to values estimated by other authors and was influenced by body surface area and serum albumin concentration. Examination of the results in the context of published nomograms has indicated that both the traditional approach and the new, ‘once daily’ approach should generally achieve satisfactory concentrations in this patient group although due to the high interpatient and residual variabilities, serum concentration monitoring is required to confirm optimal dosing in individual patients.
Acknowledgments
The authors greatly appreciate the statistical help and advice from Dr Lilian Murray, Department of Medicine & Therapeutics, University of Glasgow. This study was supported by a grant from Programa PRAXIS XXI, Portugal.
References
- 1.International Antimicrobial Therapy Cooperative Group of the European Organization for Research and Treatment of Cancer. Efficacy and toxicity of single daily doses of amikacin and ceftriaxone versus multiple daily doses of amikacin and ceftazidime for infection in patients with cancer and granulocytopenia. Ann Intern Med. 1993;119:584–593. doi: 10.7326/0003-4819-119-7_Part_1-199310010-00006. [DOI] [PubMed] [Google Scholar]
- 2.Moore RD, Lietman P, Smith CR. Clinical response to aminoglycoside therapy: Importance of the ratio of peak concentration to minimal inhibitory concentration. J Infect Dis. 1987;155:93–99. doi: 10.1093/infdis/155.1.93. [DOI] [PubMed] [Google Scholar]
- 3.Manny RP, Huston PR. Aminoglycoside volume of distribution in hematology-oncology patients. Clin Pharm. 1986;5:629–632. [PubMed] [Google Scholar]
- 4.Higa GM, Murray WE. Alterations in aminoglycoside pharmacokinetics in patients with cancer. Clin Pharm. 1987;6:963–966. [PubMed] [Google Scholar]
- 5.Inciardi JF, Batra KK. Nonparametric approach to population pharmacokinetics in oncology patients receiving aminoglycoside therapy. Antimicrob Agents Chemother. 1993;37:1025–1027. doi: 10.1128/aac.37.5.1025. [DOI] [PMC free article] [PubMed] [Google Scholar]
- 6.Ordovas JP, Ronchera CL, Poveda JL, Jimenez NV, Lopez R. Selection of optimal prophylactic aminoglycoside dosage in cancer patients: population pharmacokinetic approaches. J Clin Pharm Ther. 1994;19:47–56. doi: 10.1111/j.1365-2710.1994.tb00809.x. [DOI] [PubMed] [Google Scholar]
- 7.Bertino JS, Booker LA, Franck P, Rybicki B. Gentamicin pharmacokinetics in patients with malignancies. Antimicrob Agents Chemother. 1991;35:1501–1503. doi: 10.1128/aac.35.7.1501. [DOI] [PMC free article] [PubMed] [Google Scholar]
- 8.Cockcroft DW, Gault H. Prediction of creatinine clearance from serum creatinine. Nephron. 1976;16:31–41. doi: 10.1159/000180580. [DOI] [PubMed] [Google Scholar]
- 9.Lau AH, Berk SI, Prosser T, Stonich T. Estimation of creatinine clearance in malnourished patients. Clin Pharm. 1988;7:62–65. [PubMed] [Google Scholar]
- 10.Smythe M, Hoffman J, Kizy K, Dmuchowski C. Estimating creatinine clearance in elderly patients with low serum creatinine concentrations. Am J Hosp Pharm. 1994;51:198–204. [PubMed] [Google Scholar]
- 11.Gral T, Young M. Measured versus estimated creatinine clearance in the elderly as an index of renal function. J Am Geriatr Soc. 1980;28:492–496. doi: 10.1111/j.1532-5415.1980.tb01127.x. [DOI] [PubMed] [Google Scholar]
- 12.Zarowitz BJ, Robert S, Peterson EL. Prediction of glomerular filtration rate using aminoglycoside clearance in critically ill medical patients. Ann Pharmacother. 1992;26:1205–1210. doi: 10.1177/106002809202601001. [DOI] [PubMed] [Google Scholar]
- 13.Duffull SB, Kirkpatrick CMJ, Begg EJ. Comparison of two Bayesian approaches to dose-individualization for once-daily aminoglycoside regimens. Br J Clin Pharmacol. 1997;43:125–135. doi: 10.1046/j.1365-2125.1997.05341.x. [DOI] [PMC free article] [PubMed] [Google Scholar]
- 14.Thomson AH, Duncan N, Silverstein B, Alcock S, Jodrell D. Development of guidelines for gentamicin dosing. J Antimicrob Chemother. 1996;38:885–893. doi: 10.1093/jac/38.5.885. [DOI] [PubMed] [Google Scholar]
- 15.Devine BJ. Gentamicin therapy. Drug Intell Clin Pharm. 1974;8:650–655. [Google Scholar]
- 16.Du Bois D, Du Bois EF. Clinical calorimetry. A formula to estimate the approximate surface area if height and weight be known. Arch Intern Med. 1916;17:863–871. [PubMed] [Google Scholar]
- 17.Hallynck TH, Soep HH, Thomis JA, Boelaert J, Daneels R, Dettli L. Should clearance be normalised to body surface area or to lean body mass? Br J Clin Pharmacol. 1981;11:523–525. doi: 10.1111/j.1365-2125.1981.tb01163.x. [DOI] [PMC free article] [PubMed] [Google Scholar]
- 18.Beal SL, Sheiner LB. NONMEM Users Guides, parts I—VII. University of California, San Francisco: Technical Report; 1992. [Google Scholar]
- 19.Nicolau DP, Freeman CD, Belliveau PP, Nightingale CH, Ross JW, Quintiliani R. Experience with a once-daily aminoglycoside program administered to 2184 adult patients. Antimicrob Agents Chemother. 1995;39:650–655. doi: 10.1128/AAC.39.3.650. [DOI] [PMC free article] [PubMed] [Google Scholar]
- 20.Laskin OL, Longstreth JA, Smith CR, Lietman PS. Netilmicin and gentamicin multidose kinetics in normal subjects. Clin Pharmacol Ther. 1983;34:644–650. doi: 10.1038/clpt.1983.227. [DOI] [PubMed] [Google Scholar]
- 21.Schentag JJ, Jusko WJ, Vance JW, et al. Gentamicin disposition and tissue accumulation on multiple dosing. J Pharmacokinet Biopharm. 1977;5:559–577. doi: 10.1007/BF01059684. [DOI] [PubMed] [Google Scholar]
- 22.MacGowan AP, Bedford KA, Blundell E, et al. The pharmacokinetics of once daily gentamicin in neutropenic adults with haematological malignancy. J Antimicrob Chemother. 1994;34:809–812. doi: 10.1093/jac/34.5.809. [DOI] [PubMed] [Google Scholar]
- 23.Bertino JS. Measured versus estimated creatinine clearance in patients with low serum creatinine values. Ann Pharmacother. 1993;27:1439–1442. doi: 10.1177/106002809302701203. [DOI] [PubMed] [Google Scholar]
- 24.Phillips JK, Spearing RL, Crome DJ, Davies JM. Gentamicin volumes of distribution in patients with hematologic disorders. N Engl J Med. 1988;319:1290. doi: 10.1056/NEJM198811103191918. [DOI] [PubMed] [Google Scholar]
- 25.Zaske DE. Aminoglycosides. In: Evans WE, Schentag JJ, Jusko WJ, editors. Applied Pharmacokinetics. Principles of therapeutic drug monitoring. 3. Vancouver: Applied Therapeutics, Inc.; 1992. pp. 14–1–14–47. [Google Scholar]
- 26.Sande MA, Mandell GL. Antimicrobial agents. In: Gilman AG, Rail TW, Nies AS, Taylor P, editors. The Aminoglycosides, The Pharmacological Basis of Therapeutics. 9. New York: Pergamon Press; 1996. pp. 1103–1121. [Google Scholar]
- 27.Zeitany RG, Saghir NE, Santhosh-kumar CR, Sigmon MA. Increased aminoglycoside dosage requirements in hematologic malignancy. Antimicrob Agents Chemother. 1990;34:702–708. doi: 10.1128/aac.34.5.702. [DOI] [PMC free article] [PubMed] [Google Scholar]
- 28.Davis RL, Lehmann D, Stidley CA, Neidhart J. Amikacin pharmacokinetics in patients receiving high-dose cancer chemotherapy. Antimicrob Agents Chemother. 1991;35:944–947. doi: 10.1128/aac.35.5.944. [DOI] [PMC free article] [PubMed] [Google Scholar]
- 29.Etzel JV, Nafziger AN, Bertino JS. Variation in the pharmacokinetics of gentamicin and tobramycin in patients with pleural effusions and hypoalbuminemia. Antimicrob Agents Chemother. 1992;36:679–681. doi: 10.1128/aac.36.3.679. [DOI] [PMC free article] [PubMed] [Google Scholar]
- 30.Aarons L, Vozeh S, Wenk M, Follath W, Follath F. Population pharmacokinetics of tobramycin. Br J Clin Pharmacol. 1989;28:305–314. doi: 10.1111/j.1365-2125.1989.tb05431.x. [DOI] [PMC free article] [PubMed] [Google Scholar]
- 31.Wenk M, Spring P, Vozeh S, Follath F. Multicompartment pharmacokinetics of netilmicin. Eur J Clin Pharmacol. 1979;16:331–334. doi: 10.1007/BF00605631. [DOI] [PubMed] [Google Scholar]
- 32.White LO, MacGowan AP, Lovering AM, Holt HA, Reeves DS, Ryder D. Assay of low trough serum gentamicin concentrations by fluorescence polarization immunoassay. J Antimicrob Chemother. 1994;33:1068–1070. doi: 10.1093/jac/33.5.1068. [DOI] [PubMed] [Google Scholar]