Abstract
Aims
To determine whether lean body mass (LBM), a possible surrogate of liver and kidney volumes, correlates with hepatic and renal drug clearances.
Methods
Twenty-one disease-free patients with a history of cancer and with normal hepatic and renal function were studied. Salivary pharmacokinetics of oral antipyrine (1200 mg) and 24 h creatinine clearance were determined following the determination of LBM by dual energy X-ray absorptiometry and the determination of liver and kidney volumes by helical CT scanning.
Results
Liver volume correlated with LBM (r2 = 0.21, P = 0.04), body surface area (BSA) (r2 = 0.54, P < 0.001), and total body weight (TBW) (r2 = 0.61, P < 0.001). Kidney volume correlated with LBM (r2 = 0.49, P < 0.001), BSA (r2 = 0.43, P = 0.002) and TBW (r2 = 0.24, P = 0.03). Stepwise multiple regression analysis, incorporating the independent variables of age, height, weight, sex, BSA, LBM, alcohol consumption, smoking status and liver volume and the dependent variable antipyrine clearance, indicated that LBM was the only independent correlate of antipyrine clearance. A stepwise multiple regression analysis with kidney volume in the independent variables, and creatinine clearance as dependent variable, showed that kidney volume and age were the only independent correlates of creatinine clearance. A nomogram using serum creatinine and LBM was comparable with the Cockcroft and Gault nomogram in calculating creatinine clearance.
Conclusions
Of the anthropometric variables tested, LBM was the only determinant of antipyrine clearance, but this was not due to a relationship between LBM and liver volume. By contrast, the relationship between creatinine clearance and LBM appeared to be due to a relationship between LBM and kidney volume.
Keywords: antipyrine clearance, creatinine clearance, kidney volume, lean body mass, liver volume
Introduction
There is a wide variation in drug clearance among individuals and our ability to predict individual drug clearance is limited. Numerous attempts have been made to predict drug clearance from anthropometric characteristics but it remains unclear which of these parameters is most useful [1–4]. Estimates of body size have been most commonly used, in particular total body weight (TBW) and body surface area (BSA) [2, 4–10]. It has been suggested that lean body mass (LBM) may be more appropriate than TBW or BSA for individualising drug dosage [3, 11]. LBM consists of body cell mass, extracellular water and nonfat connective tissue and is essentially fat-free mass, but includes the fat in cell membranes [12]. It is within the body cell mass, which is the major component of LBM, that over 99% of the body’s metabolic processes takes place [13].
The main organs responsible for drug elimination are the liver and kidneys. Since the number of hepatocytes and hepatic blood flow are functions of liver volume, hepatic drug clearance might be expected to be a function of liver volume. Evidence to support this has been found with antipyrine; however, drug metabolising activity g−1 liver is also an important determinant of antipyrine elimination [14–17]. Similarly, the number of nephrons, and therefore glomerular filtration rate, can be related to renal volume [18].
For many drugs eliminated predominantly by the liver, there is a correlation between systemic drug clearance and LBM [3]. It has been postulated that this correlation may be due to the presence of a direct relationship between liver volume and LBM, since the liver is part of the lean compartment [3]. Whether such a relationship exists is not known. Limited data suggest that LBM may be a useful predictor of creatinine clearance [19]. This also points to the possibility of an association between kidney volume and LBM because the kidney is also part of the lean compartment.
In the current study we have examined the ability of LBM to predict both hepatic and renal clearances in the same individual. In order to determine whether LBM predicts hepatic and renal clearances by virtue of LBM being a surrogate measurement of liver and kidney volumes, we have determined the relationship between hepatic and renal volumes and LBM.
Methods
Patients
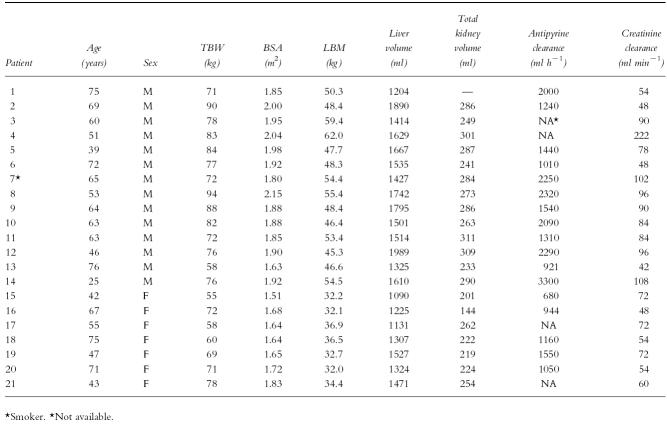
Twenty-one patients (14 male, 7 female, median age 63 years, range 25–76 years), with a history of cancer but no evidence of metastatic disease, who were presenting for a routine CT scan as part of their ongoing assessment, participated in the study. One patient was a smoker. All patients had no known heart, liver or kidney disease detected on clinical examination or biochemical and haematological screening and all had a normal ECG and chest X-ray. They had received no chemotherapy or radiation therapy, or any medication known to affect hepatic or renal drug elimination for 6 months prior to entering the study. The patients consented in writing to participate in the study on the basis of written and oral information, and the study was approved by the human ethics committee of the Austin and Repatriation Medical Centre.
Study procedure
Determination of liver and kidney volumes
Liver and kidney volumes were determined by helical CT scanning with a Siemens Somatom Plus S whole-body CT scanner. The scans were performed as part of the patients’ clinical assessment for the presence of metastatic disease. A precontrast scan and a postcontrast scan were performed. Both of these scans were used to evaluate the patients’ disease. Only the precontrast helical CT scan was used to determine the organ volume. The total kidney volume for patient 1 was unavailable due to an incomplete CT scan. We have shown previously that the accuracy and bias for the determination of liver and kidney volumes with this method are 95.6 and 3.1%, respectively [20].
Determination of lean body mass
LBM was determined by dual energy X-ray absorptiometry (DEXA). This technique is based on the assumption that the body consists of two main compartments, bone and soft tissue. These two compartments are distinguished by measuring the photon attenuation at two discrete photon energies, which distinguishes between fat, fat-free mass and bone. The radiation exposure is one-tenth that of a standard chest X-ray. DEXA has an accuracy for the determination of LBM of greater than 98%, with a coefficient of variation of between 1 and 3% [21, 22].
Determination of total body surface area
BSA was determined using the Dubois formula [23], shown below:
where weight is in kg, height is in cm and surface area is in m2.
Antipyrine pharmacokinetics
Patients were admitted to the Oncology Day Ward of the Austin and Repatriation Medical Centre. Prior to antipyrine administration, a saliva sample was taken. This was done by subjects first rinsing their mouth with water and then chewing a piece of Parafilm (American Can Company, Greenwich, CT), to stimulate saliva flow. The saliva was then deposited into a plastic vial and stored at −20° C until analysed. Once the predose saliva sample was taken 1200 mg antipyrine was administered orally. The antipyrine dose, in two hard gelatin capsules, each containing 600 mg antipyrine, was administered orally with 100 ml of water. Patients were than asked to sample their own saliva at 3, 5, 8, 24 and 32 h after administration of antipyrine, in the same way as the predose sample. Of the patients entered, four patients (two males and two females) did not take the 1200 mg dose of antipyrine because they had difficulty swallowing or withdrew from the study.
Creatinine clearance
Creatinine clearance was determined using a 24 h urine collection and serum creatinine concentration. Patients were responsible for the collection of their own urine. When collecting their urine, patients were instructed to discard the first specimen, and then to collect all urine for a period of 24 h into the plastic bottle provided. Patients were asked to bring the urine to the clinic within 24 h of finishing the collection. A blood sample was then taken for determination of serum creatinine concentration.
Analytical methods
Antipyrine
Antipyrine concentrations in saliva were assayed by an h.p.l.c. method described previously [24]. At concentrations of 2.5, 12.5 and 25 μg ml−1 intra-assay and interassay coefficients of variation were less than 3.4 and 6.0%, respectively, and accuracy was within 3%.
Creatinine
Urine and serum creatinine concentrations were determined by autoanalyser at the Department of Biochemistry, Austin and Repatriation Medical Centre. The coefficients of variation for the measurement of serum creatinine concentration (at 0.13 mmol l−1) and urine creatinine concentration (at 7.4 mmol l−1) were 3.9% and 3%, respectively.
Data analysis
Area under the salivary antipyrine concentration vs time curve (AUC) was determined by the trapezoidal rule, with extrapolation to infinity. Antipyrine clearance was calculated as dose/AUC, assuming complete absorption. Creatinine clearance was determined from serum creatinine and urinary creatinine excretion rate and was also predicted from the Cockcroft & Gault formula which uses serum creatinine, TBW, sex and age [25]. Relationships among pharmacokinetic parameters and patient variables were examined by linear regression analysis on untransformed and log-transformed data using SigmaStat for Windows version 1.0 (Jandel Scientific, San Rafael, CA, USA). Data were tested for normality by using the Kolmogorov-Smirnov test. The data were also analysed by stepwise multiple regression using SPSS version 6.1.3 (SPSS Inc. Chicago, USA). A probability of P < 0.05 was considered significant.
Results
Details of patients, including LBM, TBW, BSA and liver and kidney volumes, are presented in Table 1. There was large interpatient variation in the clearance of antipyrine, which ranged from 680 to 3300 ml h−1 and in creatinine clearance, which ranged from 42 to 222 ml min−1 (Table 1).
Table 1.
Patient demographics and pharmacokinetics.
Liver volume correlated with LBM (Figure 1a, r2 = 0.21, P = 0.04), BSA (Figure 1b, r2 = 0.54, P < 0.001) and TBW (Figure 1c, r2 = 0.61, P < 0.001). Kidney volume correlated with LBM (Figure 2a, r2 = 0.49, P < 0.001), BSA (Figure 2b, r2 = 0.43, P = 0.002) and TBW (Figure 2c, r2 = 0.24, P = 0.03). There was no correlation between liver or kidney volume and age.
Figure 1.
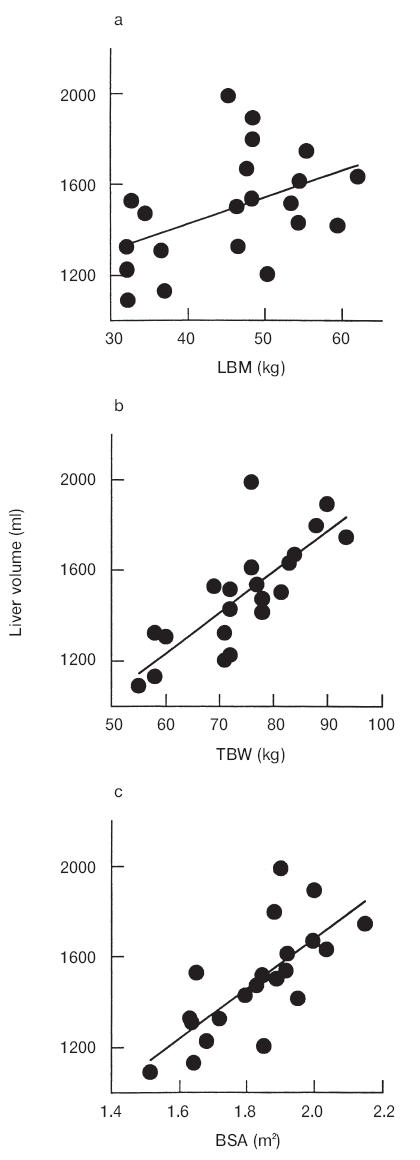
Relationship between liver volume and (a) LBM (r2 = 0.21, P < 0.05), (b) TBW (r2 = 0.61, P < 0.05) and (c) BSA (r2 = 0.54, P < 0.05).
Figure 2.
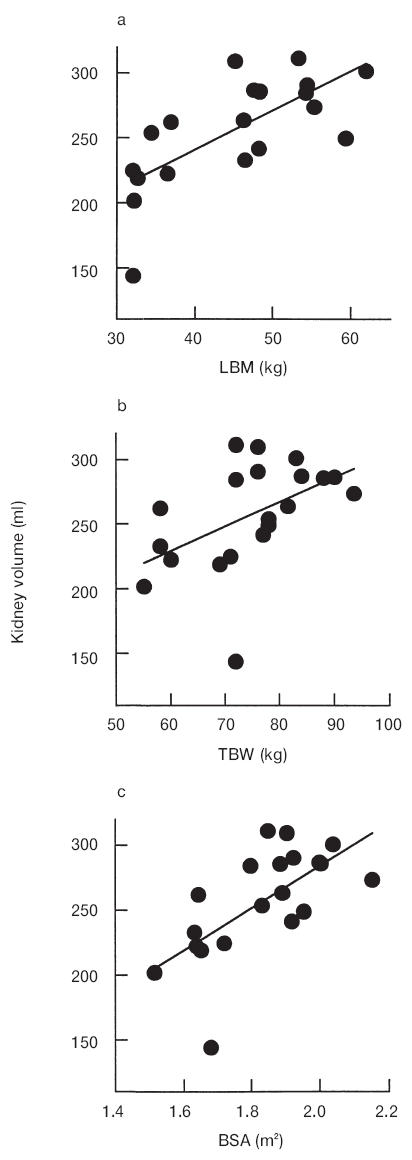
Relationship between kidney volume and (a) LBM (r2 = 0.49, P < 0.001), (b) TBW (r2 = 0.24, P < 0.05) and (c) BSA (r2 = 0.43, P < 0.05).
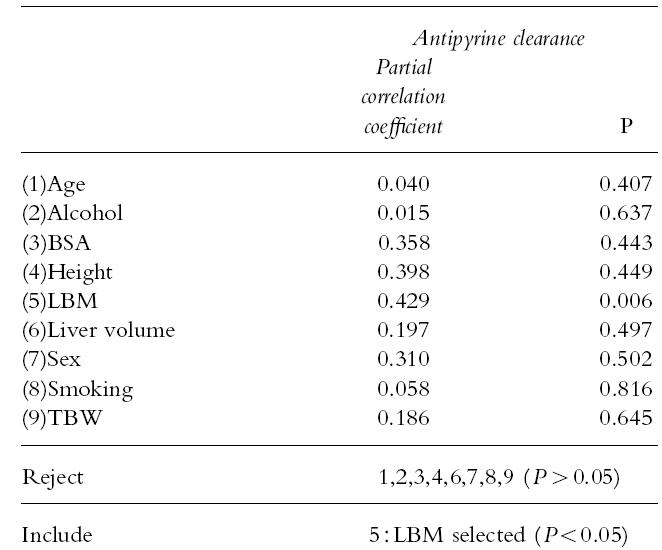
To investigate possible correlates of antipyrine clearance, stepwise multiple regression analysis was conducted, including age, height, weight, sex, BSA, LBM, alcohol consumption, smoking status, and liver volume. LBM was the only significant correlate of antipyrine clearance (Table 2). Age was associated with antipyrine clearance in a univariate (r2 = 0.25, P = 0.04) but not in a multivariate analysis (Table 2).
Table 2.
Stepwise multiple regression analysis of antipyrine clearance against patient variables.
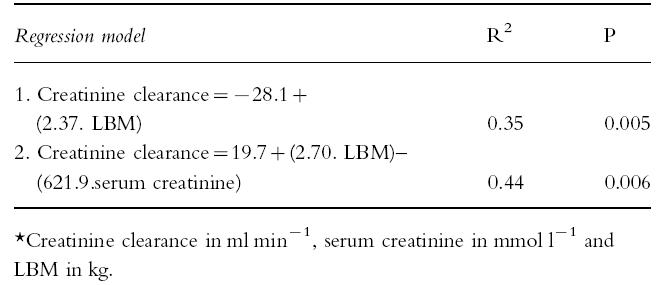
There was a univariate correlation between creatinine clearance and LBM (r2 = 0.35, P = 0.005). Stepwise multiple regression analysis showed that kidney volume and age were the only correlates of creatinine clearance (Table 3), whether or not the outlier (subject 4,Table 1) was included in the analysis. Using multiple linear regression analysis two models were developed which relate creatinine clearance to LBM either alone or in combination with serum creatinine (Table 4). Model 2 was in better agreement with the measured creatinine clearance (r2 = 0.53) than model 1 (r2 = 0.28) and similar agreement with the creatinine clearance calculated by the Cockcroft & Gault formula (r2 = 0.49) which uses serum creatinine, sex, TBW and age.
Table 3.
Stepwise multiple regression analysis of creatinine clearance against patient variables.
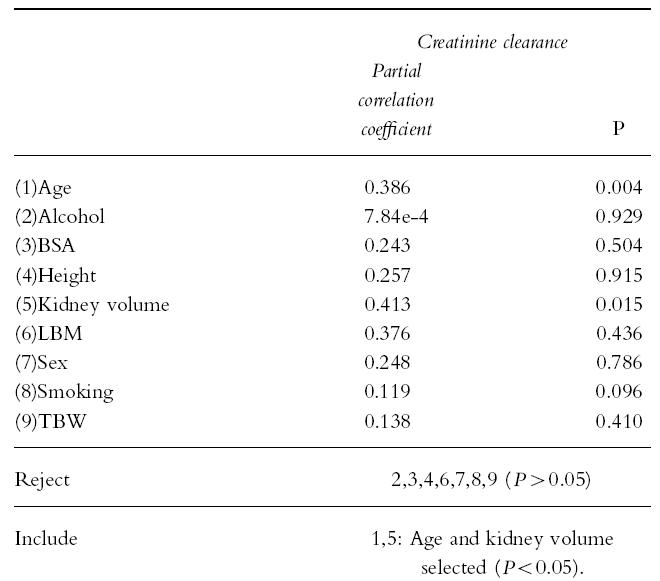
Table 4.
Multiple linear regression predictive models of creatinine clearance for pooled data (n = 21)*.
Discussion
It has been postulated that the correlation between hepatic clearance and LBM observed with many drugs may be due to LBM being a surrogate marker for liver volume [3]. However, liver volume was not a correlate of antipyrine clearance (Table 2) and there was only a weak correlation between liver volume and LBM (Figure 1a). By contrast, there was a high correlation between liver volume and TBW (Figure 1b), as reported previously [14, 26]. Therefore, other physiological factors are likely to be more important than liver volume in accounting for the association between antipyrine clearance and LBM.
Previous investigations of the relationship between antipyrine clearance and liver volume have also found only a weak correlation (r2 = 0.29–0.48) [14–17]. The conclusion from these investigations was that interpatient variability in hepatic enzyme activity is a more important determinant of antipyrine clearance than liver volume. It should be noted, however, that these studies [14–16] used ultrasound to measure liver volume, a less accurate technique for determining organ volume than CT scanning [27]. This difference in methodology may account for the difference in correlation between antipyrine clearance and liver volume in the present study. As there was no correlation between clearance and liver volume for antipyrine, a drug with extremely broad isoform specificity [28], then there is probably little chance of a correlation with probes which reflect specific isoform activity.
In the present study, antipyrine clearance decreased with age, as found by previous investigators [16, 17]. However, in this study age was not an independent correlate of antipyrine clearance, perhaps in part because of the smaller sample size.
Stepwise multiple linear regression analysis revealed that overall interpatient differences in age and kidney volume were the main sources of variability in creatinine clearance (Table 3). The good correlation between kidney volume and LBM suggests therefore that LBM does act as a surrogate marker of kidney volume in the correlation with creatinine clearance. The correlation between creatinine clearance and kidney volume was probably due to the fact that creatinine is mainly cleared by glomerular filtration and the number of glomeruli present is proportional to kidney volume [18].
It has been suggested by Hallynck et al. [29] that LBM should be a better index of body size than TBW or BSA in nomograms for converting serum creatinine to creatinine clearance. The Cockcroft & Gault nomogram [25], which uses serum creatinine concentration, age and TBW, was found to account for 49% of the variability of measured creatinine clearance. Of the two predictive models developed using LBM alone and in combination with serum creatinine concentration (Models 1 and 2, respectively,Table 4), model 1 was inferior to the Cockcroft & Gault method, whereas, Model 2 was comparable to the Cockcroft & Gault method. These preliminary findings suggest that LBM provides no advantage over TBW for use in predictive formulae of creatinine clearance, in contrast to the hypothesis of Hallynck et al. [29].
It has been proposed recently that in a population of subjects, drug clearance will be more accurately related to TBW by a power function with an exponent power of 0.75 rather than by a linear relationship [2]. In the present study, none of the log-transformed univariate relationships between antipyrine clearance and body size measurements had slopes which were near to 0.75, but ranged from 1.16 to 4.09. Moreover, none of the log-transformed plots of creatinine clearance vs body size measurements produced slopes which approximated 0.75, but ranged from 0.96 to 3.03. These findings suggest that the model describing the relationship between clearance and TBW requires further investigation.
In conclusion, the reason for the relationship between hepatic drug clearance and LBM is still unclear, but does not appear to be due to LBM being a surrogate marker for liver volume. This suggests that there may be multiple correlates of hepatic clearance which include not only liver volume, but hepatic enzyme activity and other physiological parameters associated with the lean tissue compartment. By contrast, the reason for the relationship between creatinine clearance and LBM did appear to be due to LBM acting as a surrogate marker for kidney volume. However, LBM in combination with serum creatinine only marginally improved prediction of creatinine clearance over the widely used Cockcroft and Gault formulae which uses serum creatinine and TBW [25].
Acknowledgments
This study was supported by a grant from the Central Health and Medical Research Council of the Australian Department of Veterans Affairs. The technical assistance of Lily Lau and the other members of the Radiology Department at the Austin and Repatriation Medical Centre is gratefully acknowledged. We also thank Mary D’Astoli for administrative assistance and data management.
References
- 1.Sheiner LB, Beal SL. Evaluation of methods for estimating population pharmacokinetic parameters II. Biexponential model and experimental pharmacokinetic data. J Pharmacokinet Biopharm. 1981;9:635–651. doi: 10.1007/BF01061030. [DOI] [PubMed] [Google Scholar]
- 2.Holford NHG. A size standard for pharmacokinetics. Clin Pharmacokinet. 1996;30:329–332. doi: 10.2165/00003088-199630050-00001. [DOI] [PubMed] [Google Scholar]
- 3.Morgan DJ, Bray KM. Lean body mass as a predictor of drug dosage. Implications for drug therapy. Clin Pharmacokinet. 1994;26:292–307. doi: 10.2165/00003088-199426040-00005. [DOI] [PubMed] [Google Scholar]
- 4.Reilly JJ, Workman P. Normalisation of anti-cancer drug dosage using body weight and surface area: is it worthwhile? Cancer Chemother Pharmacol. 1993;32:411–418. doi: 10.1007/BF00685883. [DOI] [PubMed] [Google Scholar]
- 5.Dawling S, Crome P. Clinical pharmacokinetic considerations in the elderly. Clin Pharmacokinet. 1989;17:236–263. doi: 10.2165/00003088-198917040-00003. [DOI] [PubMed] [Google Scholar]
- 6.Crome P, Flanagan RJ. Pharmacokinetic studies in elderly people are they necessary? Clin Pharmacokinet. 1994;26:243–247. doi: 10.2165/00003088-199426040-00001. [DOI] [PubMed] [Google Scholar]
- 7.Dawson WT. Relations between age and weight and dosage of drugs. Ann Intern Med. 1940;13:1594–1613. [Google Scholar]
- 8.Mahmood I, Balian JD. Interspecies scaling: Predicting pharmacokinetic parameters of antiepileptic drugs in humans from animals with special emphasis on clearance. J Pharm Sci. 1996;4:411–414. doi: 10.1021/js950400y. [DOI] [PubMed] [Google Scholar]
- 9.Turner ST, Reilly SL. Fallacy of indexing renal and systemic hemodynamic measurements for body surface area. Am J Physiol. 1995;268:R978–R988. doi: 10.1152/ajpregu.1995.268.4.R978. [DOI] [PubMed] [Google Scholar]
- 10.Wade J, Kelman A, Kerr D, Robert J, Whiting B. Variability in the pharmacokinetics of epirubicin: a population analysis. Cancer Chemother Pharmacol. 1992;29:391–395. doi: 10.1007/BF00686009. [DOI] [PubMed] [Google Scholar]
- 11.Hallynck T, Soep H, Thomis J, Boelaert J, Daneels R, Dettli L. Should clearance be normalised to body surface or to lean body mass? Br J Clin Pharmacol. 1981;11:523–526. doi: 10.1111/j.1365-2125.1981.tb01163.x. [DOI] [PMC free article] [PubMed] [Google Scholar]
- 12.Roubenoff R, Kehayias J. The meaning and measurement of lean body mass. Nutr Rev. 1991;49:163–175. doi: 10.1111/j.1753-4887.1991.tb03013.x. [DOI] [PubMed] [Google Scholar]
- 13.Moore F. Energy and the maintenance of the body cell mass. J Parenter Enteral Nutr. 1980;4:228–260. doi: 10.1177/014860718000400302. [DOI] [PubMed] [Google Scholar]
- 14.Roberts C, Jackson L, Halliwell M, Branch R. The relationship between liver volume, antipyrine clearance and indocyanine green clearance before and after phenobarbitone administration in man. Br J Clin Pharmacol. 1976;3:907–913. doi: 10.1111/j.1365-2125.1976.tb00646.x. [DOI] [PMC free article] [PubMed] [Google Scholar]
- 15.Pirttiaho H. Liver size in evaluating drug metabolising capacity in man. Int J Clin Pharmacol Biopharm. 1979;17:271–276. [PubMed] [Google Scholar]
- 16.Swift CG, Homeida M, Halliwell M, Roberts CJ. Antipyrine disposition and liver size in the elderly. Eur J Clin Pharmacol. 1978;14:149–152. doi: 10.1007/BF00607447. [DOI] [PubMed] [Google Scholar]
- 17.Bach B, Hanson JM, Kampmann JP, Rasmussen SN, Skovsted L. Disposition of antipyrine and phenytoin correlated with age and liver volume in man. Clin Pharmacokinet. 1981;6:389–396. doi: 10.2165/00003088-198106050-00005. [DOI] [PubMed] [Google Scholar]
- 18.29 Levey AS, Perrone RD, Madias NE. Serum creatinine and renal function. Ann Rev Med. 1988;39:465–490. doi: 10.1146/annurev.me.39.020188.002341. [DOI] [PubMed] [Google Scholar]
- 19.Jermain DM, Crismon ML, Martin ES. Population pharmacokinetics of lithium. Clin Pharm. 1991;10:376–381. [PubMed] [Google Scholar]
- 20.Nawaratne S, Fabiny R, Brien JE, Zalcberg J, Cosolo W, Whan A, Morgan DJ. Accuracy of volume measurement using helical CT. J Comput Assist Tomogr. 1997;21:481–486. doi: 10.1097/00004728-199705000-00027. [DOI] [PubMed] [Google Scholar]
- 21.Formica C, Atkinson M, Nyulasi I, McKay J, Heale W, Seeman E. Body composition following hemodialysis: Studies using dual-energy X-ray absorptiometry and bioelectrical impedance analysis. Osteoporosis Int. 1993;3:192–197. doi: 10.1007/BF01623675. [DOI] [PubMed] [Google Scholar]
- 22.Mazess R, Barden H, Bisek J, Hanson J. Dual-energy x-ray absorptiometry for total-body regional bone-mineral and soft-tissue composition. Am J Clin Nutr. 1990;51:1106–1112. doi: 10.1093/ajcn/51.6.1106. [DOI] [PubMed] [Google Scholar]
- 23.Dubois D, Dubois E. A formula to estimate the approximate surface area if height and weight be known. Arch Intern Med. 1916;17:863–871. [Google Scholar]
- 24.Shargel L, Cheung W, Yu ABC. High pressure liquid chromatographic analysis of antipyrine in small plasma samples. J Pharm Sci. 1979;68:1052–1054. doi: 10.1002/jps.2600680835. [DOI] [PubMed] [Google Scholar]
- 25.Cockcroft DW, Gault MH. Prediction of creatinine clearance from serum creatinine. Nephron. 1976;16:31–41. doi: 10.1159/000180580. [DOI] [PubMed] [Google Scholar]
- 26.Urata K, Kawasaki S, Matsunami H, et al. Calculation of child and adult standard liver volume for liver transplantation. Hepatol. 1995;21:1317–1321. [PubMed] [Google Scholar]
- 27.Fritschy P, Robotti G, Schneekloth G, Vock P. Measurement of liver volume by ultrasound and computed tomography. J Clin Ultrasound. 1983;11:299–303. doi: 10.1002/jcu.1870110602. [DOI] [PubMed] [Google Scholar]
- 28.Sharer JE, Wrighton SA. Identification of the human hepatic cytochromes P450 involved in the in vitro oxidation of antipyrine. Drug Metab Dispos. 1996;24:487–494. [PubMed] [Google Scholar]
- 29.Hallynck T, Soep HH, Thomis J, Boelaert J, Daneels R. Prediction of creatinine clearance from serum creatinine concentration based on lean body mass. Clin Pharmacol Ther. 1981;30:414–421. doi: 10.1038/clpt.1981.181. [DOI] [PubMed] [Google Scholar]


