Abstract
Aims
Erythropoietin, a glycoprotein hormone is produced by the kidney and targeted to erythrocyte precursors. Recombinant human erythropoietin (Epoetin β) has been utilized for therapeutic purposes in renal anaemia or anaemia occurring after auto blood donation or chemotherapy. The administration routes for erythropoietin are normally subcutaneous or intravenous. No population pharmacokinetic analysis, however, has been performed following subcutaneous administration with consideration given for endogenous production.
Methods
In the present study, we have attempted to analyze the pharmacokinetics of erythropoietin after subcutaneous administration in healthy adult male volunteers by using the Nonlinear Mixed Effect Model program (NONMEM) with a model including endogenous erythropoietin production.
Results
It has been established that the final estimation of the population mean values of the absorption rate constant (ka), the elimination rate constant (ke), the distribution volume (V) and the endogenous production are 0.0430 h−1, 0.206 h−1, 3.14 l and 15.7IU h−1, respectively. For the circadian rhythm of endogenous production, the amplitude was calculated as 9.86% and the peak appeared around 24.00 h.
Conclusions
The values for ke and V are very similar to those previously reported for intravenous administration. The circadian rhythm of endogenous production are also able to be substantiated. The factors influencing ke were found to be serum creatinine and age.
Keywords: erythropoietin, epoetin β, subcutaneous administration, population pharmacokinetics, endogenous production, NONMEM
Introduction
Erythropoietin, a 34 000-Dalton glycoprotein hormone, is produced by the kidney and targeted to erythroid progenitors. Recently, recombinant DNA technology has made it possible to use recombinant human erythropoietin (Epoetin β) for therapeutic purposes in renal anemia or anemia occurring after auto blood donation or chemotherapy on neoplasm. Epoetin β is confirmed to be identical with natural human erythropoietin in physicochemical, immunological and biological quality [1, 2].
Erythropoietin is mainly given by intravenous and subcutaneous administration. There is no reported population pharmacokinetic analysis, following subcutaneous administration with consideration given for the endogenous production.
The changes in plasma erythropoietin concentration are known to exhibit a circadian rhythm [3]. The regulation mechanism of erythropoietin production is thought to depend on the partial pressure of oxygen of the blood in the kidney [4], and the blood flow in the kidney has a circadian rhythm in normal individuals [5]. Therefore, the endogenous production of erythropoietin should have a circadian rhythm.
In the present study, we have attempted to analyze the pharmacokinetics of erythropoietin after subcutaneous administration in healthy adult male volunteers by using the Nonlinear Mixed Effect Model program (NONMEM) with a one-compartment open model with first-order absorption, including endogenous erythropoietin production.
Methods
Study protocol and subjects
This study was performed in order to confirm the bioequivalence of two kinds of Epoetin β formulations. The results showing that their pharmacokinetic properties are identical based on the evidence of the moment analysis method, have already been reported [6].
According to the protocol, the subjects were administered 1500IU or 3000IU of Epoetin β subcutaneously in the forearm at 09.00 h, twice at an interval of 2 weeks.
A total of 48 healthy adult male Japanese volunteers were selected after a thorough check of their medical histories and after physical examinations. Admission criteria included normal laboratory parameters, including complete blood count, platelet count, prothrombin time and activated partial thromboplastin generation time, as well as the absence of any evidence of clinically significant cardiovascular, renal, hepatic, metabolic, gastrointestinal, neurologic, or endocrine disorders. Each subject gave his written consent after having been informed of the contents of the study protocol, which had been approved by the Institutional Review Board of the clinical centre Kannondai Clinic (Ibaraki, Japan).
Subjects were divided into two groups, with 16 subjects assigned to the 1500IU and 32 to the 3000IU dose group, respectively.
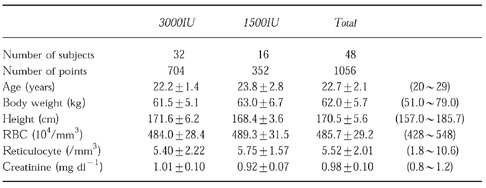
Particulars such as age, height, weight, were not significantly different between the two groups. The background data are shown in Table 1.
Table 1.
Subject characteristics (mean±s.d. (range)).
Sample collections and drug analysis
Venous blood (3 ml) was collected into heparinized tubes 1 h before and at 3, 6, 9, 12, 15, 24, 36, 48, 72, 96 h after each administration. Blood samples were centrifuged for 10 min after collection at room temperature and sera were harvested and stored frozen until analysis.
Plasma erythropoietin was assayed by using the r.i.a. method with an antiserum prepared from rabbit immunized with Epoetin β [7]. Erythropoietin standard and serum sample (100 μl) were incubated for 16 h at room temperature with 100 μl of 50 000 fold diluted antiserum and 200 μl pH 7.4 phosphate buffer saline solution containing 1% BSA and 0.05% Tween 20. This buffer solution was used also as a diluent for all dilution steps. 100 μl (10 000 counts min−1 approximately) of [125I]- Epoetin β was then added to each tube. After 4 h of subsequent incubation at room temperature, 250 μl of Immunobeads solution (Bio-Rad Labs; ISA goat anti-rabbit immunoglobulin) was added, and stood for 1 h at room temperature. The mixture was then centrifuged, with addition of 2 ml of 0.9% NaCl solution, at 3000 rev min−1 for 10 min. The supernatant was aspirated off, and the radioactivity of the precipitate was measured with a γ-counter.
Assessment of precision of the serum erythropoietin r.i.a. was performed and the result were as below [8].
Within-run precision: R.i.a. was run on three human serum samples (25.5 to 127.4IU l−1) 10 times each. The CV ranged from 4.5 to 5.7%.
Between-run precision: R.i.a. was run on three human serum samples (25.5 to 138.2IU l−1) on 5 consecutive days. The CV ranged from 1.9 to 6.7%.
Recovery test: Two human serum samples (11.6 and 44.7IU l−1) to which epoetin β had been added at concentrations of 4 to 128IU l−1 were assayed. The assays showed a recovery from 89.6 to 104.4%.
Test with substitute matrix: The r.i.a. was run at eight concentrations (4.0 to substitute matrix: 512.0IU l−1) nine times each and the CV ranged from 0.9 to 6.7%. The limit of detection (LOD) was 2.1IU l−1 (calculated from the value of (mean—2 s.d.) of the count at 0IU l−1).
Pharmacokinetic and statistical model
The pharmacokinetics of erythropoietin have previously been described using a two-compartment open model in rats [9]. However, the model had been selected for intravenous administration, and the Cmax was much higher than that observed following subcutaneous administration. After preliminary examination, we adopted a one-compartment open model with a first order absorption, including constant endogenous erythropoietin production, to describe the plasma concentration-time profile of erythropoietin. We also assumed that the absorption rate constant ka is smaller than the elimination constant ke, because the half-life period of plasma erythropoietin is about three times longer following subcutaneous administration compared to intravenous administration [10–14]. The model is referred to as being a flip-flop phenomenon.
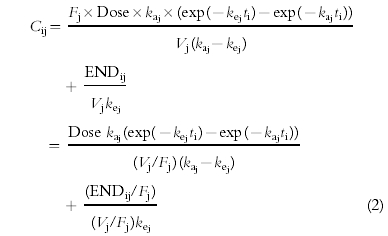
Taking kaj, kej, Vj, Ej and Fj as the absorption rate constant, the elimination rate constant, the distribution volume, the average of endogenous erythropoietin production and bioavailability, respectively, in the j-th individual,
 |
(1) |
 |
(2) |
where ti is the time after 1st administration, Cij and ENDij/Fj are the plasma erythropoietin concentration and the apparent endogenous erythropoietin production in the j-th individual at time ti, t0j and Ampj are the constants describing the phase and amplitude of the circadian rhythm in the j-th individual.
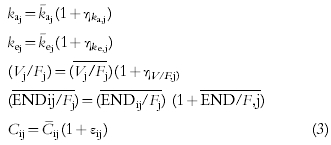
To quantify the inter- and intra-individual variabilities, the nonlinear mixed effect model was constructed for data analysis. The additive error and proportional error models are typical parametric models to describe a distribution of errors. On the basis of a preliminary study's results based on the objective function, we chose the proportional error model for both of the intra-individual and inter-individual error model,
 |
(3) |
where ηka,j, ηke,j, ηV,j and ηEND/F,j are individual random perturbations from the population mean parameters that are independent and normally distributed with mean zero and variances equal to ω2ka, ω2ke, ω2V/F, ω2END/F, respectively. k¯aj, k¯ej,Vj/Fj, and ENDij/Fj represent typical values of the absorption rate constant, elimination rate constant, apparent distribution volume and apparent endogenous erythropoietin production predicted by the regression Equation 4. εij refers to independent identically distributed errors with mean zero and variances σ2 for plasma concentrations. Cij is a measured concentration, and C¯ij is a value calculated by using the individual parameter values.
Data analysis
Computation was carried out using the NONMEM program Version IV Level 1.1 and a NM-TRAN preprocessor with user supplied PRED subroutine on a Hewlett Packard APOLLO 9000 model 710 workstation computer. For the computation of population parameter estimates, the First-Order method (FO) was used.
The likelihood ratio test was used for assessing which covariates were able to influence the pharmacokinetics of erythropoietin in this healthy volunteer population. NONMEM computes the minimum value of the objective function, which is equal to the negative value of twice the log likelihood on the assumption that distributions of random variables are normal [15]. A null hypothesis can be examined by comparing the values of the objective function, between allowing the parameter(s) of interest to be freely estimated and fixing the parameter(s). This difference in the values of the objective function (−2LL) is asymptotically distributed as χ2 with degrees of freedom equal to the number of parameters that were fixed to hypothesized values. A difference of 7.879 in the value of the objective function with one degree of freedom was used as being statistically significant (P<0.005) since multiple regression testing was performed in this analysis.
Assessment of each factor was performed by the backward selection method after the following procedure. All of the suspected factors which might have the correlation to the posterior estimates of pharmacokinetic parameters computed by using the basic model, were added to the description of k¯aj, k¯ej, Vj/Fj, and Ej/Fj as follows,
| (4) |
where Xj is k¯aj, k¯ej, V¯j or Ej, and P1, P2, … are parameters to be estimated and FC1, FC2, … are factors to be tested which are, body weight, height, age and laboratory test items, serum creatinine, albumin etc.
Results
Population pharmacokinetic parameters estimates
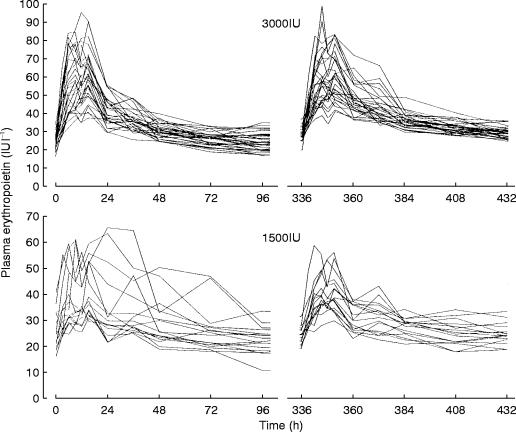
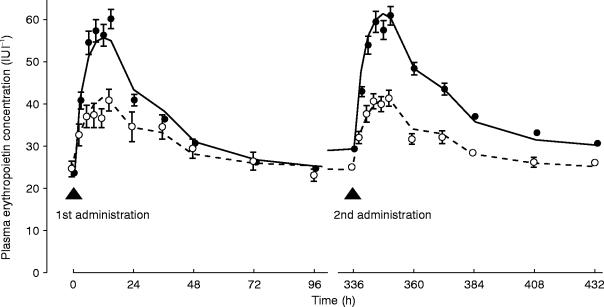
Figure 1 shows the changes in plasma erythropoietin concentration for all volunteers. As shown in Figure 2 and Table 2, plasma erythropoietin concentrations significantly increased in the 3000IU dose group. This suggests that some pharmacokinetic parameters changed during the period between the 1st and the 2nd administration. Concerning the model assumed, the reason why such a change occurred could be (1) that endogenous erythropoietin production increased, (2) that ke decreased or (3) that F or ka changed.
Figure 1.
Change in plasma erythropoietin concentration for each subject.
Figure 2.
Change in plasma erythropoietin concentration and predicted curve for each dosage group (mean±s.e.mean) (○ 1500IU, • 3000IU, – – – predicted curve for 1500IU, — predicted curve for 3000IU).
Table 2.
Change in plasma erythropoietin concentration (IU) between 1st and 2nd administrations (mean±s.e. mean).

To evaluate this assumption, these hypotheses of (1) and (2) were examined on a preliminary basis by using a basic model, including only body weight as a factor in V. As a result, the objective functions were 4902.900 in (1) and 4926.301 in (2). Also, as shown in Figure 2, the hypothesis (1) was more likely, because the shapes of the peaks after the 1st and 2nd administrations were similar. If ke changes between 1st and 2nd administration, the two peak shapes should be different. Hypothesis (3) seems to be unlikely. Even if the pharmacokinetic properties of subcutaneous tissue could be changed by only one administration, the tissue should not be affected over so broad an area, that the 2nd administration might not be performed in the same place.
There was no obvious evidence to prove the hypothesis, however, so that analysis was performed on hypothesis (1). In the following analysis, the average for endogenous erythropoietin production during a whole day for all subjects, is expressed as E1 (average around 1st administration), E2 (average around 2nd administration in 1500IU dose group) and E3 (average around 2nd administration in 3000IU dose group).
First, posterior estimates of the pharmacokinetic parameters ka, ke, Vd and E/F were calculated by using the basic model, including only body weight as a factor in V/F. Then, the correlation between these pharmacokinetic parameters and factors to be tested was examined. Secondly, the factors which were suspected to influence the pharmacokinetic parameters, were included by using Equation 4. These four factors seemed to be correlated with these pharmacokinetic parameters, as shown in Table 3.
Table 3.
Stepwise estimation of model components by the forward selection method.
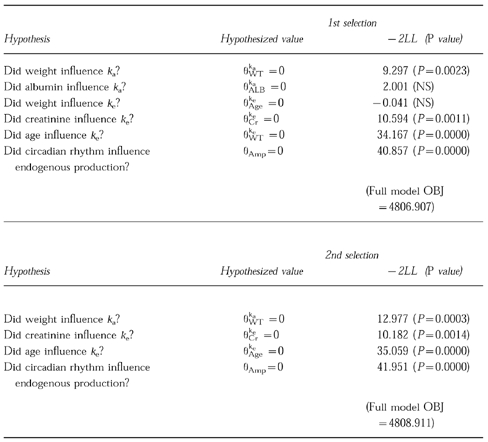
The full model, including these five factors, was tested by the single reduction method, and three meaningful factors selected as the 1st selection result. In the 2nd selection, it was confirmed that all three factors influence the pharmacokinetic parameters significantly.
As a result of the 2nd selection, each parameter was estimated as shown in Table 4. The estimated equation is described below.
Table 4.
Final estimates for population pharmacokinetic parameters of erythropoietin.
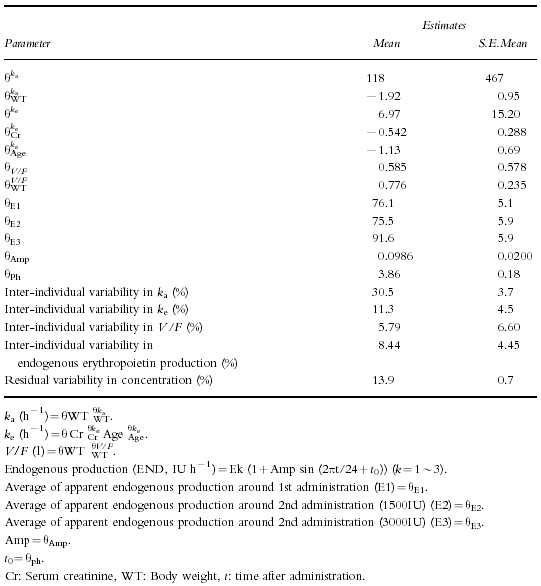
ka=118×weight−1.92(0.0427 h−1)ke=6.97×Creatinine−0.542×Age−1.13(0.207 h−1)V/F=0.585×Weight0.776(14.4 l)(The values in parentheses are calculated using the mean value for the subjects)E1/F=76.1 (average around 1st administration)E2/F=75.5 (average around 2nd administration inE2/F=75.5 1500IU Dose group)E3/F=91.6 (average around 2nd administration in 3000IU Dose group)The apparent endogenous production (END/F) is described as,END/F=EK/F(1+0.0986 sin (2πti/24+3.86)) (K=1∼3)(IU h−1).The equation suggests that the endogenous production peak occurred at 0.15 h and that the amplitude was 9.86%.
There is a good correlation between the predicted concentration curve and the observed concentration values (Figure 2). Figure 2 shows a good curve fit and indicates that the model is suitable for analysis of subcutaneous erythropoietin administration.
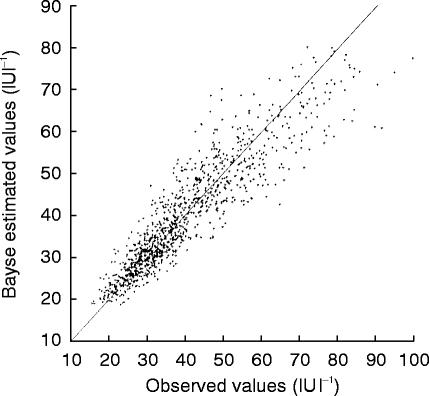
The high correlation between the predicted values and the observed values is shown in Figure 3, and it should prove this model was suitable to demonstrate the pharmacokinetics of erythropoietin after s.c.
Figure 3.
The correlation between predicted values and observed values.
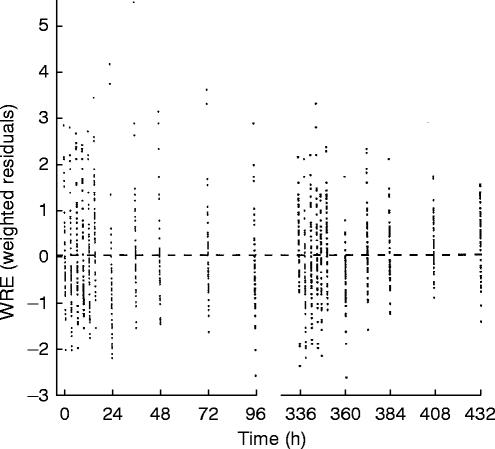
The plot of WRE (weighted residuals) vs time is shown in Figure 4. The distribution of WRE at each time point was relatively symmetric and not distorted, and it did not change largely along the time course.
Figure 4.
The plot of weighted residuals vs time.
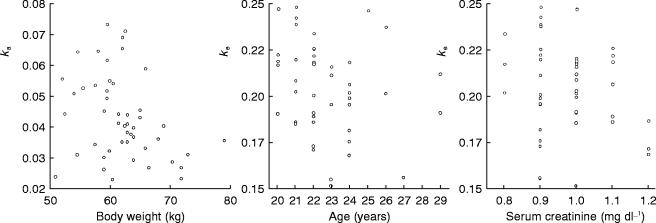
The correlation between Bayes estimated pharmacokinetic parameters and prognostic parameters are shown in Figure 5. The calculation was conducted by using the basic model which did not include body weight, age, creatinine as the covariates.
Figure 5.
The correlation between Bayes estimated pharmacokinetic parameters and prognostic parameters.
For the correlation between body weight and ka, r is −0.326 (P=0.0238). For the correlation between age and ke, r is −0.227 (n=48) for all subjects, but r is −0.403 (P=0.0081) through 20 to 24 years old (n=42).
For the correlation between creatinine and ke, r is −0.210 (P=0.1521). However, the correlation improved to −0.302 (r) and P=0.0370 by using the full model without creatinine as a covariate.
The objective function was 4808.911 for this full model. When the objective function of the same full model was calculated on hypothesis (2), with a decrease in ke, it was 4848.305. This should also suggest that hypothesis (1), assuming a decrease in endogenous erythropoietin production, is more suitable than hypothesis (2) in mathematical terms.
Estimation of the true values of V and endogenous production
By using only the data from this subcutaneous administration study, it is not possible to estimate the pharmacokinetic parameters of the true distribution volume and endogenous erythropoietin production. Thus, we obtained the same data on AUC as those reported elsewhere in the literature [12, 13], on intravenous Epoetin β administration studies.
For the calculation of the s.e. for the true values, the drug should be administered both i.v. and s.c. to same subject. However, the population means of the true values of V and END (V/F and END/F) which were calculated by the mean of F have a considerable accuracy, because of the relatively small inter-individual variability of F.
The results are shown in Table 5. The population mean values of F, V and true endogenous erythropoietin production for the 1st administration period were estimated as 21.9 (%), 3.14 (l) and 15.7 (IU h−1), respectively.
Table 5.
Bayesian estimates for pharmacokinetic parameters adjusted with the AUC value reported in erythropoietin intravenous administration clinical trial (mean±s.e.mean).
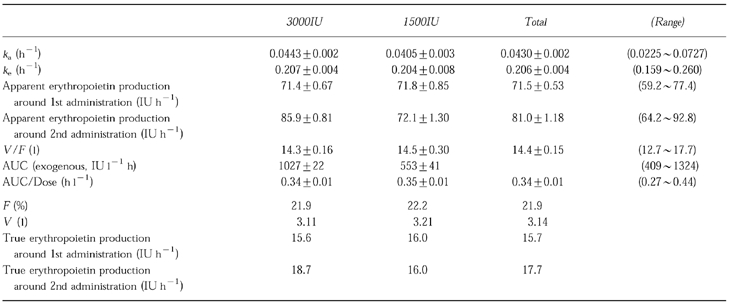
The estimated ka and ke which were also calculated by using the Bayesian estimated values, were 0.0430± 0.002 h−1 and 0.206±0.004 h−1. There were no significant differences in the values of ka, ke and the apparent endogenous production around 1st administration between the two dose groups.
Discussion
Recently, population pharmacokinetic studies have been successfully performed to detect the pharmacokinetic properties of many drugs in the clinical field. However, references to pharmacokinetic analysis of endogenous substances after subcutaneous administration are scarce.
Erythropoietin, which we analyzed in this study, is a glycoprotein hormone mainly produced in the human kidney. Several papers have reported the pharmacokinetics of erythropoietin after intravenous administration on the basis of a two compartment open model in animals. For subcutaneous administration, however, the increase in plasma concentration is nearly double the concentration before administration. We therefore selected a one-compartment open models and it proved suitable.
The changes in plasma erythropoietin concentration are known to exhibit a circadian rhythm [3]. The regulation mechanism of erythropoietin production is thought to depend on the partial pressure of oxygen of the blood in the kidney [4], and the blood flow in the kidney has a circadian rhythm in normal individuals [5]. For this reason, we included its endogenous production in accordance with a circadian rhythm in this model. It was possible to substantiate this and to show that the endogenous production peak appeared at 24.00 h. The time the peak of the plasma concentration of erythropoietin was reported to appear was 20.00 h [3].
We assumed an increase in endogenous production between the 1st and 2nd administrations for the 3000IU dose group. The increase in apparent endogenous production was 76.1±5.1 to 91.6±5.9 (IU h−1, mean±s.e.mean), and it was nearly double the amplitude (9.86%×2, 15.0IU h−1) following a circadian rhythm. Therefore, the change was not so large. On the other hand, if ke decreased, the shapes of the peaks after the 1st and 2nd administrations should be different. Several papers on repeated intravenous erythropoietin administration studies, reported an increase in ke rather than decrease [13, 14]. The objective function is larger when ke is assumed to increase rather than on the assumption of a decrease in endogenous production.
The estimated pharmacokinetic parameters were identical to those reported for intravenous erythropoietin administration studies [12, 13]. In this study, the population means of the elimination rate constant keand the true distribution volume V were estimated as 0.206 h−1 and 3.14 (l), respectively. The values of ke and V calculated from the paper on intravenous Epoetin β administration studies, were 0.192±0.036 h−1 and 4.03±0.47 l (mean±s.e.mean n=16), respectively [12, 13]. These values are very similar to those estimated in our study.
There was no significant difference in the Bayesian estimated values of kaand keand the apparent endogenous production around 1st administration between the 1500IU and 3000IU dose groups. This suggests that the pharmacokinetics of erythropoietin is not dependent on dose and there is no important distortion in this analysis.
This analysis suggests that there is a relationship between the serum creatinine and age influences on ke. Studies on rats [16] suggest that the organs in which erythropoietin is eliminated are the kidney and the bone marrow. Serum creatinine is an indicator of renal function and the results of this study support the view that the kidney contributes to the elimination of erythropoietin in humans. This also agrees with the fact that a prolongation of the plasma erythropoietin half-life period was observed in renal anaemia patients [14, 17].
The estimated influence of age on ke suggests that the clearance of erythropoietin decreases at a rate inversely proportional to age in the range of 20 to 29 years. In view of the following findings, this vigorous decrease would suggest that erythropoietin elimination takes place also in the bone marrow in humans.
A progressive decrease in marrow cellularity in the anterior iliac crest is observed from 80 to 100% to about 50% over the first 30 years of life, with a leveling off at about 50% cellularity up to the age of 65 years [18].
The change in erythropoietin clearance according to age shows a highly significant relationship in this analysis. However, this study's objectives were not to examine this effect of age on clearance and this result should be confirmed from other studies in which there is a wider age range.
The estimated influence of body weight on kasuggests that the absorption rate constant is smaller in individuals with a higher body weight. The reason is not obvious, but it is evident that when subcutaneous tissue mass increases with increased body weight, the transportation of erythropoietin into the blood vessels is bound to be inhibited.
In this model, we assumed that ka is smaller than ke. This assumption was based on the fact that the half-life period of plasma erythropoietin is about three times longer in the case of subcutaneous than in case of intravenous administration [10–14]. The model indicates a flip-flop phenomenon. From the results of our analysis, ka is about one third the value of ke. This means a prolongation by three times the half-life period in the case of subcutaneous as compared with intravenous administration. The hypothesis was also proved by the distribution volume and the factors influencing the pharmacokinetic parameters. Without an assumption of a flip-flop phenomenon, the V should be over 20 l and age and serum creatinine would have an influence on ka. Other protein drugs with a similar half-life, would have the same mechanism.
This study has provided basic evidence on the pharmacokinetics associated with subcutaneous erythropoietin administration, including information on erythropoietin elimination and its circadian rhythm pattern. However, the pharmacokinetic model employed in this report, can be seen as applicable to many kinds of populations of anaemia patients. Once the pharmacokinetics of erythropoietin in patients with renal anaemia, myelodisplastic anaemia or other diseases, has been established, the result would no doubt open the way for more suitable therapeutics. For example, some low- or non-responders to erythropoietin treatment are occasionally observed in renal anaemia patients and this analysis could be helpful in identifying the reason for the absence of the response. This analysis could also be useful in developing a therapy for myelodisplastic anaemia.
References
- 1.Imai N, Kawamura A, Higuchi M, et al. Physicochemical and biological comparison of recombinant human erythropoietin with human urinary erythropoietin. J Biochem. 1990;107:352–359. doi: 10.1093/oxfordjournals.jbchem.a123050. [DOI] [PubMed] [Google Scholar]
- 2.Rency MA, Scoble HA, Kim Y. Structural characterization of natural human urinary and recombinant DNA-derived erythropoietin. Identification of des-arginine 166 erythropoietin. J Biol Chem. 1987;262:17156–17163. [PubMed] [Google Scholar]
- 3.Wide L, Bengtsson C, Birgegard G. Circadian rhythm of erythropoietin in human serum. Br J Haematol. 1989;72:85–90. doi: 10.1111/j.1365-2141.1989.tb07657.x. [DOI] [PubMed] [Google Scholar]
- 4.Erslev AJ. In vitro production of erythropoietin by kidneys perfused with a serum-free solution. Blood. 1974;44:77–85. [PubMed] [Google Scholar]
- 5.Koopman MG, Koomen GC, Krediet RT, de Moor EA, Hoek FJ, Arisz L. Circadian rhythm of glomerular filtration rate in normal individuals. Clin Sci. 1989;77:105–111. doi: 10.1042/cs0770105. [DOI] [PubMed] [Google Scholar]
- 6.Toyoki T, Ohkubo K, Fukusima M. Bioequivalence between two epoetin β formulations for adult healthy volunteers. Jpn Pharmacol Ther. 1994;22:349–361. [Google Scholar]
- 7.Matsubara K, Yoshimura T, Kamachi S, Fukushima M, Hino M, Morii H. Radioimmunoassay for erythropoietin using anti-recombinant erythropoietin antibody with high affinity. Clin Chim Acta. 1989;185:177–184. doi: 10.1016/0009-8981(89)90040-5. [DOI] [PubMed] [Google Scholar]
- 8.Yoshida Y, Tanaka Y, Chichibu K, et al. Evaluation of radioimmunoassay of erythropoietin. J Clin Ther Med. 1990;6:65–72. [Google Scholar]
- 9.Kinoshita H, Ohishi N, Kato M, Tokura S, Okazaki A. Pharmacokinetics and distribution of recombinant erythropoietin in rats. Arzneim-Forsch. 1992;42:174–178. [PubMed] [Google Scholar]
- 10.Tsunoo M, Hirashima K. Epoetin β Phase I clinical study with healthy adult male volunteers—single subcutaneous administration. Jpn Pharmacol Ther. 1993;21:160–170. [Google Scholar]
- 11.Tsunoo M, Hirashima K. Epoetin β Phase I clinical study with healthy adult male volunteers—multiple subcutaneous administration. Jpn Pharmacol Ther. 1993;21:171–183. [Google Scholar]
- 12.Uji Y, Hirashima K, Hirasawa Y, Tohira Y, Mizuno K. Recombinant erythropoietin Phase I clinical study—single intravenous administration. Med Consult N Rem. 1989;26:1–28. [Google Scholar]
- 13.Uji Y, Hirashima K, Hirasawa Y, Tohira Y, Mizuno K. Recombinant erythropoietin Phase I clinical study—multiple intravenous administration. Med Consult N Rem. 1989;26:29–44. [Google Scholar]
- 14.Yamazaki C, Watanabe Y, Sakamoto N. Pharmacokinetic study of recombinant human erythropoietin treatment in pre-dialysis end stage renal disease patients. Jap J Nephrology. 1993;35:1233–1242. [PubMed] [Google Scholar]
- 15.Sheiner LB, Rosenberg B Marathe VV. Estimation of population characteristics of pharmacokinetic parameters from routine clinical data. J Pharmacokinet Biopharm. 1977;5:445–479. doi: 10.1007/BF01061728. [DOI] [PubMed] [Google Scholar]
- 16.Kinoshita H, Ohishi N, Ichikawa F, et al. Pharmacokinetics of recombinant human erythropoietin in rats. In: Marshak D, Liu Darrell, editors. Current Communications in Molecular Biology. New York: Cold Spring Harbor Laboratory; 1989. pp. 123–127. [Google Scholar]
- 17.Jensen JD, Madsen JK, Jensen LW, Pedersen EB. Reduction, absorption, and elimination of erythropoietin in uremia compared with healthy volunteers. J Am Soc Nephrol. 1994;5:177–185. doi: 10.1681/ASN.V52177. [DOI] [PubMed] [Google Scholar]
- 18.Hartsock RJ, Smith EB, Petty CS. Normal variations with aging on the amount of hematopoietic tissue in bone marrow from anterior iliac crest. Am J Clin Pathol. 1965;43:326–331. doi: 10.1093/ajcp/43.4.326. [DOI] [PubMed] [Google Scholar]


