Abstract
Aims
To characterize the pharmacokinetics of recombinant-human follicle stimulating hormone (r-hFSH) and urinary-human follicle stimulating hormone (u-hFSH) using population pharmacokinetic analysis and deconvolution techniques.
Methods
Sparse data were available from 62 female patients who received u-hFSH intramuscularly (i.m.) and 60 female patients who received r-hFSH subcutaneously (s.c.) as part of an in vitro fertilisation and embryo transfer (IVF-ET) procedure. The dose of u-hFSH and r-hFSH was 225 International Units (IU) FSH/day for the first 5 days of treatment. The dose of u-hFSH/r-hFSH on subsequent days depended upon the ovarian response. Intensively sampled data were also available from 12 female volunteers who received r-hFSH, 150 IU, on three occasions: intravenously (i.v.), i.m. and s.c., each separated by 1 week of wash-out. The volunteers then received multiple r-hFSH doses by the s.c. route: 150 IU once daily for 7 days. Intensively sampled data were available from a further 12 female volunteers who received u-hFSH, 150 IU, given by the i.v. and i.m. routes.
Results
Analysis of the intensively sampled r-hFSH and u-hFSH data sets found that disposition could be described using a two-compartment model and that absorption was rate limiting and essentially a first order process, for both compounds. The population estimate of clearance (CL) after i.v. administration was 0.60 and 0.44 l h−1 for r-hFSH and u-hFSH respectively. The calculated mean residence times (MRT) for r-hFSH and u-hFSH were 16 and 18 h, respectively. The different bioavailabilities (F) and mean absorption times (MAT) determined after i.m. and s.c. administration ranged from 0.60 to 0.77 and from 27 h to 48 h, depending on compound, administration route, data type and method of analysis. Population analysis of the sparse patient data found that a one compartment model with first order absorption was adequate to describe the r-hFSH and u-hFSH data. The population estimates of apparent clearance (CL/F) were 0.71 and 0.33 l h−1 for r-hFSH and u- hFSH respectively. Urinary-hFSH CL/F increased linearly with weight and was 0.33 l h−1 at the average weight of 58.5 kg. No other covariates (age, weight, height, creatinine clearance, body mass index, race) were found to influence the FSH disposition parameters. The sparse data population estimates of intersubject variability in CL/F for r-hFSH and u-hFSH were essentially the same, 26% and 25%, respectively.
Conclusions
The population analysis indicates that the variability in CL/F is moderate, consequently, so would be the variability in exposure, given a fixed dosage regimen.
Keywords: follicle stimulating hormone, population pharmacokinetics, deconvolution, women
Introduction
Follicle stimulating hormone (FSH) is one of the key hormones regulating reproductive function in both genders. FSH, a heterodimeric glycoprotein, is produced in the anterior pituitary gland and then secreted into the general circulation. In the female it stimulates growth and maturation of ovarian follicles; in males it promotes spermatogenesis [1]. One indication for human FSH is the stimulation of multiple follicular development in ovulatory patients undertaking in vitro fertilisation and embryo transfer (IVF-ET) [2]. Currently available human FSH preparations are extracted from the urine of postmenopausal women and have low specific activity due to the presence of non-specific co-purified urinary proteins. Biotechnology has made possible production of a high specific activity recombinant human FSH preparation through an in vitro process independent of urine collection (recombinant-human FSH) [3].
The primary objective of the present analysis was to characterize the population pharmacokinetics of intramuscular (i.m.) urinary-human FSH (u-hFSH) and subcutaneous (s.c.) recombinant-human FSH (r-hFSH) in a large group of patients undergoing IVF-ET, and to assess which covariates, if any, influence the variability of FSH pharmacokinetics. The study was a multicentre, randomized, open, parallel group study to compare the efficacy and safety of r-hFSH and u-hFSH. The study was designed with the intention of employing a population approach to the data analysis and thus only sparse numbers of blood samples were taken from each patient during the course of the study.
Administration of an endogenous substance in a pharmacokinetic study gives rise to certain problems that are not normally present with xenobiotic drugs [4]. The resulting plasma concentrations are the result of both endogenous and exogenous parts and these must be distinguished before the pharmacokinetics of the exogenously administered substance can be correctly characterized. The information about many of the model parameters is sparse and therefore the population approach has an advantage over traditional pharmacokinetic methods since it pools the available information across many subjects.
Preliminary analysis of the sparse data indicated that absorption was the rate limiting step for the pharmacokinetics of both u-hFSH and r-hFSH. Since the sampling design in the study did not allow determination of the elimination half-life and volume/bioavailability (V/F), previously collected experimental data of u-hFSH and r-hFSH were made available. Additional information about the absorption and disposition of u-hFSH and r-hFSH was gained by using deconvolution techniques in independent analyses of the intensively sampled data sets. This information was then utilised in the population analysis.
Methods
Study designs and subject demographics
The pharmacokinetics of FSH were characterized using data collected from three separate studies.
Study 1
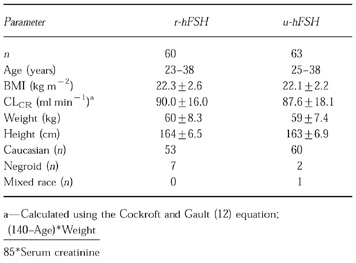
123 patients were randomized to receive either i.m. u-hFSH (n=63) or s.c. r-hFSH (n=60) once daily. Pharmacokinetic data were available from 62 of the 63 u-hFSH patients and all of the r-hFSH patients. All patients were treated with a GnRH-agonist (Buserelin, 200 μg day−1, s.c.) starting at mid-luteal phase of the cycle preceding the FSH treatment and the IVF-ET procedure. Buserelin administration was continued throughout r-hFSH and u-hFSH treatment up to hCG (human chorionic gonadotrophin) administration. FSH treatment was initiated on day 3–5 of the first menstruation following the start of Buserelin treatment. The dose of u-hFSH and r-hFSH was 225 International Units (IU) FSH day−1 for the first 5 days of treatment. The dose of u-hFSH/r-hFSH on subsequent days depended upon the ovarian response assessed by ultrasound of all growing follicles (>10 mm), and serum estradiol levels. The total dose of u-hFSH/r-hFSH could not exceed 6000 IU FSH per patient. The maximum daily dose could not exceed 450 IU FSH day−1. FSH treatment was interrupted and 10 000 IU hCG administered when an appropriate follicular development was recorded [5]. Samples for FSH determination were taken at baseline, days 6, 8, 9 and 10 of FSH treatment and on alternate days thereafter. Single serum samples per patient per day were taken between 11 to 20 h post u-hFSH/r-hFSH administration. The mean±s.d. duration of FSH treatment was 9.9±2.3 days in the r-hFSH group and 9.4±1.8 days in the u-hFSH group. The covariates for consideration in the population analysis were body mass index (BMI; weight in kg divided by squared height in meters)), calculated (Cockroft and Gault) creatinine clearance (CLCR ), age, weight, height, race and centre. The demographic characteristics of the u- and r-hFSH groups are given in Table 1. Nine centres participated in the study. The clinical assessment of the study has already been reported [5].
Table 1.
Demographic characteristics for the individuals in the r-hFSH (given subcutaneously) and u-hFSH (given intramuscularly) groups. Where appropriate values are presented as the mean±s.d. or range.
Study 2
r-hFSH was administered in a balanced, random-order, cross-over sequence as a single dose, 150 IU, on three occasions: intravenously (i.v.), i.m. and s.c., each separated by 1 week of wash-out. The volunteers then received multiple r-hFSH doses by the s.c. route: 150 IU once daily for 7 days. Data were available from 12 pituitary down- regulated healthy female volunteers. Their mean age (±s.d.) was 24±4 years, mean height 167±7 cm and mean weight 63±6 kg. Samples for serum FSH determination were collected at 0 (pre- dose), 5 and 15 min (i.v. route only), 0.5, 1, 2, 4, 6, 9, 12, 24, 36, 48, 72, 96, 120 and 144 h post-dose. Additional samples were collected at the same times after the seventh s.c. dose. The pharmacokinetics of FSH using the data from this study have been previously described using exponential models and noncompartmental methods [6].
Study 3
u-hFSH was administered as a single dose on four occasions, each separated by 1 week of washout. The four treatments were 75 IU, 150 IU and 300 IU given i.v., and, 150 IU given i.m. Data were available from 12 healthy pituitary down-regulated female volunteers. Their mean (±s.d.) age was 22±2 years, mean height was 166±4 cm and mean weight was 61±5 kg. Serum samples for FSH determination were collected at 0 (pre-dose), 5 and 15 min, 0.5, 1, 2, 4, 6, 9, 12, 24, 36, 48, 72, 96, 120 and 144 h post-dose after the i.v. doses, and, 0 (pre-dose), 0.5, 1, 2, 4, 6, 9, 12, 24, 36, 48, 72, 96, 120 and 144 h post-dose after the i.m. dose. Only the data obtained after administration of 150 IU, given by the i.v. and i.m. routes were used in the present analysis.
Chemical analysis
All FSH concentrations were obtained by an immunoradiometric assay (FSH MAIA clone assay, Serono Diagnostics, Welwyn Garden City, UK). The FSH MAIA clone technology incorporates two high affinity monoclonal antibodies into an immunoradiometric assay (IRMA) system to offer a high level of sensitivity and specificity. Samples containing FSH are incubated with a mixture of monoclonal antibodies to FSH. An antibody labelled with 125I attaches quickly to a unique site on the FSH molecule. A second monoclonal antibody linked to fluorescein binds to a discrete site on the FSH molecule forming a sandwich. At the end of incubation, anti-fluorescein coupled to a magnetic solid phase (MAIA) is added in excess. This rapidly and specifically binds to the FSH monoclonal antibody complex and is sedimented in a magnetic field. The concentration of antigen is directly proportional to the radioactivity bound to the separated reagent. By measuring the bound fraction of the FSH sample in a gamma counter calibrated to detect [125I]-iodine, the concentration of FSH in the samples can be determined. The limit of sensitivity was 0.7 IU l−1 and the precision was 8.5% at 6.1 IU l−1 and 3.8% at 31 IU l−1. The interassay coefficient of variation was <5.5%.
Population pharmacokinetic analysis
All data were subject to mixed effects modelling using the software NONMEM [7]. Separate analyses were carried out on each of the following data sets: (i) r-hFSH i.v. rich data, (ii) r-hFSH i.v.+s.c. single dose rich data, (iii) r-hFSH i.v.+i.m. single dose rich data, (iv) r-hFSH i.v.+s.c. multiple dose rich data, (v) r-hFSH s.c. multiple dose sparse data, (vi) u-hFSH i.v. data, (vii) u-hFSH i.v.+i.m. single dose rich data, (viii) u-hFSH i.m. multiple dose sparse data.
One- or two-compartment disposition models with first-order absorption were used to describe the disposition of FSH. In addition, different models for the baseline were tried: a constant baseline, a baseline changing linearly with time, a baseline decreasing exponentially towards zero or towards a new lower level, where the slope of the decline was or was not related to the level of exogenous FSH. For the rich data sets only the first two baseline models were considered.
Inclusion of covariates into the population model was considered only for the sparse data sets. A generalised additive model (GAM) was used to analyse the relationship between covariates and preliminary individual parameter estimates [8]. This procedure will search for significant relationships, based on the Akaike information Criteria, between each of the parameters and the candidate covariates. These models then guided the inclusion of covariates into the population model. The itP level for inclusion of a covariate into the final population model was 0.01. This test was based on the objective function value (OFV) produced by NONMEM which is minus twice the Log Likelihood value. The difference in the OFV between hierarchical models is approximately chi- squared distributed.
The intersubject variabilities for the parameters were described using exponential models. Intersubject variability was included in CL (or CL/F), V (or V/F), absorption rate constant (ka), baseline and baseline change with time. When intersubject variability in F was estimated, the following distribution, which results in individual F values (Fi ) between zero and one was used:
 |
where Fpop is the population median value and η is a zero-mean random variable. The correlation structure which defines which of the parameters, if any, are correlated with which other parameters, was also assessed.
The residual error model for the sparse data sets comprised of both a proportional and an additive component. For the rich data sets, a power model was also tested.
The parameters mean absorption time (MAT) and mean residence time (MRT) can be obtained from the population parameter estimates as:
MAT=l/ka
MRT=1/k (one compartment model only)
MRT=Vss/F/CL/F
Deconvolution
A two compartment model, including a baseline component which was allowed to vary linearly with time, was fitted to each individual's combined i.v. and single dose extravascular r-hFSH data. Absorption was modelled as a flexible input model which consisted of a series of zero-order inputs (steps), each acting as the sole source of input during a specified time period. Due to the flexibility of the input model it was not possible to also estimate a slope in the baseline component for the extravascular dose. Therefore, the baseline slope was set to zero for the extravascular dose. Deconvolution was only performed for the single dose data. The NONMEM program was used also for the deconvolution analyses. To estimate population absorption characteristics the median absorption rate (in % of dose absorbed per hour) vs time data were used. Two subjects were outliers and were excluded from the calculation of the median absorption profile (reason for exclusion given in Results section). MAT and bioavailability (F) were be obtained from the median absorption profile using the area-under-the-curve (AUC) and the area-under-the-first-moment-curve (AUMC) of the absorption rate vs time profile, as MAT=AUMC/AUC and F=AUC, respectively. Thus, MAT can be obtained without making the assumption of first-order absorption. However, if that assumption is reasonable, then the MAT can also be calculated as the reciprocal of ka where ka is the slope of the ln(absorption rate) vs time plot.
Results
r-hFSH
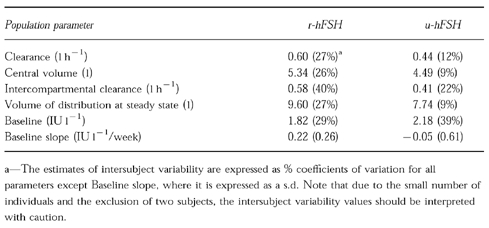
The two compartment model described the i.v. concentration profiles well for all but two subjects. These two subjects displayed large secondary peaks a few hours after i.v. administration and one of them also had a pretreatment FSH level of 10.8 IU l−1, which was considerably higher than for any of the other subjects (range for the other subjects was <0.7 to 2.8 IU l−1 ). The parameter estimates from these two subjects are not included in the calculation of population estimates. Despite a low volume of distribution (Vss=9.6 l) a similarly low CL (0.6 l h−1 ) (Table 2) results in a calculated MRT of 16 h and a terminal half-life of 14 h.
Table 2.
Population pharmacokinetic parameter estimates for the typical individual after i.v. administration of 150 IU of r-hFSH and u-hFSH. The values in parentheses are the estimates of intersubject variability.
Deconvolution analysis of s.c. and i.m. data indicated an essentially first-order absorption (as seen in Figure 1) with MATs of 33 h and 45 h, respectively. Population analysis of the same data resulted in absorption half-lives of 19 and 33 h which give rise to MATs of 27 and 48 h for the s.c. and i.m. data, respectively, and which are similar to the deconvolution MAT values. Also, the values of F obtained from deconvolution and population analyses were similar (Table 3). MAT estimated after multiple doses of r-hFSH s.c. was similar to that obtained after single doses. F was estimated to be 0.66 after single dose administration and 0.75 after multiple dose administration.
Figure l.
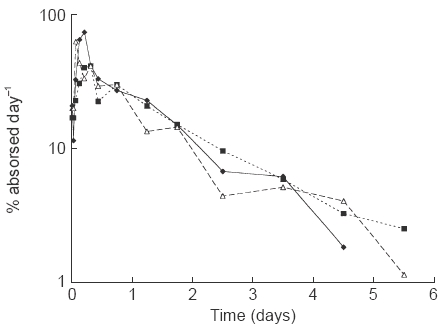
Median absorption profiles, obtained by deconvolution, for r-hFSH given subcutaneously (filled diamonds) and intramuscularly (filled squares), and, u-hFSH given intramuscularly (open triangles). Two subjects are excluded from the median profiles.
Table 3.
MAT, F and CL results for the different data sets and methods of analysis.

In all analyses of rich r-hFSH data, the estimates of MAT were considerably longer than the MRT following an i.v. dose. Therefore, it was decided in the population analysis of the sparse r-hFSH data (where no i.v. reference was available), that the terminal phase represented absorption. Since the protocol did not include samples during the ascending portion of the curve, the sparse data contained very little information about the elimination half-life and could not support a two- compartment disposition model in that no improvement over a one-compartment model could be seen. Therefore, the elimination rate constant in the population analysis was fixed to 0.0629 h−1 (half-life=11 h) in the final population model, a value obtained from the population analysis of the rich i.v. data h (as MRT times ln 2, Table 2 r-hFSH) [9]. The final population parameter estimates for r-hFSH are given in Table 4 and the observed and population model predicted concentrations are shown in Figure 2. The absorption half-life of r-hFSH was calculated to be 32 h, somewhat longer than the value of 19 h, obtained from the population analyses of rich s.c. multiple dose data. Two covariate relationships included in the GAM were also found to be significant when included in the NONMEM model. It was found that the rate of absorption seemed to depend on the BMI such that a female with a low BMI of 16 kg m−2 typically would have an absorption half-life of about 20 h, whereas one with a high BMI of 28 kg m−2 would have an absorption half-life of about 60 h. Also, Baseline was found to depend on CrCL (Table 4). The population estimate for CL/F of 0.71 l h−1 from the sparse data analysis is in good agreement with the estimate of 0.76 l h−1 obtained from the population analysis of rich multiple dose s.c. administration data. The population model prediction of the serum FSH profile after administration of r-hFSH to the typical individual, together with a 67% prediction interval is shown in Figure 3.
Table 4.
Population parameter estimates, with standard errors expressed as % coefficients of variation in parentheses, for the i.m. u-hFSH and s.c. r-hFSH sparse patient data.
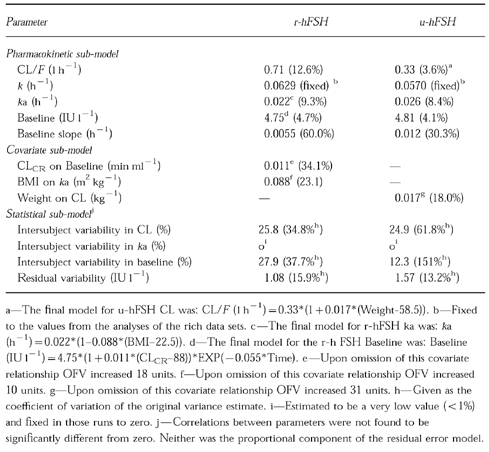
Figure 2.
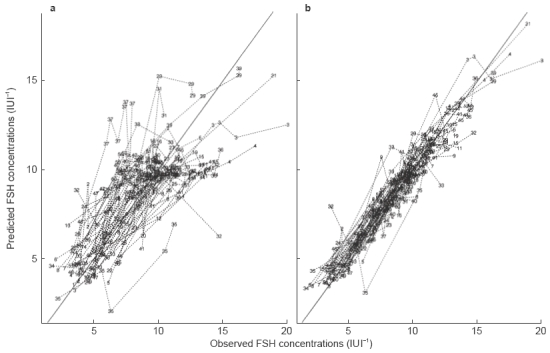
Observed vs model predicted serum FSH concentrations after s.c. administration of r-hFSH. The left hand panel (a) shows the population predicted serum FSH concentrations and the right hand panel (b) shows the individually predicted serum FSH concentrations.
Figure 3.
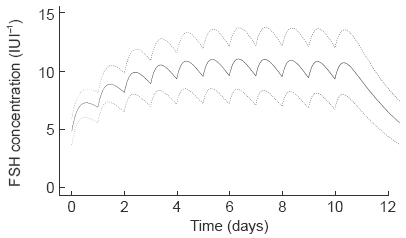
The population model predicted FSH profile after administration of r-hFSH given subcutaneously (225 IU FSH once daily) to the typical individual and associated 67% prediction interval.
The average FSH baseline value differed between the two study populations, with a value of 1.82 in the volunteers and a value of 4.75 IU l−1 in the patients. Also the estimated decline in baseline differed. In the volunteers the estimated (linear) decline over a week following a single dose ranged from 0 to 0.22 IU l−1 depending on route of administration. In the patients the exponential decline in the baseline (which was found to be the best model) had an estimated half-life of 5 days, resulting in a decrease to about 2 IU l−1 over the first week of therapy.
u-hFSH
The u-hFSH concentration profiles after an i.v. dose were also well described by a biexponential decline. The parameters estimated were similar to those of r-hFSH (Table 2), even if CL was slightly lower, 0.44 l h−1, compared with that for r-hFSH, 0.60 l h−1. Deconvolution analysis of i.m. data indicated an essentially first-order absorption (Figure 1) with a MAT of 37 h. Population analysis of the same data and in which a first order absorption process was implemented, resulted in a MAT of 34 h (Table 3). Additionally, similar values of F were obtained from deconvolution and population analyses, 0.64 and 0.60, respectively.
As was the case for the r-hFSH data, higher MAT than MRT estimates from the experimental studies led to the sparse data set being analysed under the assumption of absorption being the rate-limiting step in a model with monoexponential disposition. The elimination rate constant was fixed in the population analysis, due to lack of data on the ascending portion of the curve, to 0.057 h−1 (as l/MRT, Table 2 u-hFSH), a value obtained from the analysis of the rich data after i.v. administration (corresponding to a half-life of 12 h). The population parameter estimates of the final model for the sparse data are presented in Table 4 and the observed and population model predicted concentrations are shown in Figure 4. The absorption half-life for u-hFSH was estimated to be 27 h, and no covariate was found to affect this parameter. A covariate relationship found in the GAM was also significant when included in the NONMEM model in that CL/F increased linearly with weight, with a value of 0.33 l h−1 at the average weight of 58.5 kg.
Figure 4.
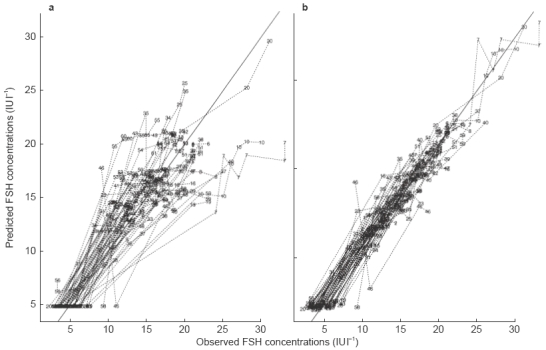
Observed vs model predicted serum FSH concentrations after i.m. administration of u-hFSH. The left hand panel (a) shows the population predicted serum FSH concentrations and the right hand panel (b) shows the individually predicted serum FSH concentrations.
The average baseline FSH level was low in the single dose, intensive data i.v. and i.m. studies, 2.2 and 1.7 IU l−1, with little change over the studied interval, estimated levels after 1 week were 2.1 and 2.2 IU l−1, respectively. For the sparse multiple dose data, the estimated baseline value was 4.8 IU l−1, which decreased (exponentially) to 0.7 IU l−1 after a week.
Discussion
Absorption—rich data sets
The principal objective for the analysis of the rich data sets was to reassess whether the absorption of FSH administered s.c. and i.m. is the rate limiting step or not in the overall fate of the substance. Previous analyses of the data from Study 2, in which both a noncompartmental approach and exponential models were fit to the data, have been reported [6]. The authors concluded that absorption was not the rate limiting step despite that the terminal half life obtained after single dose i.m. and s.c. administration was around double that observed after i.v. administration. The reasons given in support of this conclusion were that the models fit to the data may not be absolutely correct, that the estimated absorption half-life was too short to be confounded with the elimination half life, and, that the baseline component plays a larger role after i.m. and s.c. administration compared to after i.v. administration. That absorption is not rate limiting was also concluded from a study conducted in monkeys and also in which the terminal half-life was longer after single i.m. and s.c. doses of r-hFSH than that obtained after i.v. administration [10]. Again, the reason for not concluding flip flop pharmacokinetics was that the absorption model used may not be the best model to describe the data.
Despite some differences in the parameter estimates, the disposition of FSH as determined in the present analysis generally agrees with what was previously concluded from the same data [6, 11]. However, considerable differences in the estimates of absorption rate exist between this analysis and those carried out previously. The main improvements in the present analysis compared with the previous ones are:
A population analysis, rather than subject-by-subject analysis, has been performed. This allowed better estimation of parameters for which there is relatively little information in each subject. The influence of covariates on pharmacokinetic parameters could thereby be evaluated more efficiently and interindividual variability parameters would not be upwardly biased, as would be expected from a two-stage analysis.
A two-compartment disposition model was used for all analyses.
I.v. and s.c. or i.m. data were analysed simultaneously, allowing the disposition and absorption characteristics to be separated.
Deconvolution was carried out to investigate the rational for approximating the absorption input with a first order process.
It should be stressed that the presence of an appreciable endogenous baseline makes the task of determining absorption and disposition parameters considerably more difficult than for drugs with no endogenous presence. The pretreatment baseline value provides only partial information about the baseline at other times. This is due in part to assay error, but also to changes in baseline over time. This may explain why different methods, that, under other circumstances (no endogenous substance present) may be expected to result in similar parameter estimates, result in appreciable differences in this case. Also, this means that no truly model independent methods exist for estimating CL or F when a baseline is present. Any attempt to estimate these parameters will rely on a model of how baseline will (or will not) vary over the studied interval.
All present analyses of extravascular FSH data strongly indicate that on average the absorption rate is slower than the elimination rate of FSH. The calculated MRTs are 16 h and 18 h for the sparse r-hFSH and u-hFSH data, respectively, whereas the different MATs determined after i.m. and s.c. administration range from 27 h to 48 h, depending on compound, administration route, data type (rich or sparse) and method of analysis. There is good agreement between methods of analysis for the estimation of both MAT and F. Relatively minor differences in absorption rate and bioavailability exist between s.c. and i.m. administration, and, between r- and u-hFSH. However, the fact that these results are from two different groups in two different studies limits the possibility to make inferences.
The absorption profiles as determined by deconvolution were similar for both s.c. and i.m. r-hFSH data and i.m. u-hFSH data. In all three profiles the rate of absorption increases from a low initial value to an early peak (at 1.5–7.5 h). After about 5 to 10 h the decline in the absorption rate is approximately first order. It is during this first order phase that the majority of the available drug is absorbed, hence the relatively close agreement in MAT and F between the model dependent and deconvolution analyses (Table 3).
Baseline
Average baseline FSH levels were estimated to be 4.8 IU l−1 in both the u-hFSH and r-hFSH sparse data patient groups. In the r-hFSH data set, baseline FSH was found to be positively correlated with CLCR. This was true not only for the estimated baseline, but also for the observed baseline values. The reason for this is not clear, but the same relationship was not found for the u-hFSH group suggesting that it may be a spurious finding although in the merged data set (u- and r-hFSH) the relationship was still significant. The CLCR used in the analysis was calculated using the Cockroft and Gault equation and therefore is a function of age and weight. It may also be possible that the relationship between baseline FSH and the calculated CLCR is really a conjugated effect between baseline FSH and age and weight, rather than with renal function per se.
Baseline FSH levels were best described as exponentially declining with time. The reason a separate baseline model could be identified, despite an assay that did not distinguish between exogenous and endogenous FSH, was that, on average, the levels of FSH post-administration declined to values below the FSH value measured immediately before administration of r- and u-hFSH. The rate of decline differed somewhat between r-hFSH and u-hFSH in that the baseline decline was estimated to be faster for the latter. The contribution of two different mechanisms can be evoked for understanding the decline in FSH baseline. The first is a progressive pituitary gonadotroph suppression from the GnRH-agonist administration which continued throughout r-hFSH/u-hFSH treatment phase. The second is the inhibition of pituitary FSH secretion by two ovarian factors resulting from the ovary stimulation by exogenous FSH, i.e., oestradiol (E2) and inhibin [1]. Both factors have a well established inhibitory effect on FSH secretion and were markedly stimulated in both treatment groups. Moreover, E2 and inhibin serum levels were relatively lower in r-hFSH than in u-hFSH treated patients, possibly accounting for the estimated faster suppression in the u- hFSH group. Finally, a suppression of endogenous FSH production by exogenous FSH (e.g., short-loop, or, ultra short-loop feedback) cannot be excluded, but is much less probable.
Disposition
The population mean values for CL/F were estimated with relatively high precision, for both the sparse r-hFSH and u-hFSH data. The CL/F for r-hFSH, 0.71 l h−1, was about twice as high as that for u-hFSH, 0.33 l h−1. These values differ somewhat from what could be expected based on the results of analyses of rich r-hFSH and u-hFSH data. Following i.v. administration CL was estimated to be 0.60 and 0.44 l h−1 for the two products, respectively. Recombinant-hFSH administered s.c. and u-hFSH administered i.m. gave rise to bioavailability values of 75% (multiple dose) and 60% (single dose). Based on these bioavailability values, expected values for CL/F would be 0.80 for r-hFSH and 0.73 l h−1 for u-hFSH. A comparison of the expected values with the values obtained in the present analysis shows that the difference is more pronounced for u-hFSH. The reason for this difference between studies, and likewise the difference between the two products in this study, may be a result of differing CL or differing F. Further, given the uncertainty in the decline in baseline, then if the decline was underestimated in the case of r-hFSH or if it was overestimated in the case of u-hFSH, then this may also contribute to the difference in CL/F for the two compounds.
That somewhat few covariate relationships were found may be due the relative homogeneity of the group of patients studied. For an essentially metabolised compound it is not surprising that few covariate relationship can be detected in a group of essentially healthy, young females. The parameter for which there is most individual information, CL/F, was associated with relatively low intersubject variability, especially when it is considered that it is composite of the variability in both CL and F. The intersubject variabilities in CL/F for r-hFSH and u-hFSH were essentially the same, 26% and 25%, respectively. Lower values for intersubject variability are seldom seen for drugs that are eliminated by metabolic pathways. The population analysis indicates that the variability in CL/F is moderate, consequently, so would be the variability in exposure, given a fixed dosage regimen.
In conclusion, population analysis and deconvolution techniques of rich and sparse data sets have enabled the pharmacokinetics of r-hFSH and u-hFSH to be characterized in subjects undergoing IVF-ET treatment. The analyses demonstrated that absorption is the rate limiting step for both compounds and that none of the covariates tested influenced the disposition of r-hFSH.
Acknowledgments
The authors thank the patients and investigators who participated in these trials, and SCL Bioscience Services Ltd, Cambridge, UK, for performing the FSH assay.
References
- 1.Catt KJ, Dufau ML. Gonadatrophic hormones: Biosynthesis, secretion, receptors and actions. In: Yen SSC, Jaffe RB, editors. Reproductive endocrinology. Philadelphia: WB Saunders Company; 1991. pp. 105–155. [Google Scholar]
- 2.Jones HVV Jr, Jones GS, Andrew MC, et al. The program for in vitro fertilization at Norfolk. Fertil Steril. 1982;38:14–21. [PubMed] [Google Scholar]
- 3.Loumaye E, Campbell R, Salat-Baroux J. Human follicle-stimulating hormone produced by recombinant DNA technology: a review for clinicians. Human Reproductive Update. 1995;1:188–199. doi: 10.1093/humupd/1.2.188. [DOI] [PubMed] [Google Scholar]
- 4.Marzo A, Rescigno A. Pharmacokinetics of endogenous substances: Some problems and solutions. Eur J Drug Met Pharmacokin. 1993;18:77–88. doi: 10.1007/BF03220010. [DOI] [PubMed] [Google Scholar]
- 5.Recombinant Human FSH Study Groups. Clinical assessment of recombinant human follicle-stimulating hormone in stimulating ovarian follicular development before in vitro fertilization. Fertil Steril. 1995;63:77–86. [PubMed] [Google Scholar]
- 6.le Cotonnec JY, Porchet HC, Beltrami V, Khan A, Toon S, Rowland M. Clinical pharmacology of recombinant human follicle-stimulating hormone (FSH). Part II. Single doses and steady-state pharmacokinetics. Fertil Steril. 1994;61:679–686. [PubMed] [Google Scholar]
- 7.Beal SL, Sheiner LB. NONMEM Users Guides. San Francisco: NONMEM Project Group, University of California at San Francisco; 1992. p. 1992. [Google Scholar]
- 8.Mandema JW, Verotta D, Sheiner LB. Building population pharmacokinetic-pharmacodynamic models. I. Models for covariate effects. J Pharmacokin Biopharm. 1992;20:511–528. doi: 10.1007/BF01061469. [DOI] [PubMed] [Google Scholar]
- 9.Benet LZ. The role of pharmacokinetics in the drug development process. In: Jacobi A, et al., editors. Intergration of pharmacokinetics, pharmacodynamics and toxicokinetics in rational drug development. New York: Plenum Press; 1993. pp. 115–123. [Google Scholar]
- 10.Porchet HC, le Cotonnec JY, Canali S, Zanolo G. Pharmacokinetics of recombinant human follicle stimulating hormone after intravenous, intramuscular, and subcutaneous administration in monkeys, and comparison with intravenous administration of urinary follicle stimulating hormone. Drug Metab Dispos. 1993;21:144–150. [PubMed] [Google Scholar]
- 11.le Cotonnec JY, Porchet HC, Beltrami V, Khan A, Toon S, Rowland M. Clinical pharmacology of recombinant human follicle-stimulating hormone (FSH). Part I. Comparative pharmacokinetics with urinary human FSH. Fertil Steril. 1994;61:669–678. [PubMed] [Google Scholar]
- 12.Cockroft DW, Gault MH. Prediction of creatinine clearance from serum creatinine. Nephron. 1976;16:31–41. doi: 10.1159/000180580. [DOI] [PubMed] [Google Scholar]


