

Abstract
Objectives. We examined HIV diagnosis rates and disease progression among men who have sex with men (MSM) according to race/ethnicity and age.
Methods. Using data obtained from the national HIV/AIDS surveillance system, we examined trends in HIV diagnosis rates for 2001 through 2004 using Poisson regression. We used a standardized Kaplan–Meier method to determine differences in time of progression from HIV to AIDS and AIDS survival.
Results. HIV diagnosis rates were higher for Black and Hispanic than for White MSM, but trends within age groups from 2001 to 2004 did not differ by race/ethnicity. Diagnosis rates increased among MSM aged 13 to 19 years (14% per year), 20 to 24 years (13%), 25 to 29 years, and 40 to 54 years (3%–6%; P≤ .01 for each). The percentage of MSM who did not have AIDS 3 years after HIV diagnosis was lower among Black (66.8%; 95% confidence interval [CI]=66.1, 67.4) and Hispanic (68.1%; 95% CI=67.5, 68.8) than among White MSM (74.7%; 95% CI=74.2, 75.1). Three-year survival after AIDS diagnosis was lower for Black than for White or Hispanic MSM.
Conclusions. HIV prevention efforts should target young and middle-aged MSM and must offer early diagnosis and treatment for all MSM.
Highly active antiretroviral therapy (HAART) has been effective in reducing morbidity and mortality from HIV infection. The substantial reductions in the incidence of AIDS and deaths among HIV-infected persons in the United States during the 1990s were in part attributable to the widespread availability of HAART since 1996.1,2 HAART can also reduce transmission of HIV by lowering the viral load in HIV-infected persons,3 which, coupled with HIV prevention behaviors, may explain the reductions in new HIV diagnoses observed in the 1990s. However, since 1999, the downward trend in new HIV and AIDS diagnoses has leveled off, primarily because of increases in the number of HIV diagnoses among men and in particular among men who have sex with men (MSM).4,5
The benefits of HAART in reducing HIV transmission are counteracted if accompanied by increases in high-risk behaviors; even small increases in risky behaviors can counterbalance the benefits of a high proportion of persons receiving treatment.3 Increases in risky sexual behaviors among MSM are suggested by increases in rates of primary and secondary syphilis among men6–8 and by other study reports suggesting increases in risky sexual behaviors among MSM9 and may explain the resurgence of new HIV diagnoses among MSM.
It is generally believed that a large part of the recent increases in HIV diagnoses occurred among MSM who were younger than 30 years old.10–12 However, a 2004 study from the United Kingdom reported that the highest HIV incidence was observed for MSM aged 25 to 44 years.14 Given that the HIV epidemic has disproportionately affected Blacks and Hispanics with HIV diagnoses rates about 10 and 3 times higher than for Whites, respectively,13 of particular concern has been the possibility of increased transmission among young Black and Hispanic MSM. The interaction between age and race/ethnicity has not been investigated for MSM in the United States.
The US Preventive Services Task Force recommends HIV screening of adolescent and adult MSM.15 However, a recent study of convenience samples of MSM in 5 US cities found that nearly half of newly diagnosed HIV-infected MSM (48%) were not aware of having been infected with HIV and that more than one third of all MSM in the study had not had an HIV test within the preceding year.16 Unrecognized HIV infection may lead to diagnosis at a more advanced stage of disease, reducing the ability of HAART to slow disease progression and reduce infectivity.
The high proportion of unrecognized HIV infections among Black (67%) and Hispanic (48%) MSM compared with White MSM (18%) in the 5-city study16 is particularly worrisome. Unrecognized HIV infection, coupled with lower use of and adherence to HAART among persons of color compared with Whites once they know their HIV status,17–20 puts Black and Hispanic MSM at increased risk for poor outcomes such as progression to AIDS or death.
We examined data from the Center for Disease Control and Prevention’s (CDC’s) national HIV/AIDS surveillance system to determine the interaction between race/ethnicity and age. We also examined differences in late HIV diagnosis and progression from HIV to AIDS or AIDS to death among racial/ethnic groups of MSM diagnosed with HIV. This information may be useful in better targeting HIV prevention efforts.
METHODS
In 1994, the CDC implemented a uniform system for national, integrated HIV and AIDS surveillance, and 25 states began submitting data to CDC from confidential, name-based HIV reporting systems. Since 2001, data have been available from 33 states (Alabama, Alaska, Arizona, Arkansas, Colorado, Florida, Idaho, Indiana, Iowa, Kansas, Louisiana, Michigan, Minnesota, Mississippi, Missouri, Nebraska, Nevada, New Jersey, New Mexico, New York, North Carolina, North Dakota, Ohio, Oklahoma, South Carolina, South Dakota, Tennessee, Texas, Utah, Virginia, West Virginia, Wisconsin, and Wyoming) that had been reporting HIV diagnoses at least 6 months before January 2001.21 To assess trends over time, we used data for HIV-infected persons from the 25 states reporting HIV diagnoses for 1994 through 2004 and from the 33 states reporting HIV diagnoses for 2001 through 2004. Persons with HIV were defined as those who had received a diagnosis of HIV (with or without a diagnosis of AIDS at the time of HIV diagnosis). The year of HIV diagnosis was based on the earliest reported date of diagnosis. In our analyses, we included all MSM aged 13 years or older but excluded those who were also injection drug users.
To examine trends in HIV diagnoses, we determined the annual number of HIV diagnoses (with or without a concurrent diagnosis of AIDS) among MSM by race/ethnicity and age. The annual number of HIV diagnoses among MSM was adjusted for reporting delays and redistribution of persons initially reported without sufficient information to be classified into a transmission category.22 We calculated rates to adjust for differences in the racial/ethnic composition of the male populations of each state. Population denominators for the rates were based on bridged-race intercensal estimates for 1994 through 199923 and the bridged-race estimates for 2000 through 200424 obtained from CDC’s National Center for Health Statistics. The bridged estimates are based on the Census 2000 counts and produced under a collaborative agreement with the US Census Bureau. These estimates result from bridging the 31 race categories used in the Census 2000 (1997 standard of the Office of Management and Budget) for the classification of data on race/ethnicity to the categories of the 1977 standard and, therefore, to correspond to the HIV/AIDS data.
To determine trends and to test interactions, we used Poisson regression methods to model the rates of HIV diagnoses (with or without a concurrent diagnosis of AIDS), including year of HIV diagnosis, age, and race/ethnicity in the models. If we define an indicator function I(s) to be equal to 1 when s is true and zero when s is false, then the model (for 2001–2004) can be written as
 |
(1) |
where hiv is the HIV count, popyr,i,j is the number of men in the population of the states for year yr, age i, and race j; yr is the year of HIV diagnosis; agei is a categorical variable for age at HIV diagnosis; racej is a categorical variable; and ɛ is an error term. The categories for age were age 13–19, 20–24, 25–29, 30–34, 35–39, 40–44, 45–49, 50–54, 55–59, 60–65, and 65 years and older. The categories for race were White, Black, and Hispanic. The numbers of Asian/Pacific Islander or American Indian/Alaska Native MSM were too small in some stratifications (e.g., by age) to have their data included. The lack of the “I( )” function on the first term is not an error. The model assumes that the baseline effect is multiplied by itself for each succeeding year.
The strategy for finding a final model was to first enter all the marginal variables (i.e., to fit the above model). Then we refit the model using only the variables significant at the .05 level. Then we added 2-way interaction terms and deleted those that were not significant. The resulting model was
 |
(2) |
To examine patterns in disease progression, we examined the time from HIV diagnosis to AIDS diagnosis among cases diagnosed after 1995, when HAART became widely available. We used information for actual reported cases diagnosed during 1996 through 2002 and followed up through 2004. We determined disease progression by race/ethnicity, age, and year of diagnosis. Cox regression analyses were not appropriate for these data, because the assumption of proportional hazards generally did not hold.25 We therefore used a directly standardized Kaplan–Meier technique to calculate the proportion of MSM with HIV whose disease did not progress to AIDS.26 Estimates were adjusted for all other factors included in our analyses.27 MSM for whom diagnoses of HIV and AIDS were made within the same month were excluded from the analyses. Of a total 44832 MSM with HIV, 838 (1.9%) did not have complete information on date of diagnosis and were excluded from the analyses.
Using data from the 33 states for MSM for whom a diagnosis of AIDS was made during 1996 through 2002, we used a standardized Kaplan–Meier survival method to determine survival by race/ethnicity, age, disease severity, and diagnosis year; cases were followed-up through 2004. Disease severity was measured by CD4+ T-cell count at AIDS diagnosis (first CD4+ T-cell count reported within 6 months of diagnosis; <50, 50–99, 100–199, ≥200 cells/μL [categories used in earlier prognostic models]28; information missing for 14% of cases). Cases with AIDS diagnosis and death within the same month were assigned a follow-up time of 15 days.
RESULTS
Trends in HIV Diagnosis Rates
During 1994 through 1999, the annual number of HIV diagnoses per 100000 men decreased in the 25 states (from 20.9 in 1994 to 14.2 in 1999); since 1999, the rates of diagnosis have increased significantly, by 4.1% to 4.5% per year (to 17.7 per 100000 men in 2004). HIV diagnosis rates were higher in the 33 states reporting data from 2001 through 2004 (23.1 and 24.3 per 100000 population in 2001 and 2004, respectively), but rates did not increase significantly during that time (increases were 1.3% to 1.8% per year). The differences in rates indicated that data from states that implemented HIV reporting after 1994 could not be combined with the data from the 25 states that implemented data reporting in 1994 (i.e., addition of states with higher rates distorts trend).
To determine differences by race and age, we used the most current and complete information (i.e., data shown from the 33 states for 2001–2004). Among all age groups, HIV diagnosis rates were higher for Black and Hispanic MSM than for White MSM (Figure 1 ▶). In 2004, the rate of HIV diagnosis per 100000 for Black MSM (70.8) was about 5 times higher than that for White MSM (14.6); for Hispanic MSM (39.0), it was about 3 times higher than that for White MSM. However, differences in rates varied by age. In 2004, the HIV diagnosis rate for MSM aged 13 through 19 years was about 19 times higher for Black MSM (23.5) than for White MSM (1.2) and about 5 times higher for Hispanic MSM (6.1) than for White MSM. From 2001 to 2004, there were no differences by race/ethnicity in trends within age groups. By age group alone, for MSM aged 13 to 19 years, HIV diagnosis rates increased about 14% per year (P <.01); for those aged 20 to 24 years, they increased about 13% per year (P <.01; Table 1 ▶). HIV diagnoses also increased among MSM aged 25 to 29 years and those aged 40 to 54 years by 3% to 6% per year. Small decreases in HIV diagnosis rates were observed for MSM aged 30 to 39 years.
FIGURE 1—
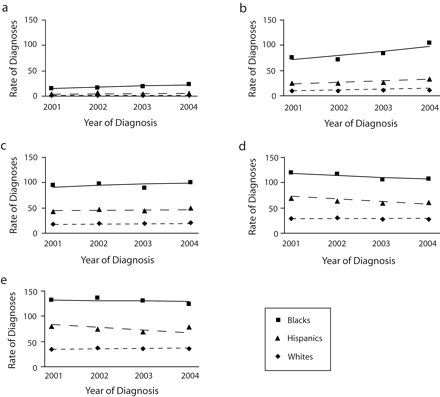
Estimated rates of HIV diagnoses (per 100 000 male population), by race/ethnicity, among men who have sex with men aged (a) 13–19 years, (b) 20–24, (c) 25–29, (d) 30–34, and (e) 35–39: 33 US states, 2001–2004.
Note. Lines are modeled rates; symbols are actual rates. Additional information regarding estimated rates of HIV diagnoses is available as a supplement to the online version of this article.
TABLE 1—
Percentage Change in HIV Diagnosis Rates Among Men Who Have Sex With Men, by Age Group: 33 US States, 2001–2004
| Age Group, y | % Increase per Year | Pa |
| 13–19 | 14.1 | <.01 |
| 20–24 | 13.3 | <.01 |
| 25–29 | 4.6 | <.01 |
| 30–34 | −3.2 | <.01 |
| 35–39 | −2.4 | <.01 |
| 40–44 | 4.8 | <.01 |
| 45–49 | 3.1 | .01 |
| 50–54 | 6.2 | <.01 |
| 55–59 | 3.4 | .06 |
| 60–64 | 3.2 | .24 |
| ≥ 65 | 1.6 | .59 |
aFrom Poisson regression model.
Progression From HIV to AIDS
Of 43 994 MSM with an HIV diagnosis during 1996 through 2002, 15 174 (34.5%) had a diagnosis of AIDS by 2004. HIV was significantly more likely to progress to AIDS within 3 years of HIV diagnosis among Black and Hispanic MSM than among White MSM; that is, AIDS did not develop within 3 years for 66.8% of Black MSM and 68.1% of Hispanic MSM compared with 74.7% of White MSM (Table 2 ▶). AIDS was significantly more likely to develop within 3 years among older MSM than among younger MSM. In later years of diagnosis (2000 or 2001), the proportion of MSM in which HIV did not progress to AIDS was slightly (but significantly) higher than in 1996.
TABLE 2—
Percentage of Men Who Have Sex With Men Who Had an HIV Diagnosis During 1996–2002 in Whom AIDS Had Not Developed as of 2004: 33 US States
| Characteristic | HIV Diagnosis, % | % Without AIDS 1 Year After HIV Diagnosis,a (95% CI) | % Without AIDS 3 Years After HIV Diagnosis,a (95% CI) |
| Race/ethnicityb | |||
| White | 49.8 | 81.6 (81.1, 82.1) | 74.7 (74.2, 75.1) |
| Black | 34.9 | 76.9 (76.3, 77.6) | 66.8 (66.1, 67.4) |
| Hispanic | 14.1 | 76.3 (75.3, 77.4) | 68.1 (67.5, 68.8) |
| Age, y | |||
| 13–19 | 2.7 | 91.4 (90.7, 92.2) | 84.4 (83.7, 85.0) |
| 20–29 | 27.0 | 86.2 (85.5, 86.8) | 78.2 (77.6, 78.8) |
| 30–39 | 42.2 | 78.6 (78.0 79.2) | 70.0 (69.5, 70.6) |
| 40–49 | 20.9 | 73.2 (72.4, 74.1) | 64.8 (64.0, 65.6) |
| 50–59 | 5.6 | 69.4 (68.1, 70.7) | 61.1 (60.2, 62.0) |
| ≥ 60 | 1.6 | 69.4 (68.4, 70.3) | 60.8 (59.6, 62.0) |
| Diagnosis year | |||
| 1996 | 10.1 | 76.1 (74.9, 77.4) | 68.2 (67.4, 69.0) |
| 1997 | 9.7 | 78.3 (77.1, 79.5) | 71.4 (70.2, 72.6) |
| 1998 | 9.1 | 75.8 (74.7, 76.9) | 69.4 (68.3, 70.6) |
| 1999 | 12.1 | 78.1 (77.1, 79.1) | 69.9 (68.8, 71.1) |
| 2000 | 16.4 | 79.1 (78.2, 80.0) | 70.6 (69.6, 71.6) |
| 2001 | 21.1 | 81.0 (80.3, 81.8) | 72.1 (71.2, 72.9) |
| Total | 100.0 | 79.2 (78.9, 79.6) | 70.9 (70.6, 71.2) |
Note. CI = confidence interval.
aAdjusted for all other variables shown in the table.
bAbout 1% of men who have sex with men were of other races; data not shown because of small numbers.
Survival After AIDS Diagnosis
Of 62 045 MSM with a diagnosis of AIDS during 1996 through 2002, 13 962 (22.5%) had died by the end of 2004. Overall, the percentage of MSM with very low CD4+ T-cell counts (<50 cells/μL) at AIDS diagnosis was 28.1% (Table 3 ▶); among White, Black, and Hispanic MSM, it was 24.1%, 34.4%, and 27.8%, respectively (data not shown). Black MSM were significantly less likely to be alive 3 years after AIDS diagnosis (80.6%) than were Hispanic (85.2%) or White (84.5%) MSM. Survival at 1 and 3 years was significantly less likely among older than among younger MSM and among those who had lower CD4+ T-cell counts within 6 months of diagnosis. By contrast to the small improvement in the proportion of persons whose disease did not progress from HIV to AIDS, survival after AIDS diagnosis improved substantially with later years of AIDS diagnosis (e.g., for those whose diagnosis was made in 1996, 78.6% [95% confidence interval (CI) = 78.0, 79.1] had survived after 3 years versus 86.0% [95% CI = 85.6, 86.3] of those whose diagnosis was made in 2001).
TABLE 3—
Percentage of Men Who Have Sex With Men Surviving Who Had an AIDS Diagnosis During 1996–2002, With Follow-Up Through 2004: 33 US States
| Characteristic | AIDS Diagnosis, % | % Surviving 1 Year After AIDS Diagnosis,a (95% CI) | % Surviving 3 Years After AIDS Diagnosis,a (95% CI) |
| Race/ethnicityb | |||
| White | 50.4 | 89.6 (89.3, 89.9) | 84.5 (84.2, 84.8) |
| Black | 32.5 | 88.3 (87.9, 88.6) | 80.6 (80.2, 81.0) |
| Hispanic | 16.2 | 89.7 (89.5, 90.0) | 85.2 (84.9, 85.4) |
| Age, y | |||
| 13–19 | 0.5 | 97.8 (97.2, 98.3) | 86.7 (86.1, 87.4) |
| 20–29 | 14.7 | 92.9 (92.6, 93.2) | 87.7 (87.4, 88.0) |
| 30–39 | 46.8 | 91.2 (90.9, 91.5) | 85.7 (85.5, 86.0) |
| 40–49 | 27.0 | 87.5 (87.1, 87.9) | 81.3 (80.9, 81.7) |
| 50–59 | 8.7 | 81.6 (81.1, 82.2) | 74.3 (73.7, 74.9) |
| ≥ 60 | 2.4 | 70.1 (69.4, 70.8) | 61.4 (60.6, 62.2) |
| Diagnosis year | |||
| 1996 | 21.1 | 86.2 (85.7, 86.7) | 78.6 (78.0, 79.1) |
| 1997 | 16.4 | 89.0 (88.5, 89.4) | 82.5 (81.9, 83.0) |
| 1998 | 13.4 | 88.9 (88.5, 89.4) | 82.6 (82.1, 83.2) |
| 1999 | 12.3 | 89.7 (89.2, 90.2) | 84.3 (83.8, 84.8) |
| 2000 | 12.3 | 90.1 (89.6, 90.6) | 85.1 (84.6, 85.6) |
| 2001 | 12.2 | 91.0 (90.5, 91.4) | 86.0 (85.6, 86.3) |
| CD4+ T-cell count, cells/μLc | |||
| < 50 | 28.1 | 83.0 (82.5, 83.5) | 75.8 (75.3, 76.2) |
| 50–99 | 14.6 | 90.3 (89.9, 90.7) | 83.5 (83.0, 84.0) |
| 100–199 | 33.3 | 94.6 (94.4, 94.9) | 89.4 (89.1, 89.7) |
| 200 | 9.4 | 97.3 (97.1, 97.4) | 93.7 (93.4, 94.0) |
| Unknown | 14.5 | 81.9 (81.4, 82.5) | 76.9 (76.4, 77.4) |
| Total | 100.0 | 89.1 (89.0, 89.3) | 83.3 (83.1, 83.4) |
Note. CI = confidence interval.
aAdjusted for all other variables shown in the table.
bAbout 1% of men who have sex with men were of other races; data not shown because of small numbers.
cWithin 6 months of diagnosis.
DISCUSSION
Our results show that Black and Hispanic MSM were disproportionately affected by HIV. Compared with White MSM, rates of HIV diagnosis for Black and Hispanic MSM were substantially higher, as was the proportion in which AIDS had developed within 3 years. Black MSM were less likely than White MSM to be alive 3 years after AIDS diagnosis. Over the time period of our analysis (2001–2004), rates of HIV diagnosis among MSM in general remained stable in the United States and did not follow the trend of decreasing rates observed among intravenous drug users29 and persons exposed through heterosexual contact.30 Rates increased for young MSM, confirming concerns raised by earlier reports about HIV diagnoses among young men in the United States10,12 and increasing HIV incidence among young MSM in Canada.31 We also found that HIV diagnosis rates increased for MSM aged 40 to 54 years. However, within age groups, the trend in HIV diagnosis rates from 2001 through 2004 did not differ by race/ethnicity.
It is difficult to interpret whether increases in HIV diagnosis rates are attributable to increased detection of HIV infection through increased testing or to increased HIV transmission. The long latency period of HIV infection, which can extend 8 to 10 years, requires implementation of new testing technologies that distinguish between recent and long-term infections to enable better characterization of recent HIV transmission patterns.32 Increased detection may occur through efforts to expand HIV testing services into traditional and nontraditional venues and by integrating testing into routine medical services.33 Stable rates of diagnosis could also be attributable to increased detection concurrent with decreasing transmission rates.
Data from other sources suggest that diagnosis trends may not be a result of increased testing. In the general population, a recent study concluded that the percentage of adults who had ever been tested for HIV did not increase significantly from 2001 (33.2%; 95% CI=32.5, 34.0) through 2004 (34.6%; 95% CI=33.9, 35.3).34 HIV testing rates specifically for MSM were not available from national surveys. Generally, HIV testing rates are lower for persons younger than 25 years and those older than 64 years and highest for persons aged 25 to 44 years.34,35 Even at low testing rates, however, rates of HIV diagnosis for young MSM reflect relatively recent infections, because less time is likely to have passed since the young men’s exposure. Additionally, although HIV diagnoses among middle-aged MSM may include recent as well as longer-term infections, a large proportion of infections in this age group is likely to be recent, given that this age group is more likely to engage in testing and repeat testing.36 Studies in the United States37 and the United Kingdom13 have also found that HIV incidence was highest among men in their 30s and 40s.
Other evidence points to the possibility of continued high transmission rates as well. HIV incidence remained stable among MSM in a few areas in the United States, according to data available for the early years of our study period.38,39 Reports of increasing prevalence of unprotected sexual intercourse, outbreaks of syphilis among MSM in some metropolitan areas, and increases in rates of primary and secondary syphilis also indicate the potential for continued or increased HIV transmission.6–9 Increases in HIV diagnoses among MSM have been observed in Canada40 and Western Europe41 as well. Yet the possibility still exists—because there is insufficient evidence to rule it out—that increased testing contributed to the observed increases in HIV diagnoses.
The goals for the health of the nation set by the Department of Health and Human Services include the elimination of health disparities by race/ethnicity and the prevention of HIV infection and its related illness and death.42 We found not only that rates of HIV diagnoses continue to be higher for Black and Hispanic MSM but also that HIV progressed to AIDS earlier in MSM of color than in White MSM and that chances of survival 3 years after AIDS diagnosis was lower for Black than for White or Hispanic MSM. Poor outcomes (progression to AIDS or death) may be related to late diagnosis in the disease process or lack of adequate access to treatment.
Data showing lower CD4+ T-cell counts at AIDS diagnosis among Black and Hispanic MSM compared with White MSM suggest that HIV diagnoses for Black and Hispanic MSM tend to be made at a later stage of disease. Black and Hispanic MSM are more likely than White MSM to be unaware of being HIV infected,16,43 indicating lower testing rates among Blacks and Hispanics and, therefore, a higher potential for late diagnosis. There is also evidence that people of color have lower rates of treatment utilization and less knowledge about treatment compared with Whites,17–20,44 which may explain the poorer disease outcomes for Black and Hispanic MSM.
Limitations
Our analyses are subject to several limitations. The data from 33 states may not be representative of the whole United States, because these states reported only 63% of all AIDS cases diagnosed during 2001 through 2004. For the first time, data for 2001 through 2004 include New York, and this substantial addition should be considered when making comparisons with previous reports. However, data were not available for some states with high rates of HIV infection, such as California, Maryland, and Pennsylvania. Further, the accuracy of Hispanic classification is unknown. We also did not have sufficient data on Asian/Pacific Islander or American Indian/Alaska Native MSM to present their results. Because HIV testing services are being expanded, increased HIV diagnoses may reflect changes in testing patterns among MSM. Information was not available to determine the influence of treatment on the findings related to disease progression. All analyses were adjusted for reporting delay and risk redistribution of cases reported without a risk factor. These methods may introduce inaccuracies if the historical trends on which these methods are based no longer hold.
Unfortunately, the surveillance data were not of sufficient accuracy to apply our analyses to men who had sex with both men and women. Although the data collection form includes sexual intercourse with men, sexual intercourse with females, and heterosexual relations with HIV-infected persons or persons at high risk for HIV infection, actual data collection may be incomplete if medical-record abstractors do not look beyond the first HIV risk factor that they encounter for an individual. A hierarchy of exposure categories was applied in redistributing cases reported without a risk factor and may have also affected data collection. In the hierarchy, men exposed through sexual intercourse with men were grouped among the MSM category regardless of other risk factors, with the exception of intravenous drug use, for which a separate transmission category existed. In addition, a complete description of high-risk heterosexual contact would require information on the HIV risk factors of sexual partners, as well as whether the sexual partner was HIV infected; this information is often not known or recorded in medical records.
Conclusions
In summary, interventions are needed to stem continued HIV transmission to meet the federal government’s Healthy People 2010 goals of decreases in HIV infections, decreases in AIDS diagnoses among MSM, and decreases in racial/ethnic health disparities. Studies have shown that increasing the proportion of people who know their HIV status can lead to changes in behavior and may lead to decreases in HIV transmission.45 Integrating HIV screening into routine medical care would serve to detect HIV in the large number of MSM who are unaware of their HIV status and to detect HIV infection early for timely intervention to slow disease progression.46 Prevention efforts will require reassessment of ongoing activities to ensure that resources target those at highest risk. In particular, interventions need to be tailored to the needs and behavioral context of Black and Hispanic youth for effective prevention, and to address stigma, distrust, and health literacy to improve access to HIV prevention and care.47,48
Peer Reviewed
Note. The findings and conclusions in this article are those of the authors and do not necessarily represent the views of the Centers for Disease Control and Prevention.
Contributors H.I. Hall originated the study, contributed to study design, analysis, and interpretation, and led the writing. R.H. Byers designed and conducted the data modeling and contributed to the writing. Q. Ling prepared the data for analysis and conducted the disease progression analyses. L. Espinoza contributed to data interpretation and discussion.
Human Participant Protection No protocol approval was needed for this study.
References
- 1.Centers for Disease Control and Prevention. Diagnosis and reporting of HIV and AIDS in states with HIV/AIDS surveillance—United States, 1994–2000. MMWR Morb Mortal Wkly Rep. 2002;51:595–598. [PubMed] [Google Scholar]
- 2.Lee LM, Karon JM, Selik R, Neal JJ, Fleming P. Survival after AIDS diagnosis in adolescents and adults during the treatment era, United States, 1984–1997. JAMA. 2001;285:1308–1315. [DOI] [PubMed] [Google Scholar]
- 3.Blower S, Schwartz EJ, Mills J. Forecasting the future of HIV epidemics: the impact of antiretroviral therapies & imperfect vaccines. AIDS Rev. 2003;5: 113–125. [PubMed] [Google Scholar]
- 4.Centers for Disease Control and Prevention. Increases in HIV diagnoses—29 states, 1999–2002. MMWR Morb Mortal Wkly Rep. 2003;52:1145–1148. [PubMed] [Google Scholar]
- 5.Centers for Disease Control and Prevention. Diagnoses of HIV/AIDS—32 states, 2000–2003. MMWR Morb Mortal Wkly Rep. 2004;54:1106–1110. [Google Scholar]
- 6.Centers for Disease Control and Prevention. Primary and secondary syphilis—United States, 2002. MMWR Morb Mortal Wkly Rep. 2003;52:1117–1120. [PubMed] [Google Scholar]
- 7.Centers for Disease Control and Prevention. Outbreak of syphilis among men who have sex with men—Southern California, 2000. MMWR Morb Mortal Wkly Rep. 2001;50:117–120. [PubMed] [Google Scholar]
- 8.Centers for Disease Control and Prevention. Primary and secondary syphilis among men who have sex with men—New York City, 2001. MMWR Morb Mortal Wkly Rep. 2002;51:853–856. [PubMed] [Google Scholar]
- 9.Chen SY, Gibson S, Katz MH, et al. Continuing increases in sexual risk behavior and sexually transmitted diseases among men who have sex with men: San Francisco, Calif, 1999–2001, USA. Am J Public Health. 2002;92:1387–1388. [PMC free article] [PubMed] [Google Scholar]
- 10.Wolitski RJ, Validserri RO, Denning PH, Levine WC. Are we headed for a resurgence of the HIV epidemic among men who have sex with men? Am J Public Health. 2001;91:883–888. [DOI] [PMC free article] [PubMed] [Google Scholar]
- 11.Centers for Disease Control and Prevention. HIV incidence among young men who have sex with men—seven U.S. cities, 1994–2000. MMWR Morb Mortal Wkly Rep. 2001;50:440–444. [PubMed] [Google Scholar]
- 12.Valleroy LA, MacKellar DA, Karon JM, et al. HIV prevalence and associated risks in young men who have sex with men. JAMA. 2000;284:198–204. [DOI] [PubMed] [Google Scholar]
- 13.Hall HI, Lee LM, Li J, Song R, McKenna MT. Describing the HIV/AIDS epidemic: the addition of HIV case data to AIDS case reporting. Ann Epidemiol. 2005;15:5–12. [DOI] [PubMed] [Google Scholar]
- 14.Murphy G, Charlett A, Jordan LF, Osner N, Gill ON, Parry JV. HIV incidence appears constant in men who have sex with men despite widespread use of effective antiretroviral therapy. AIDS. 2004;18:265–272. [DOI] [PubMed] [Google Scholar]
- 15.US Preventive Services Task Force. Guide to Clinical Preventive Services, Screening for HIV: Recommendation Statement. 2nd ed. Washington, DC: Office of Disease Prevention and Health Promotion; 1996. Available at: http://www.ahrq.gov/clinic/uspstf05/hiv/hivrs.htm. Accessed September 29, 2005.
- 16.Centers for Disease Control and Prevention. HIV prevalence, unrecognized infection, and HIV testing among men who have sex with men—five U.S. cities, June 2004–April 2005. MMWR Morb Mortal Wkly Rep. 2005;54:597–601. [PubMed] [Google Scholar]
- 17.Palacio H, Kahn JG, Richards TA, Morin SF. Effect of race and/or ethnicity on use of antiretrovirals and prophylaxis for opportunistic infection: a review of the literature. Public Health Rep. 2002;117:233–251. [DOI] [PMC free article] [PubMed] [Google Scholar]
- 18.Wutoh AK, Elekwachi O, Clarke-Tasker V, Daftary M, Powell NJ, Campusano G. Assessment and predictors of antiretroviral adherence in older HIV-infected patients. J Acquir Immune Defic Syndr. 2003; 33:S106–S114. [DOI] [PubMed] [Google Scholar]
- 19.Shapiro MF, Morton SC, McCaffrey DF, et al. Variations in the care of HIV-infected adults in the United States. JAMA. 1999;281:2305–2315. [DOI] [PubMed] [Google Scholar]
- 20.Cunningham WE, Andersen RM, Katz MH, et al. The impact of competing subsistence needs and barriers on access to medical care for persons with human immunodeficiency virus receiving care in the United States. Med Care. 1999;37:1270–1281. [DOI] [PubMed] [Google Scholar]
- 21.Institute of Medicine. Measuring What Matters. Allocation, Planning and Quality Assessment for the Ryan White CARE Act. Washington, DC: National Academies Press; 2004. [PubMed]
- 22.Green T. Using surveillance data to monitor trends in the AIDS epidemic. Stat Med. 1998;17: 143–154. [DOI] [PubMed] [Google Scholar]
- 23.Centers for Disease Control and Prevention, National Center for Health Statistics. US Census Populations with Bridged Race Categories. Bridged-race intercensal estimates of the July 1, 1990–July 1, 1999, United States resident population by county, single-year of age, sex, race, and Hispanic origin. Available at: http://www.cdc.gov/nchs/about/major/dvs/popbridge/popbridge.htm. Accessed April 24, 2004.
- 24.Centers for Disease Control and Prevention. US Census Populations with Bridged Race Categories. Bridged-race vintage 2004 postcensal population estimates for July 1, 2000–July 1, 2004, by year, county, single-year of age, bridged-race, Hispanic origin, and sex. Hyattsville, MD: National Center for Health Statistics. Available at: http://www.cdc.gov/nchs/about/major/dvs/popbridge/popbridge.htm. Accessed September 9, 2005.
- 25.Grambsch PM, Therneau TM. Proportional hazards tests and diagnostics based on weighted residuals. Biometrika. 1994;81:515–526. [Google Scholar]
- 26.Amato DA. A generalized Kaplan–Meier estimator for heterogeneous populations. Communications in Statistics: Theory and Methods. 1988;17:263–286. [Google Scholar]
- 27.Hardnett FP, Karon JM, Espinoza L. Evaluating subgroup differences in HIV disease progression as time-to-event data using standardized Kaplan–Meier estimation. Paper presented at: 2005 Joint Statistical Meetings; August 9, 2005; Minneapolis, Minn. Proceedings of the American Statistical Association, Statistics in Epidemiology [CD-ROM]; Alexandria, Va: American Statistical Association; 2005.
- 28.US Department of Health and Human Services. Guidelines for the Use of Antiretroviral Agents in HIV-1–Infected Adults and Adolescents. April 7, 2005. Available at: http://AIDSinfo.nih.gov. Accessed May 10, 2005.
- 29.Rockwell R, Deren S, Goldstein MR, Friedman SR, Des Jarlais DC. Trends in the AIDS epidemic among New York City’s injection drug users: localized or citywide? J Urban Health. 2002;79:136–146. [DOI] [PMC free article] [PubMed] [Google Scholar]
- 30.Centers for Disease Control and Prevention. Trends in HIV/AIDS Diagnoses—33 States, 2001–2004. MMWR Morb Mortal Wkly Rep. 2005;54: 1149–1153. [PubMed] [Google Scholar]
- 31.Joint United Nations Programme on HIV/AIDS. AIDS epidemic update: 2003. Geneva, Switzerland: UNAIDS; 2003. Available at: http://www.unaids.org. Accessed December 10, 2003.
- 32.Rutherford GW, Schwarcz SK, McFarland W. Surveillance for incident HIV infection: new technology and new opportunities. J Acquir Immune Defic Syndr. 2000;25:S115–S119. [DOI] [PubMed] [Google Scholar]
- 33.Centers for Disease Control and Prevention. Advancing HIV prevention: new strategies for a changing epidemic—United States, 2003. MMWR Morb Mortal Wkly Rep. 2003;52:329–332. [PubMed] [Google Scholar]
- 34.National Center for Health Statistics. Early release of selected estimates based on data from the January–March 2005 National Health Interview Survey. Available at: http://www.cdc.gov/nchs/nhis.htm. Accessed November 7, 2005.
- 35.Kellerman SE, Lehman JS, Lansky A, et al. HIV testing within at-risk populations in the United States and reasons for seeking or avoiding HIV testing. J Acquir Immune Defic Syndr. 2002;31:202–210. [DOI] [PubMed] [Google Scholar]
- 36.MacKellar DA, Valleroy LA, Secura GM, et al. Repeat HIV testing, risk behaviors, and HIV seroconversion among young men who have sex with men: a call to monitor and improve the practice of prevention. J Acquire Immune Defic Syndr. 2002;29:76–85. [DOI] [PubMed] [Google Scholar]
- 37.New York City Department of Health and Mental Hygiene. HIV incidence in New York City, 2001: estimates using the serologic testing algorithm for recent HIV seroconversion (STARHS) on specimens testing HIV+ at public laboratories. HIV Surveil Epidemiol Program Q Rep. 2003;1:S1. [Google Scholar]
- 38.Centers for Disease Control and Prevention. Trends in primary and secondary syphilis and HIV infections in men who have sex with men—San Francisco and Los Angeles, California, 1998–2002. MMWR Morb Mortal Wkly Rep. 2004;53:575–578. [PMC free article] [PubMed] [Google Scholar]
- 39.Linley L, Song R, Sharma C, et al. Trends in HIV incidence using serologic testing algorithm, for recent HIV serocon [sic] among persons being served in counseling, testing, and referral settings in 2 high-morbidity southern states, 1996–2002. Presented at: 12th Conference on Retroviruses and Opportunistic Infections; February 22–25, 2005; Boston, Mass. Abstract 965.
- 40.Health Canada. Estimates of HIV prevalence and incidence in Canada, 2002. Can Commun Dis Rep. 2003;29:197–206. [PubMed] [Google Scholar]
- 41.European Centre for the Epidemiological Monitoring of AIDS. HIV/AIDS surveillance in Europe: mid-year report 2003. Saint-Maurice, France: Institut de Veille Sanitaire; 2003. No. 69.
- 42.Healthy People 2010: Understanding and Improving Health. Washington, DC: US Department of Health and Human Services; 2001.
- 43.MacKellar DA, Valleroy LA, Secura GM, et al. Unrecognized HIV infection, risk behaviors, and perceptions of risk among young men who have sex with men. J Acquir Immune Defic Syndr. 2005;38:603–614. [DOI] [PubMed] [Google Scholar]
- 44.Ebrahim SH, Anderson JE, Weidle P, Purcell DW. Race/ethnic disparities in HIV testing and knowledge about treatment for HIV/AIDS: United States, 2001. AIDS Patient Care STDs. 2004;18:27–33. [DOI] [PubMed] [Google Scholar]
- 45.Weinhardt LS, Carey MP, Johnson BT, Bickham NL. Effects of HIV counseling and testing on sexual risk behavior: a meta-analytic review of published research, 1985–1997. Am J Public Health. 1999;89: 1397–1405. [DOI] [PMC free article] [PubMed] [Google Scholar]
- 46.Institute of Medicine. No Time to Lose: Getting More From HIV Prevention. Washington, DC: National Academy Press; 2001. [PubMed]
- 47.Miller KS, Boyer CB, Cotton G. The STD and HIV epidemics in African American youth: reconceptualizing approaches to risk reduction. J Black Psychol. 2004;30:124–137. [Google Scholar]
- 48.Cargill VA, Stone VE, Robinson MR. HIV treatment in African Americans: challenges and opportunities. J Black Psychol. 2004;30:24–39. [Google Scholar]