

Abstract
Aims
We conducted a phase I placebo-controlled trial with two i.v. doses (0.5 mg h−1 and 3 mg h−1) of S 18326, a selective thrombin inhibitor that interacts with the catalytic site of thrombin, with the aim to study the relationships between increasing plasma levels of S 18326 and changes in coagulation tests and thrombin generation markers.
Methods
Thirty-six healthy male volunteers were divided into three groups. In each group, 10 volunteers were randomly assigned to receive S 18326 and two to receive a placebo. Following a bolus of 4.5 mg, doses were 0.5 mg h−1 in the first group and 3 mg h−1 in the two other groups, administered as an i.v. infusion for 24 h. Blood was drawn repeatedly up to 36 h after the bolus, and tested for the activated clotting time (ACT) and activated partial thromboplastin time (APTT). The APTT reagent was chosen among five commercial reagents to yield a linear increase in the clotting time among possible therapeutic S 18326 concentrations in vitro. To accurately measure the thrombin-inhibiting effects of low doses of S 18326 (< 0.5 µm), we developed a specific chromogenic assay. We also measured F1 + 2 prothrombin fragment levels to assess the effect of S 18326 on thrombin generation in vivo.
Results
A two-compartment pharmacokinetic model was fitted to the S 18326 plasma concentration vs time data by using population pharmacokinetic methods. Results of the pharmacodynamic-pharmacokinetic relationships showed that both the ACT and APTT methods yielded a linear increase according to the S 18326 concentration measured using a highly sensitive analytical method. At the end of infusion, ACT was prolonged 1.20 and 1.95-fold in the 0.5 mg h−1 and the 3 mg h−1 groups, respectively, and APTT was prolonged 1.27 and 2.75-fold. Thrombin inhibition plateaued above 0.5 µm of S 18326 according to an Emax model, confirming that the test was highly sensitive. F1 + 2 levels fell significantly after the 24 h S 18326 infusion (0.83 nm to 0.6 nm and 0.80 nm to 0.44 nm in the 0.5 mg h−1 and the 3 mg h−1 groups, respectively), but remained stable after the placebo infusion.
Conclusions
Our results support specific monitoring of the thrombin inhibitor S 18326 with ACT and APTT to establish the safety range of the drug in further studies. Moreover, the fall in F1 + 2 prothrombin fragments suggests that S 18326 effectively reduces the retroactivation of factors V and VIII by thrombin.
Keywords: clotting tests, markers of coagulation activation, pharmacodynamics, pharmacokinetics, thrombin inhibitors
Introduction
Various anticoagulant strategies have been developed to prevent thrombus formation, extension or recurrence. Heparins act indirectly by activating antithrombin, the natural coagulation serine-protease inhibitor, whereas vitamin K antagonists impair the synthesis of several coagulation serine-protease zymogens, namely factors (F) VII, FX, FII and FIX. The coagulation cascade is normally triggered by the availability of tissue factor (TF) at the site of vessel injury. TF association with activated FVII (FVIIa) allows FX to be activated. FXa, in the presence of platelet phospholipids and FV, activates FII to generate thrombin after release of the prothrombin fragment F1 + 2. Thrombin is a multifunctional enzyme that amplifies its own generation by activating FV and FVIII. FVIIIa associates with FIXa (itself activated by TF-FVIIa complexes) on platelet phospholipids, thereby activating FX and generating more thrombin. Anticoagulant therapy leads to a delay in thrombin generation, which can be assessed in vitro by using simple clotting tests such as the activated clotting time (ACT), activated partial thromboplastin time (APTT) and prothrombin time (PT). Laboratory monitoring of anticoagulant treatments is crucial because, at least in the case of unfractionated heparin and vitamin K antagonists, the individual response to a given dose regimen varies widely.
New types of drugs targeting directly thrombin rather than several coagulation serine-proteases activities have been developed in the last decade. Hirudin, a natural anticoagulant now produced as a recombinant protein [1], is a potent and specific thrombin inhibitor. Peptide mimetics of D-Phe-Pro-Arg-CH2Cl (PPACK), that block the thrombin catalytic site have been designed in an attempt to reduce toxicity and to protect the molecule from hydrolysis by intestinal proteases and thereby permit oral administration. Phase I studies of such antithrombotic drugs must include a panel of pharmacodynamic tests to assess the anticoagulant effect, for the following purposes: (i) to ensure safety during the dose-escalation process, (ii) to assess inter/intraindividual variations in the response to a given dose, (iii) to select a surrogate marker of antithrombotic potency for dose-finding studies, and (iv) to select a safety test for phase III trials (thrombin inhibition may carry a bleeding risk in certain individuals). The relationship between thrombin inhibition and the anticoagulant effect is complex, depending on the enzyme inhibition kinetics of the drug, and requires sophisticated analytical methods [2, 3]. Moreover, available coagulation tests have been designed for specific anticoagulant activity and are not necessarily adapted for direct antithrombins. On the other hand, tests for use in larger clinical trials and routine clinical practice must be simple.
We used a strategy based on our experience in routine monitoring of anticoagulant therapy to evaluate biological markers for safety and efficacy assessments during phase I development of a new slow-binding direct thrombin inhibitor, S 18326 [4]. The safety and anticoagulant action of S 18326 were first investigated in 56 healthy volunteers after a 2 h intravenous infusion of doses ranging from 1 to 14 mg (unpublished data).
A second step in the development process has consisted of assessing the longer-term effects of a 24 h infusion. This study design allowed a safer and controlled administration in volunteers to obtain optimal time-concentration profiles in the desired range of safety and with the least variability in the kinetics. The effect of the drug was assessed in healthy volunteers after an intravenous bolus followed by a 24 h infusion using three types of assay: (i) global clotting tests, (ii) a specific test to quantify thrombin inhibition ex vivo, and (iii) an immunoenzymatic assay of F1 + 2 to assess thrombin generation in vivo. The pharmacodynamic data (ACT, APTT and thrombin inhibition) were compared with pharmacokinetic data, based on S 18326 assay in blood by means of high-performance liquid chromatography coupled to mass spectrometry, in order to identify the test giving the most linear and sensitive pharmacokinetic/pharmacodynamic relationship. The modelling of this relationship allows simulation of design for further studies and a more rational choice of doses to progress in the clinical development of thrombin inhibitors.
Methods
Protocol
S 18326 (Ac-D-Phe-N-cyclopentylglycine-boroArg, Mr 524.9) was synthesized by the Institut de Recherches Internationales Servier. The protocol was approved by the relevant Ethics committee. The study was conducted in accordance with the principles stated in the Declaration of Helsinki and all participants gave their written informed consent prior to enrolment. Thirty-six healthy Caucasian male volunteers aged from 18 to 40 years (mean 23.9 ± 4 years) were divided into three groups. In each group, 10 volunteers were randomly assigned to receive S 18326, and two to receive the placebo (0.9% sodium chloride). In total, six subjects received the placebo, while 10 received 0.5 mg h−1 S 18326 and 20 received 3 mg h−1 S 18326, as a 24 h i.v. infusion after a bolus of 4.5 mg. In fact, the highest planned dose (6 mg h−1) was not administered, as a 2.5-fold increase in the APTT was reached with the 3 mg h−1 dose. Thus, the volunteers assigned to receive 6 mg in fact received 3 mg h−1. Blood was collected by direct venepuncture from the forearm not used for the infusion, in tubes anticoagulated with 0.13 m sodium citrate (9vol/1vol), and was centrifuged twice for 15 min at 2300 g at 15 ° C; plasma was stored at −80 ° C until use. The activated clotting time (ACT) was determined on citrated whole blood immediately after collection. Blood samples were obtained prior to (t0) and 10 min, 30 min, and 1, 2, 4, 8, 12, 24, 25.5, 30 and 36 h after the bolus for clotting tests and pharmacokinetic tests, and prior to and 24 and 36 h after the bolus for prothrombin F1 + 2 assay.
Methodology
Clotting tests The activated clotting time (ACT) was measured on a Hemotech automate (ACT II, Medtronic Inc., Minneapolis, MN, USA). The APTT reagent was Automated APTT from Organon Teknika (Durham, NC, USA). During a preliminary in vitro study of human plasma, this reagent was compared with PTTA and CK-Prest (both from Diagnostica Stago, Asnières, France), Silimat (bioMérieux, Marcy l'Etoile, France) and Pathromtin SL (Dade Behring, Marburg, Germany). Normal and pathological controls were from Diagnostica Stago (System control N+P®). Controls containing 0, 0.2 and 1 µm S 18326 (expressed as anhydrous unsalified compound) were prepared in a pool of normal human plasma and stored at −80 ° C until use in each series of assays.
Clotting tests were performed in duplicate on a BCT analyser (Dade Behring). Preliminary APTT assays were performed on an ST4 analyser (Diagnostica Stago).
Anti-IIa chromogenic assay To accurately measure small amounts of S 18326, thrombin inhibition was quantified ex vivo in a chromogenic assay designed to measure residual thrombin activity in the presence of S 18326. Plasma was diluted 1 : 100 in 50 mm Tris pH 7.8 buffer containing 100 mm NaCl, 5 mm EDTA and 0.2% (w/v) polyethylene glycol (Mr 6000) (buffer A). Diluted plasma (50 µl) was mixed with the same volume of human thrombin solution (Diagnostica Stago, 0.5 NIH/ml, 13 nm) and incubated at room temperature for 5 min The reaction was started by adding 100 µl of 0.2 mm S 2238 (Chromogenix-Instrumental Laboratory, Milano, Italy) diluted in buffer A, and absorbance (OD) at 405 nm was recorded for 3 min by a BCT analyser (Dade Behring). Results are given in milli OD405 min−1 and as a percentage of the baseline value, corresponding to the thrombin inhibited during the reaction. Results were also expressed in µm S 18326 by reference to a calibration curve (0–1 µm S 18326) constructed daily with spiked plasma (1 µm S 18326).
Plasma S 18326 determination Plasma S 18326 concentrations were measured using a specific and sensitive high-performance liquid chromatography method coupled to tandem mass spectrometry (LC-MS/MS) detection. The lower limit of quantification was 1 ng ml−1 (2 nm) S 18326 in 0.5 ml of plasma. The upper limit of quantification was 200 ng ml−1 (380 nm). The calibration curve was linear over this concentration range. The method was validated at the Mass Spectrometry Department of Cephac assay centre (St Benoıt, France).
Prothrombin fragments 1 + 2 Prothrombin fragments 1 +2 were measured using the Enzygnost F1 + 2 Micro kit (Dade-Behring). The samples and the kit controls were tested in duplicate according to the manufacturer's instructions. Absorbance was read at 492 nm on a Dynatech MR 5000 microplate reader (Dynatech, Chantilly, VA, USA).
Statistical analysis and pharmacokinetic/pharmacodynamic profiles
Statistical analyses were done with StatView® software on a MacIntosh computer. Intragroup comparisons of F1 + 2-values were made using the Wilcoxon test. Statistical significance was accepted when the P value was below 0.05.
Pharmacokinetic modelling was performed using NONMEM IV software. An open two compartment model parameterized in terms of clearance and volumes was fitted to the plasma concentrations-time data. Pharmacokinetic/pharmacodynamic (PK/PD) modelling was subsequently performed with the individual predicted plasma levels of S 18326 and the different pharmacodynamic endpoints, using NONMEM. Three models (linear, logarithmic and sigmoidal Emax) were tested to describe this relationship.
Results
In vitro study
The APTT response was tested on the ST4 analyser with plasma spiked with a wide range of S 18326 concentrations (0–7.5 µm) using five commercial reagents. As shown in Figure 1, the APTT prolongation was greater with Pathromtin SL than with the other reagents, which gave similar responses. We selected the Automated APTT reagent, which gave a linear increase and the lowest within-assay variability over a wide range of S 18326 concentrations. The chosen reagent was further tested on the BCT automate and yielded a linear APTT prolongation with S 18326 concentrations ranging from 0 to 2 µm; values were close to those obtained with the ST4 analyser. The interassay coefficients of variation (CV) were 2.1% (n = 70), 1.6% (n = 32) and 2.75% (n = 32) for plasma containing 0, 0.2 and 1 µm S 18326, respectively.
Figure 1.
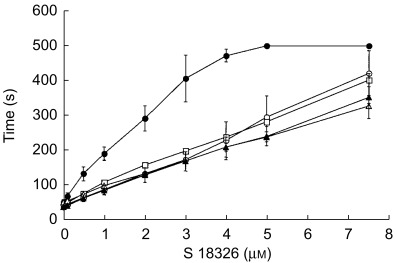
APTT response to plasma spiking with 0–7.5 µm S 18326. The reagents used were: Pathromtin® (•), CK Prest® (○), Silimat® (□), aAPTT® (▴) and PTTA®(▵). Plasma (50 µl) was incubated with 50 µl of the reagent for 3 min at 37 ° C, and the reaction was started by adding 50 µl of 0.025 m calcium chloride (Diagnostica Stago). The clotting time was recorded on a ST4 coagulometer. Mean of three experiments, each performed in duplicate.
To develop a specific chromogenic assay, we first determined the kinetic parameters for thrombin inhibition by S 18326 as described elsewhere [5]; estimates of 268 pm and 4 × 10⁷ m−1 s−1 were obtained for KI and kon, respectively. Knowledge of the kinetic parameters allowed us to predict the half-life of thrombin in the presence of a given concentration of S 18326; in particular it was deduced that equilibrium would be reached within 3 min if a minimum thrombin concentration of 2.5 nm were mixed with S 18326 concentrations above 0.5 nm.
For the assay, the thrombin concentration (13 nm, 0.5 NIH ml−1) was adjusted so that the OD at 405 nm differed by no more than 20% from one test to another. To determine the plasma dilution required to measure anti IIa activity, a pool of normal plasma containing 1 µm S 18326 was diluted 1/25–1/400 (2.5–40 nm). As shown in Figure 2, the amount of thrombin inhibited could be reliably estimated for concentrations ranging from 0–10 nm. As the expected plasma concentrations were within the 0.1–1 µm range, most ex vivo samples were diluted 1 : 100. The intra-assay CV was, respectively, 1.1 and 4.5% for plasma spiked with 0.2 and 1 µm S 18326. The interassay CV was, respectively, 9.5 and 15.2% for plasma spiked with 0.2 and 1 µm S 18326.
Figure 2.
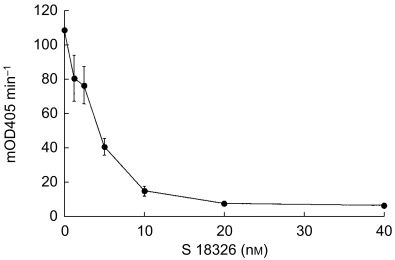
Determination of plasma dilutions required to measure S 18326 thrombin inhibition in a chromogenic assay. A pool of normal plasma containing 1 µm S 18326 was diluted 1 : 25–1 : 400 (40–2.5 nm) and 50 µl of each dilution was incubated with the same volume of 13 nm thrombin solution for 5 min at room temperature. The reaction was started by adding 100 µl of 0.2 mm S 2238 and absorbance (OD) was read at 405 nm for 3 min on a BCT analyser. Results are given as milli ΔOD405 min−1.
Ex vivo study
S 18326 was well tolerated, with no serious adverse events. However, the highest planned dose (6 mg h−1) was not administered, as a mean of 2.5-fold increase in the APTT was reached with the 3 mg h−1 dose. Thus, the volunteers assigned to receive 6 mg in fact received 3 mg h−1.
ACT, APTT and thrombin inhibition were assessed before S 18326 infusion and at various times during and after the infusion (see Methods). S 18326 was also assayed in each sample for pharmacodynamic/pharmacokinetic (PK/PD) studies.
A two-compartment pharmacokinetic model was fitted to the combined S 18326 plasma concentration vs time data by using population pharmacokinetic methods (Figure 3). The timepoints (mean, s.d.) represent observed values whereas the curves represent plasma concentrations predicted by the population model. The correlation between the individual prediction of plasma concentration of S 18326 vs the observed concentrations is shown in the insert in Figure 3. No systematic deviation from the line of identity was observed indicating that the population model adequately describes the data. The mean concentrations of S 18326 observed in each group at 24 h, i.e. just before the end of the infusion, are presented in Table 1. The mean population value of total plasma clearance was 7.59 l h−1, the central compartment volume was 10.1 l, the intercompartmental clearance was 7.43 l h−1, and the peripheral compartment volume was 20.1 l. Clearance of S 18326, which determines the steady-state plasma concentration at each dose level, was constant at the two doses delivered and showed low interindividual variability (estimated CV 27%).
Figure 3.
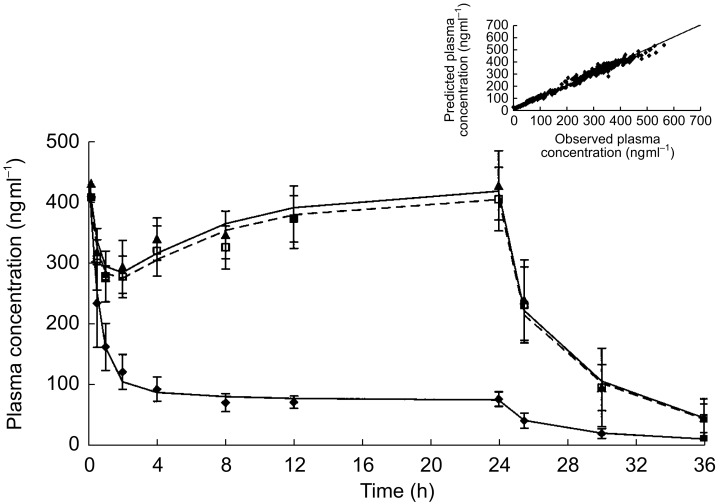
Mean plasma concentration-time profiles. Mean (s.d.) plasma concentration (ng ml−1) of S 18326 after an intravenous bolus of 4.5 mg followed by infusion of the low dose (♦) or the high dose (▴ and □) over 24 h. The lines represent the mean plasma concentration of S 18326 predicted by the population PK model for each dose. The insert presents the plot of individual prediction of plasma concentration (ng ml−1) of S 18326 vs the observed concentrations.
Table 1.
Mean S 18326 plasma concentrations, and ACT, APTT and anti-IIa activities after a 24 h infusion.
| Dose | Subjects | Plasma concentration (ng ml−1) (µm in brackets) | ACT ratio | APTT ratio | Thrombin inhibition (% of baseline) |
|---|---|---|---|---|---|
| 0.5 mg h−1 | 10 | 73.5 ± 12.1 (0.140 ± 0.023) | 1.20 ± 0.03 | 1.27 ± 0.14 | 25.85 ± 7.1 |
| 3 mg h−1 | 20 | 415 ± 64.7 (0.790 ± 0.123) | 1.95 ± 0.41 | 2.75 ± 0.58 | 88.6 ± 1.73 |
| (0.790±0.123) |
As shown in Table 1, ACT and APTT increased dose-dependently after S 18326 infusion but remained in the detection limits of the methods. As a large number of samples were tested ex vivo, we obtained a reliable estimate of the PK/PD relationships. PK modelling was first performed and individual predicted plasma concentrations of S 18326 were obtained by application of the population PK model. PK/PD modelling was then performed with these individual predicted plasma concentrations and the different pharmacodynamic endpoints obtained in the study. As shown in Figure 4, the increase in the ACT ratio could be fitted to a linear model, and the same applied to the APTT ratios over a wide range of S 18326 circulating concentrations (up to 1.2 µm). Thrombin inhibition plateaued above 0.5 µm (Figure 4), confirming that the test was highly sensitive to low circulating concentrations; samples containing higher concentrations should be further diluted (1/200). The percentage of thrombin inhibition in the chromogenic assay is given in Table 1.
Figure 4.
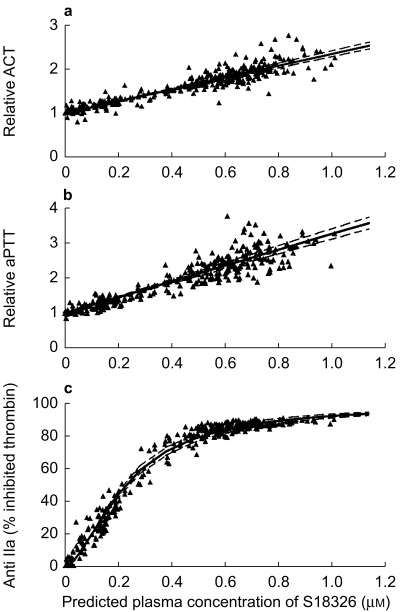
Individual ACT-ratios (a), APTT-ratios (b), and anti IIa activity (c) vs predicted plasma concentrations of S 18326PK/PD analysis was performed after PK modelling, and linear regressions was used to fit ACT and APTT ratios to a function of the S 18326 plasma concentration; an Emax model best described the relationship between anti IIa activity and S 18326 plasma concentrations. 95% confidence limits around the mean predicted relationships of the three biological markers are represented in dotted lines.
Overall, the interindividual variation of the slope of the linear model was small (respectively 15% and 13% for ACT and APTT). The interindividual variation in the EC50 of the Emax model was 11% for the thrombin inhibition test. The residual errors of the tests were lower (9%, 6% and 3.4%, respectively).
The effect of S 18326 infusion on F1 + 2 is shown in Table 2. After a 24 h S 18326 infusion, F1 + 2 significantly fell in both groups, whereas there was no variation in the placebo group. F1 + 2 was also measured 12 h after the end of the infusion; there was a significant trend towards recovery of baseline F1 + 2 levels in the group receiving 3 mg (P < 0.001, Table 2). Overall, these results strongly suggest an effect of S 18326 on thrombin generation when infused for 24 h.
Table 2.
Plasma concentration of F1 +2 (nM) expressed as the median (and range) in the placebo group and in the two groups of patients given 0.5 and 3 mg h−1 S 18326, respectively.
| Subjects | Before infusion (t0) | End of infusion (t24 h) | t36 h | |
|---|---|---|---|---|
| Placebo group | 6 | 0.66 | 0.68 | 0.65 |
| (0.54–0.99) | (0.52–0.88) | (0.49–1.00) | ||
| 0.5 mg h−1 | 10 | 0.83 | 0.60* | 0.62 |
| (0.52–1.15) | (0.41–0.89) | (0.46–2.18) | ||
| 3 mg h−1 | 20 | 0.80 | 0.44** | 0.62** |
| (0.48–1.10) | (0.27–0.79) | (0.36–0.98) |
Wilcoxon test, within-group comparison vs t0:
P < 0.05,
P < 0.01.
Discussion
Most current anticoagulant therapies have suboptimal risk-benefit ratios, mainly because of the wide variability of pharmacokinetic parameters. They also generate complex pharmacodynamic responses that may vary among individuals, especially in patients with an imbalance in clotting factors. Thus, especially with currently available oral anticoagulants, laboratory monitoring is required in clinical practice to reduce the bleeding risk and to ensure efficient anticoagulation.
New thrombin inhibitors currently being developed may represent an alternative to heparins and oral anticoagulants. The purpose of this study was to characterize by using PK/PD modelling the relationships between increasing plasma levels of the direct thrombin inhibitor S 18326 and the degree of anticoagulation, as assessed by ACT and APTT. We also developed a sensitive chromogenic assay to detect very low concentrations of S thinsp;18326.
Thirty-six healthy volunteers were enrolled in a randomized, double-blind, placebo-controlled phase I study of increasing doses of S 18326 administered as a 24 h i.v. infusion. The effect of S 18326 on coagulation was assessed using both global and specific tests. The value of global clotting tests is that they reflect the entire coagulation cascade and, as a result, are suited to routine laboratory monitoring of therapy. In contrast, specific tests are more suitable for monitoring the initial pharmacodynamic action. Among the available global clotting tests, we used the APTT and ACT methods, as the prothrombin time (currently used to monitor vitamin K antagonist therapy) is less sensitive to thrombin inhibitors. APTT is the test most widely used to monitor heparin treatment [6, 7] and many studies have shown that it is suitable for adjusting the dose of unfractionated heparins [8, 9]. Given the known variability among APTT reagents [10, 11], we initially compared five commercial reagents in vitro and chose the reagent yielding a linear increase in clotting time over a wide range of S 18326 concentrations, leading to an increase up to 7-fold the basal APTT (Figure 1).
The results obtained in healthy volunteers showed a linear increase in APTT up to 1 µm S 18326 (Figure 4). It is noteworthy that APTT-concentration relationship for other thrombin inhibitors lacks linearity in the upper range of therapeutic plasma concentrations (hirudin, melagatran) [12, 13], or even has been ascribed to an Emax model (inogatran) [14]. Thus, APTT appears to be an appropriate test for monitoring S 18326 treatment, with a good sensitivity according to the reduced interindividual variation of the slope. However, some individuals might be strong responders to S 18326, as a few APTT-ratio values were above 3, whereas circulating S 18326 concentrations ranged between 0.6 and 0.8 µm as expected (Figure 4). Such interindividual variations are also observed in patients treated with heparin [15], hirudin [16], and melagatran [13]. This is not surprising, as the APTT assay reflects early events regulated by feedback mechanisms in an intrinsically triggered plasma sample before massive thrombin generation. In particular, APTT is sensitive to individual variations in factor VIII levels. Moreover, a significant variability induced by methodological differences in the APTT test has been identified in a recent population modelling when a multicentre study is carried out. This has been compensated for by including the lower limit of the reference range as a covariate in the PK/PD model [14].
We also used ACT, a bedside test done on whole blood, which has been shown to be a good predictor of the antithrombotic activity of direct thrombin inhibitors like hirudin in a model of arterial thrombosis [17] and is routinely used to monitor heparinization during interventional cardiovascular procedures. A linear increase in ACT with the S 18326 concentrations was observed after infusion of 0.5 mg and 3 mg S 18326. The largest ACT prolongation observed in this study was between 2.5 and 3 times baseline. Both linearity slope and interindividual variability are close to those observed for the APTT. These results are in agreement with those of Carteaux et al.[17], who found a 2.7-fold prolongation of the ACT with doses of various anticoagulants, including heparin, that reduced experimental arterial thrombosis by 80%.
Taken together, these results support specific monitoring of new antithrombin drugs with ACT and APTT – both of which are easy to use – to establish safety in the upper range of drug concentrations.
In addition to these global clotting tests, we developed a specific chromogenic assay for S 18326 antithrombin activity. This assay was highly sensitive to S 18326 concentrations lower than 0.5 µm with limited interindividual variability. Thus, it might be useful to monitor the effect of low doses on thrombin inhibition. Moreover, the 1 : 100 plasma dilution step circumvented variations in the concentration of physiological thrombin inhibitors such as plasma antithrombin. In its present form, however, this assay is not suitable for higher concentrations, as more than 80% of added thrombin was inhibited by S 18326 concentrations above 0.5 µm. Further adaptation is needed to obtain a linear curve over therapeutic concentrations.
Finally, to assess the in vivo effect of S 18326 on thrombin generation, we measured F1 + 2 prothrombin fragments, which are believed to reflect the basal level of circulating F Xa [18]. F1 + 2 levels fell after the 24 h drug infusion, whereas they remained stable after the placebo infusion. This suggests that S 18326 reduces the retroactivation of F V and F VIII by thrombin, a phenomenon which greatly enhances prothrombin activation by F Xa. Such a reduction in F1 + 2 circulating levels has also been observed with heparin [19, 20], vitamin K antagonists [21] and other direct thrombin inhibitors like melagatran [13]. This is at variance with the findings of Bounameaux, who reported no variation in F1 + 2 levels when patients with deep venous thrombosis (DVT) were treated with napsagatran [22], another thrombin inhibitor. The discrepancy may be explained by the wide variations in the basal level of F1 + 2 observed in patients with DVT, which renders such a test inappropriate as a biomarker for clinical practice. The respective 30% and 45% falls in F1 + 2 levels observed in healthy subjects treated with 0.5 and 3 mg S 18326 suggest dose-dependent inhibition of thrombin generation.
These results show that dose-and concentration-response relationships during anticoagulant development can be documented by using surrogate biomarkers selected in a pharmacokinetic-pharmacodynamic approach. This can be conducted throughout the development from preclinical exploration of an antithrombotic action in animal models to clinical validation of the benefit/risk ratio in large trials conducted in patients. This first selection of tests during a phase I study provides information on the correlation between plasma concentrations and the degree of hypocoagulation. The next step is to assess this correlation between and within individuals after repeated drug administration and then in patients in larger trials. Such a step-by-step approach can be recommended in drug development for the early evaluation of the therapeutic index of any novel antithrombotic agent.
We gratefully acknowledge Dr D. Chassard, ASTER (Paris, France) who conducted this study. We thank Brigitte Lelièvre for her excellent technical assistance.
References
- 1.Markwardt F. The development of hirudin as an antithrombotic agent. Thromb Res. 1994;74:1–23. doi: 10.1016/0049-3848(94)90032-9. [DOI] [PubMed] [Google Scholar]
- 2.Rupin A, Mennecier Ph, de Nanteuil G, Laubie M, Verbeuren TJ. A screening procedure to evaluate the anticoagulant activity and the kinetic behaviour of direct thrombin inhibitors. Thromb Res. 1995;78:217–225. doi: 10.1016/0049-3848(95)00051-r. [DOI] [PubMed] [Google Scholar]
- 3.Elg M, Gustafsson D, Deinum J. The importance of enzyme inhibition kinetics for the effect of thrombin inhibitors in a rat model of arterial thrombosis. Thromb Haemost. 1997;78:1286–1292. [PubMed] [Google Scholar]
- 4.Rupin A, Mennecier P, Lila C, de Nanteuil G, Verbeuren TJ. Selection of S 18326 as a new potent and selective boronic acid direct thrombin inhibitor. Thromb Haemost. 1997;78:1221–1227. [PubMed] [Google Scholar]
- 5.Stone SR, Le Bonniec BF. Inhibitory mechanism of serpins. Identification of steps involving the active-site serine residue of the protease. J Mol Biol. 1997;265:344–362. doi: 10.1006/jmbi.1996.0727. [DOI] [PubMed] [Google Scholar]
- 6.Van der velde EA, Poller L. The APTT monitoring of heparin-the ISTH/ICSH collaborative study. Thromb Haemost. 1995;73:73–81. [PubMed] [Google Scholar]
- 7.Kitchen S, Preston FE. The therapeutic range for heparin therapy. Relationship between six activated partial thromboplastin time reagents and two heparin assays. Thromb Haemost. 1996;75:734–739. [PubMed] [Google Scholar]
- 8.Holm HA, Abildgaard U, Kalvenes S, et al. The antithrombotic effect of heparin in deep venous thrombosis: relation to four heparin assays. Acta Med Scand. 1984;216:287–293. doi: 10.1111/j.0954-6820.1984.tb03806.x. [DOI] [PubMed] [Google Scholar]
- 9.Hull RD, Raskob GE, Hirsh J, et al. Continuous intravenous heparin compared with intermittent subcutaneous heparin in the initial treatment of proximal-vein thrombosis. N Engl J Med. 1986;315:1109–1114. doi: 10.1056/NEJM198610303151801. [DOI] [PubMed] [Google Scholar]
- 10.D'Angelo A, Seveso MP, D'Angelo SV, Gilardoni F, Dettori AG, Bonini P. Effect of clot-detection methods and reagents on activated partial thromboplastin time (APTT). Implications in heparin monitoring by APTT. Am J Clin Pathol. 1990;94:297–306. doi: 10.1093/ajcp/94.3.297. [DOI] [PubMed] [Google Scholar]
- 11.Kitchen S, Cartwright I, Woods TAL, Jennings I, Preston FE. Lipid composition of seven APTT reagents in relation to heparin sensitivity. Br J Haematol. 1999;106:801–808. doi: 10.1046/j.1365-2141.1999.01596.x. [DOI] [PubMed] [Google Scholar]
- 12.Nurmohamed MT, Berckmans RJ, Morriëns-Salomons WM, et al. Monitoring anticoagulant therapy by activated partial thromboplastin time: Hirudin assessment. Thromb Hemost. 1994;72:685–692. [PubMed] [Google Scholar]
- 13.Eriksson H, Eriksson UG, Frison L, et al. Pharmacokinetics and pharmacodynamics of melagatran, a novel synthetic LMW thrombin inhibitor, in patients with acute DVT. Thromb Haemost. 1999;81:358–363. [PubMed] [Google Scholar]
- 14.DTVENOX Study Group. Markers of hemostatic system activation in acute deep venous thrombosis – Evolution during the first days of heparin treatment. Thromb Haemost. 1993;70:909–914. [PubMed] [Google Scholar]
- 15.Cullberg M, Eriksson UG, Larsson M, Karlsson MO. Population modelling of the effect of inogatran, a thrombin inhibitor, on ex vivo coagulation time (APTT) in healthy subjects and patients with coronary artery disease. Br J Clin Pharmacol. 2001;51:71–79. doi: 10.1046/j.0306-5251.2001.01326.x. DOI: 10.1046/j.1365-2125.2001.01326.x. [DOI] [PMC free article] [PubMed] [Google Scholar]
- 16.Verstraete M, Nurmohamed MT, Kienast J, et al. On behalf of the European Hirudin Thrombosis Group. Biologic effects of recombinant hirudin (CGP 39393) in human volunteers. J Am Coll Cardiol. 1993;22:1080–1088. doi: 10.1016/0735-1097(93)90419-2. [DOI] [PubMed] [Google Scholar]
- 17.Carteaux JP, Gast A, Tschopp TB, Roux S. Activated clotting time as an appropriate test to compare heparin and direct thrombin inhibitors such as hirudin or Ro 46–6240 in experimental arterial thrombosis. Circulation. 1995;91:1568–1574. doi: 10.1161/01.cir.91.5.1568. [DOI] [PubMed] [Google Scholar]
- 18.Bauer KA, Rosenberg RD. The pathophysiology of the prethrombotic state in humans: insights gained from studies using markers of hemostatic system activation. Blood. 1987;70:343–350. [PubMed] [Google Scholar]
- 19.Dempfle CE, Kontny F, Abildgaard U. Predictive value of coagulation markers concerning clinical outcome 90 days after anterior myocardial infarction. Thromb Haemost. 1999;81:701–704. [PubMed] [Google Scholar]
- 20.Woltz M, Eder M, Weltermann A, Entlicher J, Eicher HG, Kyrle PA. Comparison of the effects of different low molecular weight heparins on the hemostatic system activation in vivo in man. Thromb Haemost. 1997;78:876–879. [PubMed] [Google Scholar]
- 21.Tripodi A, Cattaneo M, Molteni A, Cesana BM, Mannucci PM. Changes of prothrombin fragment 1+2 as a function of increasing intensity of oral anticoagulation. Thromb Hamost. 1998;79:571–573. [PubMed] [Google Scholar]
- 22.Bounameaux H, Ehringer H, Gast A, et al. On behalf of the ADVENT investigators. Differential inhibition of thrombin activity and thrombin generation by a synthetic direct thrombin inhibitor (Napsagatran, Ro 46–6240) and unfractioned heparin in patients with deep vein thrombosis. Thromb Haemost. 1999;81:498–501. [PubMed] [Google Scholar]