

Abstract
Aims
Mitogen-induced ex vivo whole blood lymphocyte proliferation (WBLP) is a widely used method to assess lymphocyte responsiveness to immunosuppressive therapy. A three-component complex model was developed to characterize effects of prednisolone on cell trafficking, transduction, and lymphocyte suppression.
Methods
An oral dose (0.27 mg kg−1) of prednisone was given to 32 subjects. The study consisted of baseline and prednisone phases each with 32 h of sampling. Measurements included plasma prednisolone concentrations, in vitro and ex vivo WBLP, and lymphocyte cell counts during baseline and prednisone phases.
Results
The final model consists of a precursor-dependent indirect response model with a first-order periodic influx rate for lymphocyte trafficking. This accounts for the rebound phenomenon and the circadian rhythm seen in all individual ex vivo WBLP effect-time profiles. Prednisolone was modelled as inhibiting lymphocyte influx from the precursor to the blood pools. The direct suppressive effect of prednisolone on WBLP was modelled with the simple Imax model. A transduction step with rate constant kt was introduced to the simple Imax model to account for the delay (∼4 h) in reaching the maximum inhibition. The IC50 values obtained ex vivo were circa 10 times lower than in vitro values (3.76 vs 38.8 ng ml−1), suggesting additional in vivo factors may have enhanced lymphocyte response to the inhibitory effect of prednisolone.
Conclusions
This integrated PK/PD model enables evaluation of multicomponent direct and indirect inhibition of ex vivo WBLP by steroids and other immunosuppressants in relation to sex and race.
Keywords: cell trafficking, gender, indirect response models, pharmacodynamics, race
Introduction
Immunosuppressive compounds decrease cell-mediated reactivity by blocking rate-limiting steps in the immune response produced by T-lymphocytes upon recognition of foreign or altered materials [1]. Thus, mitogen-induced lymphocyte proliferative responses are determined clinically for assessment of functional capacity and cellular immune reactivity of individuals as well as their sensitivity to immunosuppressive therapy. Interpretation of ex vivo whole blood lymphocyte proliferation (WBLP) results is complicated by the fact that the measured response reflects the number of T-lymphocytes present in the sample as well as their capability to respond to an immunologic challenge, both of which are affected by immunosuppressive therapy [2].
To characterize the time-course of ex vivo WBLP, we analysed baseline and treatment data from 32 healthy volunteers who received a single total body weight (TBW)-based oral dose of prednisone. Measurements in the study included: total and unbound prednisolone concentrations, in vivo peripheral blood lymphocyte cell counts during baseline and treatment phases, in vitro WBLP baseline inhibition curves (prednisolone added to normal whole blood), and ex vivo WBLP during the treatment phase (inhibition resulting from in vivo exposure to prednisolone). Our first aim was to develop an integrated pharmacokinetic/pharmacodynamic (PK/PD) model to characterize this multicomponent direct and indirect inhibition of WBLP by prednisolone, the active moiety of prednisone. Our second aim was to assess the lymphocyte sensitivity to the inhibitory effects of prednisolone during these various study conditions in relation to sex and race.
Methods
Subjects
Four groups (WM, white males; BM, black males; WF, white females; and BF, black females) of eight subjects per group, for a total of 32 subjects, gave written informed consent to participate in the study according to the Declaration of Helsinki. The study was approved by the Kaleida Health Millard Fillmore Hospital Institutional Review Board (Buffalo, New York, USA). All 32 subjects were within 20% of ideal body weight, between 18 and 45 years of age, and had normal sleep-wake cycles (night shift workers were excluded). All subjects were determined healthy by assessment of medical history, physical examination, blood chemistry, and haematological profile. None of the subjects had a documented allergy to corticosteroids and none was receiving any concurrent medications known to alter prednisone or prednisolone metabolism. All subjects were descendents of same race parents. All 16 women were premenopausal as defined by the presence of monthly menstruation and absence of menopausal symptoms of the climacteric. None of the women was utilizing any oral or parental hormonal contraceptives and all were determined not pregnant by a urine human chorionic gonadotropin pregnancy test at the beginning of both baseline and prednisone phases. The study attempted to evaluate all women during the luteal phase of their menstrual cycles during which estradiol and progesterone concentrations in the blood are relatively elevated and constant. This was imposed during both baseline and prednisone phases and was accomplished by a calendar method along with a urine ovulation testing method. The women were counseled to use the Answer One-Step Ovulation Predictor Kit (Carter Products, Division of Carter Wallace, Inc., New York, NY), a monoclonal antibody test that detects a luteinizing hormone (LH) surge in the urine. Each subject tested urine daily, beginning 3–5 days prior to the predicted day of ovulation (determined by calendar method), until the test stick became positive noted by a distinct double line indicating the LH surge. This was predictive of ovulation to occur within the next 24–36 h. Approximately 2 days after ovulation, the luteal phase of the menstrual cycle (duration of 12–14 days) follows until onset of menstrual bleeding.
Procedures
Each subject was confined in the Clinical Research Center during both the baseline phase (32 h, no drug) and the prednisone phase (32 h) of the study to control for identical eating and sleeping times. Each study phase began at 08.00 h and was separated by a 2 week period for men and an approximately 4 week period for women. Subjects were required to fast from 22.00 h the evening before and for 2 h after receiving the prednisone dose. On each study day, an 18-gauge angiocatheter was inserted into an arm vein to facilitate blood sample collections. The device was kept patent with the frequent use of a dilute heparin (10 units ml−1) solution.
During the baseline phase, T-lymphocyte cell counts were obtained in the absence of prednisone. Blood samples (3 ml) were drawn into EDTA-containing tubes at 0, 1, 2, 4, 6, 8, 12, 18, 24, and 32 h for the determination of T-lymphocyte cell counts.
During the prednisone phase, each subject received a single total body weight (TBW) based prednisone dose (given as Deltasone, Pharmacia-Upjohn Co., Kalamazoo, MI) orally to provide a similar initial blood concentrations of prednisolone in each subject and to ensure detectable responses. Oral prednisone was used as this is the most common form and route of dosing and intravenous prednisolone no longer appears to be available in the US. Dosing adjustment to TBW rather than to ideal body weight (IBW) was chosen because of the strong correlation of unbound prednisolone clearance with the degree of obesity [3]. The dosing scheme was as follows: 40–49 kg: 12.5 mg; 50–59 kg: 15 mg; 60–69 kg: 17.5 mg; 70–79 kg: 20 mg; 80–89 kg: 22.5 mg of prednisone. Blood samples (3 ml) were drawn into EDTA-containing tubes at 0, 1, 2, 4, 6, 8, 12, 18, 24, and 32 h for the determination of T-lymphocyte cell counts. In addition, 1.5 ml blood samples were drawn into heparin-containing collection tubes at the same time points for the determination of WBLP.
Bioanalysis
Plasma prednisolone concentrations
Plasma prednisolone concentrations were determined using the normal phase h.p.l.c. procedure of Rose & Jusko [4] as updated by Jusko et al.[5]. The lower limit of quantification was 5 ng ml−1 for prednisolone. Samples below the limit of quantification were not used for data analysis. Intra- and inter-day coefficients of variation were less than 7.5%. Unbound prednisolone was measured by ultrafiltration using [3]H-prednisolone and Amicon Centrifree Devices.
T-lymphocyte cell count
Total lymphocyte cell count was obtained using an automated haemocytometer (CELL-DYN 1700, Abbott Laboratories, Abbott Park, IL).
In vitro whole blood lymphocyte proliferation
The in vitro whole blood lymphocyte proliferation method published by Ferron & Jusko [6] was applied. In brief, blood from volunteers at time zero at baseline was collected in evacuated heparinized glass tubes and kept at room temperature for use within 6 h. The blood was diluted 1 : 20 (v/v) with human complete medium (RPMI 1640 supplemented with 2 mm l-glutamine, 20 mm HEPES, 100 U ml−1 penicillin, 100 µg ml−1 streptomycin, 0.25 mm 2-mercaptoethanol). Diluted blood (165 µl) was plated in 96-well flat bottom plates after addition of 20 µl of prednisolone producing well concentrations ranging from 0.8 to 800 ng ml−1. Proliferation was induced by phytohematoagglutenin (PHA) at a final well concentration of 3 µg ml−1. All samples were plated in quadruplicate in a total volume of 200 µl per well. After incubation for 72 h at 37° C in a 7.5% CO2-humidified air incubator, cultures were pulsed with 1 µCi of [3H]thymidine per well (New England Nuclear, Boston MA) and incubated for an additional 20 h. Cells were then harvested onto microplates (Packard Instrument Company, Meriden CT), washed with 3% hydrogen peroxide and dried. Cellularly incorporated [3]H was assessed by radiometry by counting in liquid scintillation fluid (Microscint-20, Packard) in a Top Count Microplate Scintillation Counter (Packard).
Ex vivo whole blood lymphocyte proliferation
Blood from prednisolone-dosed volunteers were collected at serial time points and was kept at room temperature for use within 6 h of collection. The remaining steps were identical to the in vitro method described above, except the use of 20 µl of pulsing prednisolone was replaced by same volume of medium.
Pharmacokinetics
The pharmacokinetics of prednisolone were described by equations for a one- or two-compartment model with or without a time-lag (tlag) for the first-order absorption and conversion from prednisone. The pharmacokinetics of total and unbound prednisolone concentrations (Cp) were chosen based upon the best fitting of the following equations:
| (1) |
| (2) |
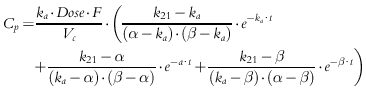 |
(3) |
in which
| (4a,b) |
Parameters obtained from this analysis include ka (first-order absorption rate constant), tlag (lag time in absorption), Vc/F (apparent volume of the central compartment), CL/F (apparent systemic clearance), and k12 and k21 (first-order distribution rate constants between the central and peripheral compartments). The best fitting PK function for each subject was used as a forcing function for the subsequent pharmacodynamic analysis.
WinNonlin Pro2.1 (Pharsight Corp., Apex, NC) was used for pharmacokinetic modelling of total and unbound prednisolone concentration data, with 1/y weighting used to obtain parameter estimates.
Pharmacodynamics
T-lymphocyte cell counts
Under normal physiologic conditions, lymphocytes equilibrate between the blood pool and extravascular compartment (such as lymph nodes, spleen, and bone marrow). T-lymphocyte trafficking has been shown to exhibit a circadian rhythm [7]. The suppression of T-lymphocyte influx into blood appears to be the primary mechanism [8, 9] for the observed lymphocytopenic effect of prednisolone. In this study, after administration of prednisone, T lymphocyte cell counts decreased in relation to inhibition of the lymphocyte trafficking between the peripheral lymphoid tissues and the central blood compartment by the active metabolite, prednisolone. This results in accumulation of lymphocytes in the peripheral lymphoid tissues. As prednisolone concentrations decline in blood, lymphocyte buildup in the peripheral compartment is dumped into blood compartment, resulting in the rebound phase observed in T-lymphocyte cell counts in most subjects.
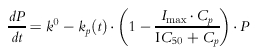
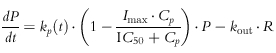
The rate of change of the T-lymphocyte cell counts in the precursor (P, extravascular pool) and in the central blood pool (R) over time was characterized as indirect and described as:
 |
(5) |
 |
(6) |
where Cp is the estimated unbound plasma prednisolone concentration, IC50 is the unbound plasma prednisolone concentration inhibiting kp(t) by 50%, Imax is the extent of inhibition which was fixed at 0.8 on the basis of previous observations [10], k0 is defined as the apparent zero-order rate constant for production of precursor, while kout represents the first-order rate constant for loss of response. The kp(t) is a time-dependent periodic influx rate of lymphocytes into blood:
| (7) |
where km is the mean input rate of lymphocytes into blood, kb is the amplitude of rate, tp is the time of occurrence for the peak input, and 2π/24 converts clock time into radians.
Baseline and treatment T-lymphocyte cell counts were fitted simultaneously with the model equations by the maximum likelihood method using the ADAPT II [11] program to generate the k0, kout, km, kb, tp, and IC50 parameters. In order to establish the initial conditions for both pools and with respect to the circadian rhythm, the T-lymphocyte cell counts were shifted by 96 h with Cp set = 0 to allow zero time values to be fitted. Achievement of steady-state prior to time zero (i.e. prior to 96 h on adjusted scale) was ensured by visual inspection of fitted curves in all individual fittings.
Testing of an additional first-order rate constant added to the precursor compartment yielded identical fittings and a negligible fitted value. We also explored the option of letting the zero-order production rate constant (k0) be the time-dependent periodic process, and letting the first-order distribution rate constant (kp) be time-independent. This model did not generate an appreciable difference in curve fitting compared to the final model. The evaluation of goodness-of-fit was done by comparing the sum of squared residuals (SSR) as well as Adapt II forms [11] of the Akaike Information Criterion (AIC) and Schwarz Criterion (SC).
In vitro whole blood lymphocyte proliferation
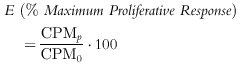
The observed [3H]-thymidine incorporation by lymphocytes after exposure to pulsed prednisolone were directly expressed as percent of maximum proliferative response (no prednisolone):
 |
(8) |
where CPM are counts min−1, subscript p denotes prednisolone, 0 denotes control (maximal counting without drug). All CPMs were normalized by measured lymphocyte cell counts.
The inhibitory concentration-effect relationship was modelled with the simple Imax model:
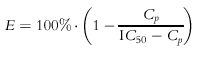 |
(9) |
where E is percentage CPM after treatment of cell cultures with prednisolone, Cp is the added prednisolone concentration, and IC50 is the concentration of prednisolone decreasing the CPM (control without drug) by 50%.
Ex vivo whole blood lymphocyte proliferation
The PK/PD model for prednisolone inhibition of ex vivo WBLP is an extension of the model of Meno-Tetang et al. [2] and is depicted in Figure 1. The observed effects of [3H]-thymidine incorporation by lymphocytes after oral administration of prednisone were expressed as a percent of predose values. The average of the quadruplicate culture results at each time points were fitted. The WBLP response expressed at time t was described as:
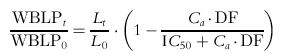 |
(10) |
where WBLPt is the ex vivo proliferative response at time t post dose and WBLP0 is at predose; Lt is the lymphocyte cell counts at time t, and L0 is at predose; DF is the dilution factor in the well. After administration of prednisone, WBLP responsiveness was inhibited but the maximum inhibition was not immediately observed but was found to decrease for approximately 18 h. To account for this initial delay, a transduction phase with rate constant kt was introduced and the active prednisolone concentration (Ca) driving the WBLP was described as:
| (11) |
Figure 1.

Model for prednisolone pharmacokinetics and effects on lymphocyte trafficking and whole blood lymphocyte responsiveness.
The PK/PD modelling was performed piecewise using an iterative two-stage analysis. Individual PK parameter values were used during the estimation of T-lymphocyte trafficking parameters; these PD values were further fixed for the estimation of the ex vivo WBLP parameters. The ex vivo WBLP time course was fitted to convergence by the maximum likelihood method using the ADAPT II program [11] to generate the IC50 and kt.
Statistical methods
Data are expressed as mean values±s.d. Sex- and race-based comparisons were determined by two-way anova. Statistical significance was defined as P < 0.05. All statistical analysis was done using systat for Windows version 9.01 (SPSS Inc., Chicago, IL).
Results
Subject characteristics
Thirty-two healthy subjects completed the study. Table 1 lists their characteristics. All 16 females reported positive readings on ovulation predictor kits at least 2 days prior to day 1 of the study for both baseline and treatment phases. The timing of entry into the study in relation to their menstrual cycle for females averaged 21±2 days during baseline and 20±4 days during treatment phase. The timings are within the usual range of the luteal phase.
Table 1.
Subject demographics.
| WM | BM | BF | WF | |
|---|---|---|---|---|
| Age (years) | 28.1±8.9 | 33.3±5.3 | 29.9±6.6 | 30.1±8.5 |
| TBW (kg) | 77.1±6.6 | 74.0±11.6 | 72.5±10.6 | 65.3±10.3 |
| Dose/TBW (mg kg−1) | 0.27±0.01 | 0.27±0.01 | 0.27±0.01 | 0.27±0.01 |
Data are mean±s.d. (n = 32); TBW, total body weight.
Pharmacokinetics
The mean plasma (±s.d.) concentration-time profiles of prednisolone (total and unbound) with fitted equations following a single oral dose of prednisone are shown in Figure 2 for the four groups. The pattern reflects rapid appearance of total and unbound prednisolone and their parallel decline. The PK profiles of 15/32 subjects were best fitted with monoexponential disposition, and 17/32 with biexponential disposition. The four mean profiles show generally similar pharmacokinetics of prednisolone in relation to sex and race.
Figure 2.

Time-course of mean±s.d. and fitted (lines) prednisolone concentrations (• total prednisolone, ○ unbound prednisolone). The pharmacokinetic model used (top right) and comparative CL/F/TBW values of unbound prednisolone are also shown for individual subjects (○) as well as group mean values (▴).
The compartmental model-derived pharmacokinetic parameters of total and unbound prednisolone in the four groups and the two-way anova results are summarized in Table 2. The AUC of unbound prednisolone was significantly larger (gender effect P < 0.01, power = 0.90) in the female group in both races (434 ± 68 ng ml−1 h vs 375 ± 111 ng ml−1 h in whites, 497 ± 84 ng ml−1 h vs 364 ± 66 ng ml−1 h in blacks). The apparent clearance normalized by total body weight (TBW) was 22% higher in WM and 40% higher in BM (gender effect P < 0.01, power = 0.85). The apparent volume of distribution is also higher in men (gender effect P < 0.01, power = 0.83), resulting in a similar elimination half-life. No race- or sex x race-based differences were found in any parameters.
Table 2.
Model derived pharmacokinetic absorption and disposition parameters of total and unbound prednisolone.
| P value | ||||||
|---|---|---|---|---|---|---|
| Parameters | WM | BM | WF | BF | Sex | Race |
| Total prednisolone absorption | ||||||
| ka (h−1) | 5.62±5.78 | 9.71±8.13 | 4.80±4.44 | 2.98±1.86 | NS | NS |
| tlag (h) | 0.283±0.0861 | 0.294±0.0341 | 0.263±0.139 | 0.243±0.0963 | NS | NS |
| Disposition | ||||||
| Vc/F (l) | 44.8±12.1 | 45.5±15.2 | 29.1±8.85 | 42.2±8.46 | <0.05 | NS |
| Vc/F/TBW (l kg−1) | 0.590±0.196 | 0.613±0.169 | 0.453±0.136 | 0.586±0.101 | NS | NS |
| CL/F (l h−1) | 13.5±2.91 | 12.6±2.03 | 11.8±2.16 | 11.7±1.89 | NS | NS |
| CL/F/TBW (l h−1 kg−1) | 0.178±0.05 | 0.172±0.0181 | 0.181±0.0266 | 0.165±0.0399 | NS | NS |
| t1/2 (h) | 2.33±0.523 | 2.51±0.813 | 1.74±0.467 | 2.54±0.546 | NS | <0.05 |
| AUC (ng ml−1 h) | 1638±426 | 1628±239 | 1544±239 | 1708±298 | NS | NS |
| Unbound prednisolone absorption | ||||||
| ka (h−1) | 6.65±6.26 | 9.74±6.41 | 7.94±6.98 | 4.01±5.07 | NS | NS |
| tlag (h) | 0.315±0.108 | 0.338±0.123 | 0.343±0.178 | 0.279±0.0525 | NS | NS |
| Disposition | ||||||
| Vc/F (l) | 165±46.6 | 162±43.0 | 107±34.0 | 114±29.4 | <0.01 | NS |
| Vc/F/TBW (l kg−1) | 2.18±0.745 | 2.183±0.357 | 1.65±0.462 | 1.58±0.321 | <0.01 | NS |
| CL/F (l h−1) | 59.4±14.9 | 57.6±13.8 | 42.1±9.59 | 39.8±6.40 | <0.01 | NS |
| CL/F/TBW (l h−1 kg) | 0.788±0.265 | 0.778±0.143 | 0.644±0.108 | 0.554±0.093 | <0.01 | NS |
| t1/2 (h) | 1.92±0.264 | 2.01±0.538 | 1.76±0.264 | 2.01±0.466 | NS | NS |
| AUC (ng ml−1 h) | 375±111 | 364±65.6 | 434 ±68.5 | 497±84.2 | <0.01 | NS |
NS, not significant (P > 0.05). Data are mean values±s.d. (n = 8/group).
ka, first-order absorption rate constant; tlag, lag time in absorption; Vc/F, apparent volume of the central compartment; TBW, total body weight; CL/F, apparent systemic clearance; t1/2, half-life; AUC, area under the prednisolone concentration vs time curve.
Pharmacodynamics
T-lymphocytes
The mean lymphocyte cell count-time profiles with fitted curves are shown in Figure 3 for the four groups. The baseline cell counts showed a circadian rhythm and was generally well characterized as a cosine function. The nadir usually occurred between 08.00 h (time 0 and 24 h after dosing) and noon, and the acrophase was found at 02.00 h (time 18 h after dosing). Prednisone was given near the low point of the baseline circadian rhythm. Nonetheless, cell concentrations declined rapidly reaching a nadir after about 4 h. Following the nadir, cell counts returned towards baseline reaching the acrophase at about 18 h. A rebound is evident in Figure 3 with peak cell counts being about 120% of those during baseline. After the acrophase, cell counts trended towards, but did not reach, the baseline at the time of last sampling.
Figure 3.

Time course of mean+s.d. and fitted blood T-lymphocyte cell counts. Symbols show experimental data and lines show the fittings to the pharmacodynamic model shown above. The baseline phase is displayed by the solid symbols and solid lines. The prednisone phase is displayed by the open symbols and broken lines. The pharmacodynamic model used (top right) and comparative IC50 values are also shown for individual subjects (○) as well as group mean values (▴).
The pharmacodynamic parameter estimates are listed in Table 3. The T-lymphocyte data from one white woman were excluded from the analysis because she showed no suppressive/stimulatory response after the 15 mg dose of prednisone. Within sex, whites have higher IC50 values (WM/BM ratio = 1.48, 95% confidence interval (CI) = 0.47, 2.49; WF/BF ratio = 1.86, 95% CI = 1.13, 2.58), indicating a potential race-based difference in sensitivity to the inhibitory effects of prednisolone on T-lymphocyte trafficking. However, this difference did not achieve statistical significance (power = 0.23). No sex–race interactions were significant.
Table 3.
Pharmacodynamic parameters for T-lymphocyte trafficking.
| P value | ||||||
|---|---|---|---|---|---|---|
| Parameters | WM | BM | WF | BF | Sex | Race |
| k0 (cells ml−1 h−1) | 0.610±0.144 | 0.644±0.295 | 0.746±0.185 | 0.597±0.325 | NS | NS |
| kout (h−1) | 0.301±0.063 | 0.328±0.138 | 0.375±0.068 | 0.290±0.101 | NS | NS |
| km (h−1) | 0.176±0.260 | 0.129±0.065 | 0.088±0.040 | 0.151±0.159 | NS | NS |
| kb (h−1) | 0.090±0.203 | 0.036±0.018 | 0.020±0.013 | 0.032±0.028 | <0.05 | NS |
| tp (h) | 16.0±1.75 | 15.3±2.28 | 14.0±1.05 | 13.3±3.07 | NS | NS |
| IC50 (ng ml−1) | 9.15±7.50 | 6.19±2.79 | 8.80±3.71 | 4.74±2.78 | NS | NS |
Data are mean values±s.d. (WM, n = 8; BM, n = 8; WF, n = 7; BF, n = 8).
k0, zero order rate of production of T-lymphocytes into the extravascular compartment; kout, first-order rate constant describing T-lymphocyte movement out of the blood compartment; km, first-order rate of T-lymphocyte entering into blood from the extravascular compartment per unit time;kb, amplitude of the circadian entry rate; tp, peak time of the circadian function; IC50, drug concentratrion producing 50% of maximum inhibition on lymphocyte trafficking.
In vitro whole blood lymphocyte proliferation
The WBLP inhibition curves where prednisolone was added in vitro are presented in Figure 4 for the four groups. The effect-concentration relationship can be described by the simple Imax model (Equation 8). Maximum stimulation was achieved at low drug concentrations. With increased prednisolone concentrations, lower mitogenic responses were obtained approaching zero proliferation. Fitted parameters are listed in Table 4. Within sex, blacks have higher IC50 values (BM/WM ratio = 1.80, 95% CI = 0.41, 3.19; BF/WF ratio = 2.63, 95% CI = 0.16, 5.42), indicating a potential race-based difference in sensitivity to the direct inhibitory effects of prednisolone on in vitro WBLP. Interestingly, this racial difference in IC50 values, though not statistically significant (power = 0.62) is opposite to the observation of IC50 values for T-lymphocyte trafficking (Table 3).
Figure 4.

Concentration-response curves of prednisolone for inhibition of [3H]-Thymidine incorporation after stimulation of whole blood cells with PHA. The solid symbols are experimental data from the whole blood assay and lines are the fittings of data to Equation 9. The comparative prednisolone IC50 values for in vitro WBLP inhibition are also shown for individual subjects (○) as well as group mean values (▴).
Table 4.
Pharmacodynamic parameters for in vitro and ex vivo WBLP.
| P value | ||||||
|---|---|---|---|---|---|---|
| Parameters | WM | BM | WF | BF | Sex | Race |
| In vitro WBLP | ||||||
| IC50 (ng ml−1) | 24.5±10.8 | 44.0±40.7 | 23.9±15.2 | 62.8±79.8 | NS | NS |
| Ex vivo WBLP | ||||||
| IC50 (ng ml−1) | 2.08±1.55 | 2.37±2.13 | 6.85±8.44 | 4.15±3.47 | NS | NS |
| kt (h) | 0.335±0.329 | 0.186±0.218 | 0.262±0.387 | 0.502±1.02 | NS | NS |
Data are mean values±s.d. (WM, n = 8; BM, n = 8; WF, n = 7; BF, n = 8).
IC50, prednisolone concentration producing 50% of the maximum inhibition of WBLP; kt, transduction rate constant.
Ex vivo whole blood lymphocyte proliferation
After prednisone administration, lymphocyte proliferation in whole blood was suppressed but the maximum inhibition was delayed and then remained decreased for approximately 18 h (Figure 5). This PD profile is partly reflective of the time course of prednisolone concentrations in the blood exceeding the IC50, the direct inhibition of mitogen stimulated lymphocyte proliferation by prednisolone, the indirect inhibition of the number of circulating lymphocytes present in the blood produced by prednisolone, and by a transduction delay of prednisolone activity on lymphocytes. The transit time of this step (1/kt) was estimated at about 2.3 h. No sex or racial differences in the pharmacodynamic parameters of ex vivo WBLP were observed (power = 0.26 for comparison of IC50 values).
Figure 5.

Time course of mean+s.d. and fitted ex vivo WBLP expressed as percent of baseline. Symbols show experimental data and lines show the fittings to the pharmacodynamic model shown in Figure 1.
Discussion
Uncontrolled immunologic responses account for graft failures and for the development and worsening of autoimmune diseases [12]. Immunosuppressive therapy is used to decrease humoral and cell-mediated reactivity by partially blocking the rate-limiting steps in the immune response produced by lymphocytes on recognition of foreign or altered materials. Determination of lymphocyte responsiveness can be obtained ex vivo by performing mitogen-stimulated whole blood lymphocyte proliferation and this method requires very small blood volumes allowing serial sampling [2, 6]. This assay reflects the time course of prednisolone concentrations, the number of lymphocytes present in the blood sample as well as their intrinsic capability to respond to an immunologic challenge. An integrated PK/PD model was developed to characterize these complex processes.
The lymphocyte pharmacodynamic model used in this study differed from our previous studies [2, 13–15]. In this study, a model that is capable of encompassing a substantial rebound component, as demonstrated by the return of lymphocytes beyond corresponding baseline cell counts, was needed. This was accomplished by use of a modified precursor-dependent indirect pharmacodynamic response model previously developed by Sharma et al. [16]. As such, the pharmacodynamic parameters of km and kb have first-order (h−1) rather than zero-order units (cells ml−1 h−1) and the values from the previous studies have to be converted for direct comparison. Such converted km and kb values are similar to those obtained in the present study [15].
As lymphocytes displayed a circadian rhythm, ex vivo proliferative responses fluctuated with time, reaching a nadir at approximately 4 h postdose, in concordance with lower lymphocyte cell counts. Interestingly, maximum inhibition of the proliferative response was not immediately observed after prednisone dosing, but 4 h later, when drug concentrations were approaching the in vitro IC50. This time delay is in agreement with the mechanism of action of prednisolone and was described by a transduction function in the PK/PD model. Indeed, prednisolone acts at the G1 phase by inhibiting cytokine gene transcription in antigen presenting cells (e.g. IL-1) and T lymphocytes (e.g. IL-2) [17, 18]. After diffusion of unbound drug from plasma to cytosolic receptors, the drug-receptor complex is activated by separation from heat shock proteins and rapidly translocates into the nucleus where it binds to glucocorticoid response elements (GRE) on DNA. These regulate and alter the transcription of specific genes, thereby modulating mRNA concentrations and affecting synthesis of various specific proteins. The slow onset of effects is caused by the time needed for either cell movement, mediator suppression, and/or mRNA and protein synthesis.
No statistically significant sex- or race-related difference was observed in IC50 values with in vitro, ex vivo WBLP, or in vivo lymphocyte trafficking processes. However, variability was large and group size small offering the possibility of a type-2 statistical error. A similar observation was found in a study where in vitro WBLP was performed in six Caucasian male (IC50 = 29.3 nm) and three Caucasian female (IC50 = 31.6 nm) healthy subjects [6]. Also concurring with our findings are the results from a study done by Lew et al. [13] who investigated the pharmacokinetics and selected pharmacodynamic responses to methylprednisolone in six men and six women. Their T helper lymphocyte trafficking analysis showed no statistically significant differences in parameters between men and women.
Several other pharmacodynamic measures assessed previously for prednisolone in relation to sex and race in these subjects were suppression of cortisol secretion and trafficking of T-helper cells, T-suppressor cells, and neutrophils [19]. Of these, the only significant difference in IC50 values were lower concentrations for T-suppressor cells in both male and female blacks compared with whites.
An interesting observation from this study was that IC50 values obtained ex vivo were about 10 times lower than in vitro values. This finding in humans is in agreement with our previous study performed in rats where ex vivo IC50 values were also about 10 times lower than in vitro values [20]. This observation suggests that additional in vivo factors may have enhanced lymphocyte response to the inhibitory effect of prednisolone. The absence of cortisol owing to adrenal suppression by prednisolone may be contributing [21].
In summary, a three-component complex model well characterized the time course of prednisolone inhibition of ex vivo whole blood lymphocyte proliferation. This integrated PK/PD model enables evaluation of the multicomponent direct and indirect inhibition of ex vivo whole blood lymphocyte proliferation by steroids in relation to sex and race of the subjects and may be applicable to other immunosuppressants.
Acknowledgments
The authors would like to thank the clinical staff of the Clinical Pharmacokinetics Laboratory at the Millard Fillmore Hospital and Ms Nancy Pyszczynski and Ms Suzette Mis for providing valuable support in this study. The authors would also like to thank Dr Wojciech Krzyzanski for his insightful discussion.
This work is supported by Grant No. GM 24211 from the National Institutes of General Medical Sciences, NIH; and fellowship support for M. H. Magee from SmithKline Beecham Pharmaceuticals, Philadelphia, PA.
References
- 1.Halloran PF. Molecular mechanisms of new immunosuppressants. Clin Transplant. 1996;10:118–123. [PubMed] [Google Scholar]
- 2.Meno-Tetang GM, Gobburu JVS, Jusko WJ. Influence of gender on prednisolone effects on whole blood T-cell deactivation and trafficking in rats. J Pharm Sci. 1999;88:46–51. doi: 10.1021/js9802695. [DOI] [PMC free article] [PubMed] [Google Scholar]
- 3.Milsap RM, Plaisance KL, Jusko WJ. Prednisolone dispostion in obese men. Clin Pharmacol Ther. 1984;36:824–831. doi: 10.1038/clpt.1984.263. [DOI] [PubMed] [Google Scholar]
- 4.Rose JQ, Jusko WJ. Corticosteroid analysis in biological fluids by high-performance liquid chromatography. J Chromatogr. 1979;162:273–280. doi: 10.1016/s0378-4347(00)81514-5. [DOI] [PubMed] [Google Scholar]
- 5.Jusko WJ, Pyszczynski NA, Bushway MS, D'Ambrosio R, Mis SM. Fifteen years of operation of a high-performance liquid chromatographic assay for prednisolone, cortisol and prednisone in plasma. J Chromatogr B Biomed Appl. 1994;658:47–54. doi: 10.1016/0378-4347(94)00218-5. [DOI] [PubMed] [Google Scholar]
- 6.Ferron GM, Jusko WJ. Species- and gender-related differences in cyclosporine/prednisolone/sirolimus interactions in whole blood lymphocyte proliferation assays. J Pharmacol Exp Ther. 1998;286:191–200. [PubMed] [Google Scholar]
- 7.Miyawaki T, Taga K, Nagaoki T, Seki H, Suzuki Y, Taniguchi N. Circadian changes of T lymphocyte subsets in human peripheral blood. Clin Exp Immunol. 1984;55:618–622. [PMC free article] [PubMed] [Google Scholar]
- 8.Milad MA, Ludwig EA, Anne S, Middleton E, Jr, Jusko WJ. Pharmacodynamic model for joint exogenous and endogenous corticosteroid suppression of lymphocyte trafficking. J Pharmacokin Biopharm. 1994;22:469–480. doi: 10.1007/BF02353790. [DOI] [PubMed] [Google Scholar]
- 9.Bloemena E, Weinreich S, Schellekens PT. The influence of prednisolone on the recirculation of peripheral blood lymphocytes in vivo. Clin Exp Immunol. 1990;80:460–466. doi: 10.1111/j.1365-2249.1990.tb03310.x. [DOI] [PMC free article] [PubMed] [Google Scholar]
- 10.ten Berge RJ, Sauerwein HP, Yong SL, Schellekens PT. Administration of prednisolone in vivo affects the ratio of OKT4/OKT8 and the LDH-isoenzyme pattern of human T lymphocytes. Clin Immunol Immunopathol. 1984;30:91–103. doi: 10.1016/0090-1229(84)90010-2. [DOI] [PubMed] [Google Scholar]
- 11.D'Argenio DZ, Schumitzky A. Los Angeles: Biomedical Simulations Resource; 1997. ADAPT II Users' Guide: Pharmacokinetic/Pharmacodynamic Systems Analysis Software. [Google Scholar]
- 12.Shoker AS. Immunopharmacologic therapy in renal transplantation. Pharmacotherapy. 1996;16:562–575. [PubMed] [Google Scholar]
- 13.Lew KH, Ludwig EA, Milad MA, et al. Gender-based effects on methylprednisolone pharmacokinetics and pharmacodynamics. Clin Pharmacol Ther. 1993;54:402–414. doi: 10.1038/clpt.1993.167. [DOI] [PMC free article] [PubMed] [Google Scholar]
- 14.Chakraborty A, Blum RA, Cutler DL, Jusko WJ. Pharmacoimmunodynamic interactions of interleukin-10 and prednisone in healthy volunteers. Clin Pharmacol Ther. 1999;65:304–318. doi: 10.1016/S0009-9236(99)70110-4. [DOI] [PubMed] [Google Scholar]
- 15.Wald JA, Law RM, Ludwig EA, Sloan RR, Middleton E, Jr, Jusko WJ. Evaluation of dose-related pharmacokinetics and pharmacodynamics of prednisolone in man. J Pharmacokin Biopharm. 1992;20:567–589. doi: 10.1007/BF01064420. [DOI] [PubMed] [Google Scholar]
- 16.Sharma A, Ebling WF, Jusko WJ. Precursor-dependent indirect pharmacodynamic response model for tolerance and rebound phenomena. J Pharm Sci. 1998;87:1577–1584. doi: 10.1021/js980171q. [DOI] [PubMed] [Google Scholar]
- 17.Scudeletti M, Castagnetta L, Imbimbo B, Puppo F, Pierri I, Indiveri F. New glucocorticoids. Mechanisms of immunological activity at the cellular level and in the clinical setting. Ann NY Acad Sci. 1990;595:368–382. doi: 10.1111/j.1749-6632.1990.tb34310.x. [DOI] [PubMed] [Google Scholar]
- 18.Paliogianni F, Ahuja SS, Balow JP, Balow JE, Boumpas DT. Novel mechanism for inhibition of human T cells by glucocorticoids. Glucocorticoids inhibit signal transduction through IL-2 receptor. J Immunol. 1993;151:4081–4089. [PubMed] [Google Scholar]
- 19.Magee MH, Blum RA, Lates CD, Jusko WJ. Prednisolone pharmacokinetics and pharmacodynamics in relation to sex and race. J Clin Pharmacol. 2001;41:1180–1194. doi: 10.1177/00912700122012733. [DOI] [PMC free article] [PubMed] [Google Scholar]
- 20.Ferron GM, Jusko WJ. Pharmacokinetic and pharmacoimmunodynamic interactions between prednisolone and sirolimus in rabbits. Pharm Res. 1998;15:1888–1894. doi: 10.1023/a:1011966308791. [DOI] [PubMed] [Google Scholar]
- 21.Chow FS, Sharma A, Jusko WJ. Modeling interactions between adrenal suppression and T-helper lymphocyte trafficking during multiple dosing of methylprednisolone. J Pharmacokin Biopharm. 1999;27:559–575. doi: 10.1023/a:1020974408657. [DOI] [PubMed] [Google Scholar]