Abstract
Aims
To investigate whether saliva is a useful alternative to plasma for routine monitoring of nicotine and evaluate the predictive performances of saliva and plasma concentration on craving estimated by a Tiffany Questionnaire on Smoking Urge-Brief Form.
Methods
Thirteen healthy smokers were enrolled in a randomized, two period, crossover trial. Linear and power models were evaluated to predict the plasma nicotine concentrations from the saliva measurements, whereas a population PK/PD indirect response model was used to predict craving using either saliva or plasma nicotine concentration as the independent variable.
Results
The results of the analysis revealed that the power model was preferred over the linear one The bias on the predicted plasma concentrations was of 0.47 ng ml−1 with a 95% confidence interval of [-0.57, 1.52] and a precision of 5.68 ng ml−1. The placebo effect model was initially fitted to data, then the indirect response approach (with inhibition in kin) was used to model the craving scores using plasma and saliva nicotine concentrations as independent variables. The two indirect response PK/PD models based on saliva and plasma nicotine concentrations, adequately described the onset, extent, and duration of craving. The maximal inhibition Imax was 0.722 and 1 for saliva and plasma concentrations while the estimated nicotine concentrations giving 50% of the maximal inhibition were 269 ng ml−1 and 24.3 ng ml−1 for saliva and plasma, respectively.
Conclusions
A good correlation between plasma and saliva nicotine concentrations has been found using a power model. Comparable values of bias and precision on the model-predicted craving indicate that plasma and saliva concentration can equally well be used to predict the onset of tobacco withdrawal induced craving. Analysis of saliva definitely offers a potentially more attractive way to assess nicotine concentration values, as samples can be collected easily and noninvasively. In addition, saliva sampling avoids the pain and discomfort involved in venepuncture. In studies that assess psychological measures, such as subjective mood, blood collection could present a possible confounding factor because of the anxiety and pain that accompanies it. For these reasons saliva can reasonably be considered as the ideal sampling site for all clinical studies conducted for the evaluation of the potential activity of drugs on nicotine deprivation symptoms.
Keywords: craving, population PK/ PD, saliva plasma nicotine concentration, smoking cessation
Introduction
Nicotine addiction is recognized as a primary process in the maintenance of smoking behaviour and general failure of treatment interventions. Nicotine deprivation causes cigarette craving and withdrawal symptoms [1, 2]. Nicotine Replacement Treatments (NRTs). (gum, patches, nasal spray) have been shown to increase the proportion of quitters and to reduce that of relapsers [3, 4]. This effect has generally been attributed to the capability of nicotine to reduce craving and withdrawal symptoms [4, 5]. Nicotine interacts with central nervous system receptors facilitating the release of neurotransmitters such as dopamine, norepinephrine, acetylcholine, glutamate and serotonin [6, 7]. However the relationship between reduction of craving and withdrawal symptoms and an improved treatment outcome is not yet completely understood [8–10]. Furthermore, the relationship between nicotine concentrations and intensity of craving and withdrawal symptoms during the quitting or the relapsing phases has not been fully explored [11]. Withdrawal symptoms and craving appear 6-12 h (peak at 48 h) after smoking cessation, and whereas withdrawal symptoms disappear after 3-4 weeks, craving can still persist after 6 months [12]. Consequently, fluctuations in craving or withdrawal symptoms can be related to changes in nicotine blood concentrations (at zero after 10-12 h of smoking abstinence), during the acute quitting phase but not during the relapse phase. Unfortunately, most studies have been conducted to assess quitting and relapse rates. Many of these studies have shown only an indirect causal connection between plasma nicotine concentrations and levels of craving and withdrawal symptoms, showing that patients receiving NRTs had lower craving/withdrawal than those receiving placebo [3–5, 14]. Some of these studies reported only daily measurements of nicotine concentration accompanied by retrospective measurement of craving/withdrawal symptoms. These measurements could not be considered to reflect possible daily fluctuation of craving/withdrawal symptoms and nicotine blood concentrations. Only few studies have investigated short-term cigarette craving and withdrawal symptoms or have taken repeated measurements of plasma nicotine trough concentrations. Schun & Stitzer [16] demonstrated that craving increased within minutes after finishing a cigarette, but they did not measure nicotine blood concentration. Lunnel et al. [17] showed that nicotine inhalation reduced craving over 2 days in smokers not trying to quit, and found a negative correlation between nicotine blood concentrations and craving. Jarvik et al. [18] showed that the increase in craving was correlated inversely with nicotine blood concentrations during 6 h of smoking abstinence. In a previous study we showed that the increase in craving was inversely related to nicotine saliva concentration during 72 h of abstinence. In this work, the Tiffany Questionnaire on Smoking Urge-Brief Form (QSU-BF) was used [19] and appropriate pharmacokinetic and pharmacodynamic models were developed to relate changes in craving to nicotine saliva concentration. In addition Rose et al. [21] showed that saliva nicotine concentration can be used as an alternative to nicotine plasma concentration during nicotine patch administration. However, no formal study on the relation between nicotine concentration in plasma and saliva has been performed and no study on the ability to predict craving using either saliva or plasma concentrations has been reported. The aim of this study was to extend the work of previous authors by examining whether saliva could be a useful alternative to plasma for routine monitoring of nicotine and to evaluate the prediction of craving using saliva and plasma concentrations estimated by the QSU-BF.
Methods
Subjects
Thirteen healthy subjects (six men and seven women) free from clinically significant illness or disease as determined by their medical history (including family history), physical examination, laboratory data, and other tests, were enrolled in this study. All subjects were recruited from the panel of volunteers of the Clinical Pharmacology Unit of the GlaxoSmithKline in Verona (Italy). The subjects ranged in age from 20 to 61 years (32.5 ± 13.5), with a body weight ranging from 50 to 87 kg (67.4, ±9.7). According to the study protocol only smokers of 15 cigarettes or more a day for the past year who were not motivated to stop smoking, and who had a self reported Fagerström Tolerance Questionnaire (FTQ) [22, 23] score of at least 7, were enrolled in the study. All subjects gave informed written consent. Local regulatory and ethics committee approval was obtained before the start of the study, which was conducted in accordance with the declaration of Helsinki.
Study design
This was a randomized, two period crossover study. In one period smoking and any other form of nicotine consumption was not allowed. In this period placebo was administered as an oral tablet once a day (placebo period) In the other period subjects were freely allowed to smoke (free smoking period). Each study period consisted of 72 h with a free smoking washout of at least 10 days. The Tiffany QSU-BF was administered at 0, 3, 6, 12, 24, 30, 36, 48, 54, 60 and 72 h. Saliva and plasma samples were collected for nicotine measurement. At the same times, exhaled carbon monoxide (CO), plasma nicotine and cotinine concentrations were assessed for abstinence compliance. Saliva samples were collected after stimulation of saliva flow by means of parafilm [24] and within half an hour of the last cigarette smoked.
Nicotine assay
Nicotine analysis of plasma and saliva samples was performed using a high performance liquid chromatography method combined with mass spectrometric detection. The lower limit of detection, precision and accuracy of the method were evaluated using the results of the quality control samples (QCs) assayed daily with the clinical samples. The lower limit of detection was 5 ng ml−1. The precision of the QCs were less than 14.4% at a low concentration (≤ 7.5 ng ml−1), 11.1% at a medium concentration (≤ 75 ng ml−1) and 12.6% at a high concentration (≤ 750 ng ml−1) of the compound. The accuracy of the QCs averaged −5.71% at the low, −12.0% at the medium and −5.31% at the high concentration of nicotine.
Modelling approaches
The ability to forecast plasma nicotine concentrations from saliva measurements was investigated by evaluating bias and precision on the predicted plasma concentration values using linear and power models (Equation 1 and 2).
 |
[1] |
 |
[2] |
An indirect response PK/PD modelling approach was used to link nicotine concentrations in saliva and plasma to the observed craving scores (Cs) [25]. The basic premises of this approach are that the tobacco withdrawal induced craving fluctuates around a basal value (no drug or placebo effect) and that the nicotine supplied in the free smoking treatment period can control either the onset or the disappearance rate of Cs.
Placebo effect model
The rate of change of craving over time following placebo was described by:
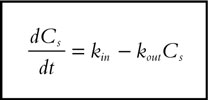 |
[3] |
where kin represents the zero-order constant for craving onset and kout defines the first-order rate constant for craving disappearance.
As stationarity is assumed, Cs is supposed to fluctuate around to an average baseline value (Cs*). Thus:
 |
[4] |
which reduces the number of parameters in the model. Inspection of the scores changes over time after placebo administration indicates the presence of a circadian variability; therefore kin was modelled as a cosine function:
 |
[5] |
Where: Cs* is the average placebo response at baseline, Amplitude is the amplitude of the circadian variation, t is the time, tmax is the time of the peak response (acrophase) and 2π/24 converts clock time in radians.
PK/PD model
The aim of the PK/PD model was to relate the changes on nicotine concentration to the changes on craving scores accounting for the placebo response. The individual placebo response parameters (kout, Cs*, Amplitude and tmax) were initially estimated on the placebo data, using an empirical Bayesian approach, and these parameters were fixed for each subject in the subsequent analyses. In a recent paper [20] the indirect response model with inhibition on kin has been shown to be the preferred model to relate nicotine concentrations measured in a free smoking period to craving score. Therefore, the indirect response model defined by Equation 6 was used in the PK/PD model fitting.
 |
[6] |
where: Imax is the maximal inhibition rate, IC50 is the nicotine concentration producing 50% of Imax, Nc the nicotine concentration and kin is the placebo effect defined by the Equation 5.
Data analysis
The analyses were performed using the nonlinear mixed-effect modelling approach as implemented in the NONMEM (Version V) computer program [26]. The population characteristics of the parameters (fixed and random effects) were estimated according to a user defined model for the evaluation of the link between plasma and saliva, and according to the subroutine ADVAN6 from the library of programs provided with the NONMEM-PREDPP package, for the evaluation of the link between nicotine concentration and craving. In the two analyses, the intrasubject variability (random effects) was assessed according to an exponential error model associated to each fixed effect parameter, and the pi parameter of the jth subject was described by the relationship:
 |
(7) |
where Pmean represents the population mean and hP is assumed to be a random variable with zero mean and variance ωhP2. Nicotine concentration and craving scores in the jth individual were assumed to be affected by an exponential error term described by the relationship:
 |
(8) |
where pj are the model parameters of the jth subject, tij is the time of the ith measurement, f is the structural model, and eij represents the residual departure of the model from the observations and contains contributions from intraindividual variability, assay error and model mispecification. e is assumed to be a random variable with zero mean and variance se2. Individual posterior estimates of model parameters for each subject were obtained using the ‘POSTHOC’ option in NONMEM. The parameter estimation was initially performed either for saliva-plasma or craving analysis using the First Order Conditional Estimation (FOCE) method. However, the FO (First Order) approach was finally retained only for the saliva-plasma model due to the impossibility of obtaining any parameter estimates using the FOCE method. A Monte-Carlo simulation approach was used to estimate model mean and median curves with the 5th and 95th percentile intervals. Nicotine concentration values were initially simulated in 200 individuals (SIMULATION option in NONMEM) using the final fixed and random effect parameter values, then descriptive statistics (mean, median, 5th and 95th percentiles,…) were computed for each value of the independent variable (saliva nicotine concentration) using SAS (SAS Institute Inc., Carry, NC, USA) and the estimated parameters used in the subsequently generated diagnostic plots. The model predicted median was considered as more representative of the typical expected values due to variability in the observations and, therefore, was used in the graphical data display.
Predictive performance assessment
The model predictive performance was assessed by computing the bias (Equation 9) and precision (Equation 10) estimated using observed (Obs=craving and nicotine concentration) and model predicted (Pred=craving and nicotine concentration) values [27].
 |
[9] |
 |
[10] |
In these expressions the index i refers to the observation number and N is the sample size. 95% confidence interval for bias was computed and the Student t-test was used to compare bias with zero.
Results
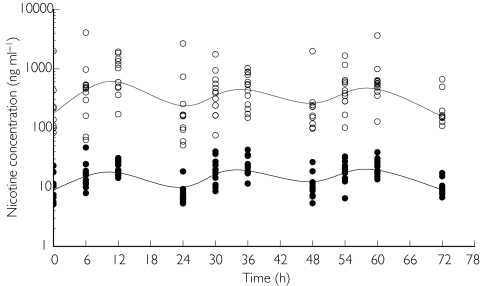
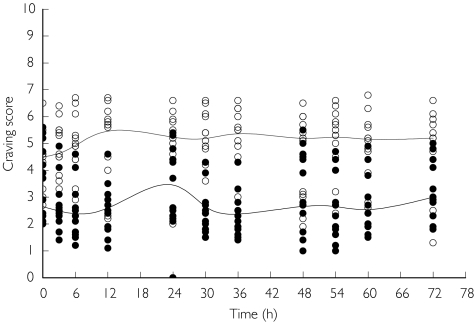
The time course of individual saliva and plasma nicotine concentration values and the time course of individual Tiffany QSU-BF craving scores in the placebo and in the smoking periods are displayed in Figures 1 and 2, respectively. All these data show a pronounced fluctuation throughout the day.
Figure 1.
Time course of individual saliva (s) and plasma (d) nicotine concentrations (ng ml−1) with the estimated median curves (solid lines) in the 72 h free smoking period. The median value of the observations has been estimated at each time point and a spline function used to connect these points.
Figure 2.
Time course of individual craving scores observed in the placebo (s) and smoking (d) periods with the estimated median curves (solid lines). The median value of the observations has been estimated at each time point and a spline function has been used connect these points.
Saliva and plasma relationship
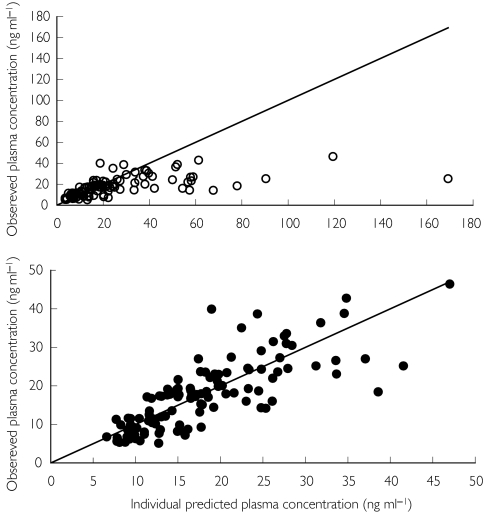
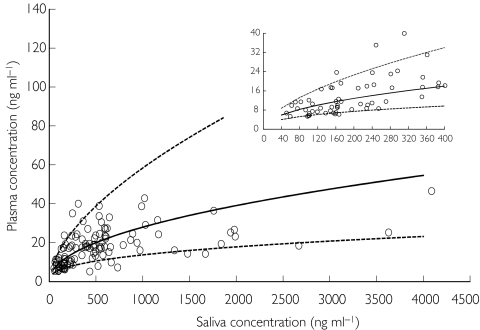
The population database consisted of 143 nicotine concentration values obtained in 13 subjects. The analysis was conducted in two steps. In the first, the alternative linear and power models were compared, whereas in the second, bias and precision on the estimated plasma concentrations were evaluated using the best model. The goodness of fit was assessed by the analysis of the residuals scatter plot and by comparing the plot of the posterior predicted values vs observed plasma concentrations to the unitary slope curve (Figure 3). The model discrimination between the two non-nested models was done using the Akaike Information Criterion (AIC), the smaller of which value was associated with the better model [28]. The results of the analysis revealed that the power model was the preferred one. The final NONMEM fixed and random effect parameter estimates are reported in Table 1. Figure 4 shows nicotine plasma concentrations as a function of those in saliva with the median model predicted curve and the 5th and 95th percentile intervals. Despite a good correlation between model predicted vs measured plasma concentration values shown in the Figure 3, visual inspection of the scatter plot showing nicotine plasma vs saliva concentration with the model median prediction (Figure 4) seems to indicate that the model, on average, overpredicts plasma concentrations at values greater than 1500 ng ml−1. This apparent discrepancy can be explained by the large variability in salivary nicotine concentration especially at high concentrations. However, Figure 4 shows that even at these large concentration values the observed measurements fall within the model predicted 5th and 95th confidence bands.
Figure 3.
Individual predicted and observed plasma concentrations as a function of saliva nicotine concentrations with the unitary slope reference line: linear model (s) and power model (d).
Table 1.
Population parameter estimates for the relationship between plasma and saliva nicotine concentrations and their estimated 95% confidence intervals (square brackets). The extent of interindividual variability (random effect parameter) is also reported as coefficient of variation (CV%).
| Model | Parameter | Fixed effect | Random effect | Residualerror | OF | AIC |
|---|---|---|---|---|---|---|
| Linear | α | 0.053 | 0.187 (CV% = 43) | 0.243 | 652.7 | 654.7 |
| [0.04, 0.07] | [0.07, 0.29] | [0.16,0.32] | ||||
| Power | β | 0.467 | 0.0096 (CV% = 10) | 0.108 | 525.4 | 527.4 |
| [0.44, 0.49] | [0.002, 0.017] | [0.07, 0.15] |
Figure 4.
Individual plasma nicotine concentration as a function of the saliva nicotine concentration with the median model predicted curve (solid line) and the 5th and 95th percentiles curves (dotted lines).
The bias on the predicted plasma concentrations was of 0.47 ng ml−1 with a 95% confidence interval of [-0.57, 1.52] with a precision of 5.68 ng ml−1. The low bias which was not statistically different from zero, and the low precision, which did not differ from the nicotine lower limit of detection of 5 ng ml−1, indicate that the power model can accurtely predict plasma concentrations from saliva nicotine concentration measurements.
Population pharmacokinetic-pharmacodynamic modelling
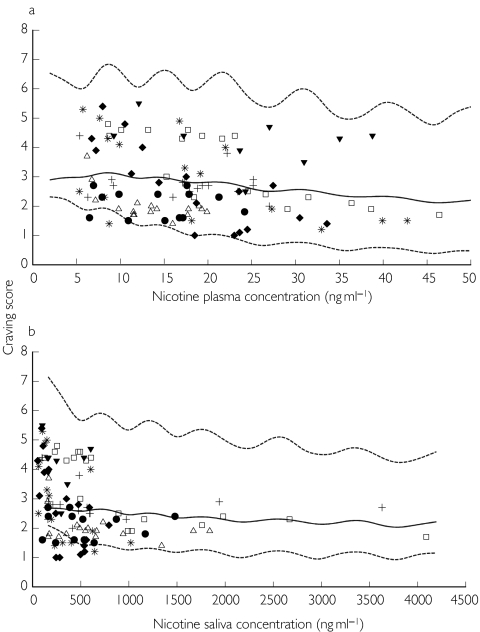
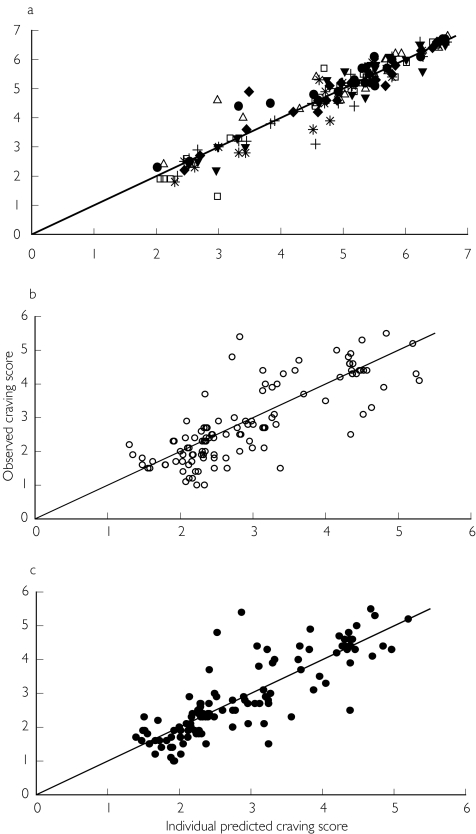
The placebo effect model was fitted to placebo craving score data (143 observations) and the indirect response model was fitted to 114 craving scores and 114 nicotine concentrations collected during the free smoking period. The mean and the median plasma nicotine concentration value were 17.6 ng ml−1 and 17.2 ng ml−1 with the 5th and 95th percentiles equal to 6.2 and 36.4 ng ml−1, while the mean and the median saliva nicotine concentration were of 566.3 ng ml−1 and 405.7 ng ml−1 with the 5th and the 95th percentiles 83.1 and 1940 ng ml−1. The population PK/PD analysis was conducted in three steps. The placebo effect model was initially fitted to data and the individual posterior parameter estimates added to the population database, then in the second step the indirect response model was fitted to the craving scores using plasma and saliva nicotine concentrations as independent variables and the individual parameters associated with the placebo effect estimated previously. In the final step bias and precision on the caving score estimated using plasma or saliva nicotine concentrations were evaluated. The observed craving scores vs plasma and saliva nicotine concentration relationships with population median prediction and 5th and 95th percentiles curves are shown in Figure 5. The adequacy of the placebo response model to describe the fluctuation of craving in the absence of active treatment has been illustrated by the plot of the observed vs predicted craving score compared to the unitary slope line (Figure 6, panel a). The goodness of fit of the indirect response model linking saliva and plasma concentration to craving was assessed by the analysis of the residuals scatter plot and by comparing the plot of the posterior predicted values vs the observed craving scores to the unitary slope curve (Figure 6, panel b and c). The final NONMEM fixed and random effect parameter estimates are reported in Table 2. The bias in the prediction of craving score presented similar values not statistically different from zero either using plasma or saliva nicotine concentrations. The good predictive performance of plasma and saliva concentrations was also confirmed by the 95% confidence intervals around the bias (both including zero) and by the similar values for precision, which were always lower than the average interindividual standard error on observed craving (1.07) as shown in Table 3.
Figure 5.
Observed craving scores vs plasma (a) and saliva (b) nicotine concentration with population median prediction (solid line) and 5th and 95th percentiles curves (dotted lines).
Figure 6.
Observed vs indirect PK/PD model (Equation 5 and 6) predicted craving scores with the unitary slope reference line estimated in the placebo period (panel a) and in the free smoking period using saliva (s, panel b) and plasma (d, panel c) nicotine concentration as the independent variable.
Table 2.
Population parameter estimates for the placebo effect and for the PK/PD model and their estimated 95% confidence intervals (square breackets). The extent of interindividual variability (random effect parameter) is also reported as coefficient of variation (CV%).
| Parameter | Fixed effect | Random effect | Residualerror | |
|---|---|---|---|---|
| Placebo | Cs* | 5.29 | 0.113 (CV% = 34) | 0.157 |
| [4.77, 5.81] | [0.005, 0.22] | [0.07, 0.24] | ||
| Amplitude | 0.101 | 2.29 (CV% = 151) | ||
| [0.007, 0.19] | [0, 10.56] | |||
| tmax (h) | 7.43 | (*) | ||
| [6.34, 8.51] | ||||
| kout (h−1) | 0.0498 | 3.51 (CV% = 187) | ||
| [0.03, 0.07] | [0, 7.93] | |||
| Saliva | Imax | 0.722 | (*) | 0.053 |
| [0.51,0.94] | [0.03, 0.07] | |||
| IC50 (ng ml−1) | 269 | 2.95 (CV% = 171) | ||
| [25.96 512.] | [0,6.46] | |||
| Plasma | Imax | 1.0 | (*) | 0.04 |
| [0.99, 1.01] | [0.02. 0.06] | |||
| IC50 (ng ml−1) | 24.3 | 1.22 (CV% = 110) | ||
| [23.27, 25.33] | [.18,2.26] |
For these parameters the random effects were not included in the model on the basis of objective function change criteria.
Table 3.
Bias and precision on craving predicted using plasma and salivary nicotine concentration.
| Mean (s.d.) | Bias [95% CI] | Precision[95% CI] | |
|---|---|---|---|
| Observed craving | 2.83 (1.17) | ||
| Saliva predicted craving | 2.93 (0.99) | −0.099 (*) | 0.7026 |
| [-0.2277, 0.0288] | [0.5319, 0.8733] | ||
| Plasma predicted craving | 2.86 (0.99) | −0.029 (*) | 0.6295 |
| [-0.1449, 0.0870] | [0.4637, 0.7954] |
Student's t-test statistics: not statistically different from zero.
Discussion
The results indicate that saliva nicotine measurements may provide a useful marker of those in plasma. In contrast to a previous report [21], we found that a power rather than a linear model best described the relationship between saliva and plasma measurements. This finding is probably associated with the very large range of salivary concentrations (up to 4000 ng ml−1) in our study during the free smoking period, in comparison with the lower salivary concentrations (below 400 ng ml−1) reported in the previously cited paper during nicotine patch administration. However, the results of a complementary analysis conducted on a subset of our study database, including only salivary concentrations lower than 400 ng ml−1, confirmed that a linear model best described those data.
The present study showed that a mechanistic model can be established to link plasma or salivary nicotine concentrations to craving score reduction. The results are consistent with our previous findings for the same observation period [20, 29] and with other studies over shorter periods [15–18]. Furthermore, some clinical smoking cessation trials have assumed a causal relationship between plasma nicotine concentrations and the urge to smoke or craving, on the basis of reduced craving in subjects receiving nicotine replacement compared with subjects receiving placebo [3–5]. The two indirect response PK/PD models based on saliva and plasma nicotine concentrations, adequately described the onset, extent, and duration of craving. The maximal inhibition Imax was 0.72 and 1 for saliva and plasma concentra-tions, respectively, whereas the estimated nicotine concentrations giving 50% of the maximal inhibition were 269 ng ml−1 and 24.3 ng ml−1 for saliva and plasma, respectively. These results indicate that during free smoking, craving can be accurately predicted and correlated either with plasma or salivary nicotine concentrations. However, the IC50 values, giving an estimate of the nicotine potency, indicate that the same effect on craving is expected when salivary concentrations are about 10 times greater than the plasma values. These findings were consistent with previous workers showing that during nicotine patch administration, saliva nicotine concentrations were 8.1 times higher than in plasma [21]. We consider these results particularly important because they show that, under the conditions used, direct contamination of saliva by cigarette smoke does not prevent saliva nicotine measurements from predicting those in plasma nicotine and also craving changes. A limitation of this study could be the small number of subjects which reduces the opportunity to disclose uncommon plasma and saliva patterns. Thus, larger sample studies will probably be necessary to consolidate the results of the present work. Nevertheless the findings clearly add to our knowledge of the role of nicotine in subjective desire and need of smoking. We consider this quite important, because in recent years psychological and behavioural factors have been invoked to explain cigarette craving. We believe that a better understanding of the relationship between nicotine concentration and craving and smoking cessation rate would help to define the role others factors play in smoking dependence.
In conclusion, although larger studies are needed to support our results, it seems appropriate to collect saliva rather than plasma samples for nicotine concentration monitoring either during nicotine patches administration or free smoking. Such measurements should help to further define the role of nicotine concentrations and other psychological and behavioural components on craving and the effectiveness of smoking cessation therapy.
Acknowledgments
This study was funded by GlaxoSmithKline SpA, Medicine Research Centre, Verona, Italy.
References
- 1.Tobacco or Health. Geneva, Switzerland: World Health Organisation; Global Status Report. [Google Scholar]
- 2.American Psychiatric Association. Diagnostic and Statistic Manual of Mental Disorders. 4. Washington DC, APA: 1994. [Google Scholar]
- 3.Fiore MC, Smith SS, Jorenby DE, Baker TB. The effectiveness of the nicotine patches for smoking cessation. A meta-analysis. JAMA. 1994;271:1940–1947. [PubMed] [Google Scholar]
- 4.Silagy C, Mant D, Fowler G, Lancaster T. The Cochrane Library Issue 2. Oxford: Updated Software; 1998. Nicotine replacement therapy for smoking cessation (Cochrane review) [Google Scholar]
- 5.Thompson GH, Dee AH. Nicotine replacement therapy. Ann Pharmacol. 1998;32:1067–1075. doi: 10.1345/aph.17382. [DOI] [PubMed] [Google Scholar]
- 6.Clarke PBS. The Biology of Nicotine Dependence. Vol. 152. Wiley, Chichester: Ciba Foundation Symposium; 1990. Mesolimbic dopamine activation, the key to nicotine reinforcement? pp. 153–168. [DOI] [PubMed] [Google Scholar]
- 7.Watkins SS, Koob GF, Karkou A. Neuronal mechanisms underlaying nicotine addiction. acute positive reinforcement and withdrawal. Nicotine Tobacco Res. 2000;2:19–37. doi: 10.1080/14622200050011277. [DOI] [PubMed] [Google Scholar]
- 8.Curry SJ, McBride CM. Relapse prevention for smoking cessation. Review and evaluation of concepts and interventions. AnnRev Public Health. 1994;15:345–366. doi: 10.1146/annurev.pu.15.050194.002021. [DOI] [PubMed] [Google Scholar]
- 9.Kenford SL, Fiore CM, Joreby DE, Smith SS, Wetter D, Baker TB. Predicting smoking cessation. Who will quit with and without nicotine patches. JAMA. 1994;2718:589–594. doi: 10.1001/jama.271.8.589. [DOI] [PubMed] [Google Scholar]
- 10.Killen JD, Fortmann SP. Craving is associated with smoking relapse. Finding from three prospective stuides. Exp Clin Psychopharmacol. 1997;5:137–142. doi: 10.1037//1064-1297.5.2.137. [DOI] [PubMed] [Google Scholar]
- 11.Benowitz NL. Pharmacodynamics of nicotine: implication for rational treatment of nicotine addiction. Br J Addict. 1991;86:495–499. doi: 10.1111/j.1360-0443.1991.tb01796.x. [DOI] [PubMed] [Google Scholar]
- 12.Huges JR, Higgins ST, Bickel WK. Nicotine withdrawal versus other drug withdrawals syndromes. similarities and dissimilarities. Addiction. 1994;89:1461–1470. doi: 10.1111/j.1360-0443.1994.tb03744.x. [DOI] [PubMed] [Google Scholar]
- 13.Pattern CA, Martin JE. Does nicotine withdrawal affect smoking cessation? Clinical and theoretical issues. Ann Behav Med. 1996;3:190–200. doi: 10.1007/BF02883397. [DOI] [PubMed] [Google Scholar]
- 14.Schneider NG, Jarvik M, Forsythe AB. Nicotine vs. placebo gum in the alleviation of withdrawal during smoking cessation. Addictive Behav. 1984;9:149–156. doi: 10.1016/0306-4603(84)90052-2. [DOI] [PubMed] [Google Scholar]
- 15.Schneider NG. Nicotine theraphy in smoking cessation. Pharmacokinetics considerations. Clin Pharmcokinet. 1992;23:169–172. doi: 10.2165/00003088-199223030-00001. [DOI] [PubMed] [Google Scholar]
- 16.Schuh KJ, Stitzer ML. Desire to smoke during spaced smoking intervals. Psychopharmacology (Berlin) 1995;120:289–295. doi: 10.1007/BF02311176. [DOI] [PubMed] [Google Scholar]
- 17.Lunell E, Molander L, Leischow SJ, Fagerstrom KO. Effect of nicotine vapour inhalation on the relief of tobacco withdrawal symptoms. Eur J Clin Pharmacol. 1995;48:235–240. doi: 10.1007/BF00198304. [DOI] [PubMed] [Google Scholar]
- 18.Jarvik ME, Madsen DC, Olmstead RE, Iwamoto-Schaap PN, Elins JL, Benowitz NL. Nicotine blood levels and subjective craving for cigarettes. Pharmacol Biochem Behav. 2000;66:553–558. doi: 10.1016/s0091-3057(00)00261-6. [DOI] [PubMed] [Google Scholar]
- 19.Tiffany ST, Drobes DJ. The development and initial validation of a questionnaire on smoking urges. Br J Addiction. 1991;6:1467–1476. doi: 10.1111/j.1360-0443.1991.tb01732.x. [DOI] [PubMed] [Google Scholar]
- 20.Gomeni R, Teneggi V, Iavarone L, Squassante L, Bye A. Population PK/PD of craving in an enforced smoking cessation population: Indirect Response and Probabilistic modelling. Pharm Res. 2001;18:537–543. doi: 10.1023/a:1011070814530. [DOI] [PubMed] [Google Scholar]
- 21.Rose JE, Levin ED, Benowitz N. Saliva nicotine as index of plasma levels in nicotine skin patch users. Ther Drug Monit. 1993;15:431–435. doi: 10.1097/00007691-199310000-00012. [DOI] [PubMed] [Google Scholar]
- 22.Fagerström KO. Measuring degree of physcal dependence to tobacco smoking with references to individualisation of treatment. Addict Behav. 1978;3:235–241. doi: 10.1016/0306-4603(78)90024-2. [DOI] [PubMed] [Google Scholar]
- 23.Fagerström KO, Schneider N. Measuring nicotine dependence. A review of the Fagerström Tolerance Questionnaire. J Behav Med. 1989;12:159–182. doi: 10.1007/BF00846549. [DOI] [PubMed] [Google Scholar]
- 24.Gilbert DD. Chemical analysis as validators in smoking cessation programs. J Behav Med. 1993;16:295–307. doi: 10.1007/BF00844761. [DOI] [PubMed] [Google Scholar]
- 25.Dayneka NL, Garg V, Jusko WJ. Comparison of four basic models of indirect pharmacodynamic responses. J Pharmacokin Biopharm. 1993;21:457–478. doi: 10.1007/BF01061691. [DOI] [PMC free article] [PubMed] [Google Scholar]
- 26.Beal SL, Sheiner LB. NONMEM User's Guide. San Francisco, USA: University of California at San Francisco; 1992. [Google Scholar]
- 27.Sheiner LB, Beal SL. Some suggestions for measuring predictive performance. J Pharmacokin Biopharm. 1981;9:503–512. doi: 10.1007/BF01060893. [DOI] [PubMed] [Google Scholar]
- 28.Bozdogan H. Model selection and Akaike's information criterion (AIC): The general theory and its analytical extensions. Psychometrika. 1987;52:345–370. [Google Scholar]
- 29.Teneggi V, Squassante L, Iavarone L, Ziviani L, Milleri S, Berto D. VII World Conference on Clinical Pharmacology and Therapeutics. Florence: 4th Congress of. European Association for Pharmacology and Therapeutics; Withdrawal signs/symptoms and craving in a 72 hours period of enforced smoking cessation in healthy volunteers. July 15–20, 2000. [Google Scholar]


