


Abstract
Here, we report a single-molecule fluorescence resonance energy transfer (FRET) study of a Diels-Alderase (DAse) ribozyme, a 49-mer RNA with true catalytic properties. The DAse ribozyme was labeled with Cy3 and Cy5 as a FRET pair of dyes to observe intramolecular folding, which is a prerequisite for its recognition and turnover of two organic substrate molecules. FRET efficiency histograms and kinetic data were taken on a large number of surface-immobilized ribozyme molecules as a function of the Mg2+ concentration in the buffer solution. From these data, three separate states of the DAse ribozyme can be distinguished, the unfolded (U), intermediate (I) and folded (F) states. A thermodynamic model was developed to quantitatively analyze the dependence of these states on the Mg2+ concentration. The FRET data also provide information on structural properties. The I state shows a strongly cooperative compaction with increasing Mg2+ concentration that arises from association with several Mg2+ ions. This transition is followed by a second Mg2+-dependent cooperative transition to the F state. The observation of conformational heterogeneity and continuous fluctuations between the I and F states on the ∼100 ms timescale offers insight into the folding dynamics of this ribozyme.
INTRODUCTION
The long-time oversimplification of the role of RNA in life's molecular machinery as a mere carrier of protein sequence information has been steadily undermined over the past decades by the discovery of a growing array of catalytic RNAs. Indeed, RNA is the catalyst in key reactions that are of fundamental importance to life, including translation and splicing. Most natural ribozymes are engaged in RNA–phosphodiester chemistry as part of a self-modification reaction. Consequently, they are restricted to single turnover and thus are not true catalysts. The only two confirmed truly catalytic RNAs found in nature reside in RNase P and the ribosome, where they catalyze RNA splicing and peptide synthesis, respectively (1–3). Catalysis of a wide range of chemical reactions by RNA is also known from artificial ribozymes, (4), which may find application in biotechnology and medicine. In recent years, the recognition of the intriguing properties of catalytic RNA has aroused an enormous interest in biophysical studies that aim to understand the mechanistic relationships between RNA structure, folding and function.
To this end, we have chosen a small catalytic RNA called Diels-Alderase (DAse) as a model system (5). This artificial ribozyme displays the remarkable property of true, multiple-turnover catalysis with two non-RNA substrates (6,7), unlike most other ribozymes that accelerate single turnover self-modification reactions (4). The DAse catalyzes a carbon–carbon bond forming reaction between an anthracene diene and a maleimide dienophile with remarkable stereoselectivity. Its minimized version is a 49-mer that adopts a secondary fold composed of three helical elements, a central asymmetric bubble containing invariant UGCCA and AAUACU segments, and a 5′-terminal GGAG sequence (Figure 1a) (5,8). The X-ray structure was recently solved (9); it revealed a nested pseudoknot architecture (Figure 1b) and a λ-shaped overall topology (Figure 1c). The investigation of this ribozyme's kinetics, reaction mechanism and folding by conventional chemical and biochemical methods (5–9) revealed complex relationships and suggested the existence of various conformational forms of this RNA molecule. In particular, it became apparent that the complex mutual influences of substrate binding, Mg2+ ion binding, folding and ultimately catalysis cannot be easily deconvoluted. This situation prompted us to initiate detailed studies at the fundamental level of folding in the least complex system, i.e. the 49-mer, to establish a foundation that would allow extension to the catalytic mechanism in later stages.
Figure 1.

Secondary and tertiary structures of 49-mer Diels-Alderase ribozyme. (a) Secondary fold with the different elements in different colors. The dotted lines indicate Watson–Crick interactions in the folded tertiary structure. Positions 6, 11 and 20 were tried for attachment of Cy3 (green arrows), whereas positions 30, 33 and 42 were used for Cy5. All nine derivatives were tested for changes in FRET efficiency between 0 and 40 mM Mg2+. (b) Tertiary fold of the labeled derivative 6Cy3-42Cy5, which showed the most pronounced changes in FRET efficiency. (c) 3D structure of Diels-Alderase; the length of the edges are indicated. The attachment sites of the dyes (at C5 atoms of uridine residues) are marked by colored spheres.
Though experimentally challenging, we have chosen single-molecule Förster (or fluorescence) resonance energy transfer (FRET) technique to analyze conformational heterogeneity and dynamics of this artificial ribozyme. It allows conformational motions of individual molecules to be analyzed in real time and has found widespread application in the RNA field in recent years (10). Previous studies were performed on much larger ribozyme constructs (11), whereas the system studied here is comparatively small. On this occasion, we have introduced several technical novelties to the field, including FRET spectroscopy of a small RNA molecule in which both dyes are covalently linked to the same strand, rather than being associated by hybridization, which is a prerequisite for studying reversible folding–unfolding transitions on the same RNA molecule. Moreover, a combinatorial approach was also introduced to explore potential attachments sites for the dyes.
Our results show that the DAse ribozyme possesses three structurally different states that are distinguishable by their FRET efficiency distributions, the unfolded (U), intermediate (I) and folded (F) states. Mg2+ titration allowed us to measure changes in their equilibrium populations and to observe the collapse of the intermediate state. Both effects were described with a thermodynamic model, revealing how the F state is stabilized by successive binding of Mg2+ ions. We have also observed continuous fluctuations between the I and F states on the ∼100 ms timescale. These studies give unprecedented insight into the conformational energy landscape of a small RNA molecule, which governs structure, dynamics and the intriguing catalytic function of this remarkable ribozyme molecule.
MATERIALS AND METHODS
General RNA procedures
Chemicals were purchased from Sigma Aldrich (Taufkirchen, Germany) or Acros (Geel, Belgium) and used as received. Enzymes (T4 polynucleotide kinase (T4-PNK), T4-DNA ligase and DNase I) were purchased from Fermentas Life Sciences (St. Leon-Rot, Germany). Ribozyme fragments were derived from two RNA sequences, a 27-mer 5′-GGA GCU CGC UUC GGC GAG GUC GUG CCA-3′ and a 22-mer 5′-GCU CUU CGG AGC AAU ACU CGA C-biotin-3′ by selective substitution of the underlined uridines with 5-[3-[(6-aminohexyl)amino]-3-oxo-1-propenyl]-2′-deoxy-uridine and postsynthetic derivatization of the primary amino groups using NHS-esters of Cy3 and Cy5. All dye-labeled RNA fragments, unlabeled 22-mer RNA and 49-mer DNA splint molecule (sequence: 5′-GTC GAG TAT TGC TCC GAA GAG CTG GCA CGA CCT CGC CGA AGC GAG CTC C-3′) were obtained from IBA (Göttingen, Germany) as 100 µM stock solutions. Standard kinase ligation (KL) buffer containing 50 mM Tris-HCl (pH 7.4) and 10 mM MgCl2 and standard Diels-Alder (DA) buffer (300 mM NaCl and 30 mM Tris-HCl, pH 7.4) were prepared as 5× stock solutions and diluted as required. RNA concentrations were measured in 2 µl sample volumes on a NanoDrop ND-1000 spectrophotometer (Peqlab Biotechnologie GmbH, Erlangen, Germany) using the theoretical extinction coefficient of the 49-mer Diels-Alderase RNA sequence, ε260 = 453 600 M−1 cm−1 (12).
Preparation of dye-labeled constructs
Double-labeled ribozyme constructs were synthesized on the 1-nmol scale essentially as described by Kurschat et al. (13). Enzymatic RNA modifications were performed in 1× KL buffer containing both ATP and DTT at final concentration of 5 mM each. Dye-labeled 3′-RNA fragments were phosphorylated at 37°C for 30 min using 150 units of T4-PNK in 100 µl reaction volume. The T4-PNK was inactivated by subsequent heating to 75°C for 5 min. The corresponding dye-labeled 5′-RNA fragment was added together with the complementary splint DNA to final concentrations of 2.2 µM each, heated (2 min at 75°C) and cooled to room temperature for 20 min. Ligation was done using 102 units/μl of T4-DNA ligase at 20°C for 15 h. Splint digestion was preformed by adding 5 units of DNase I, incubating for 60 min at 30°C, quenching the reaction by addition of dye-free loading buffer (90% formamide, 1× TBE) and re-heating for 2 min at 75°C. Constructs were purified by denaturing PAGE (20%), excised, eluted and precipitated using standard procedures. To minimize bleaching of the dyes, preparation of the dye-labeled construct 6Cy3-42Cy5 (Cy3 and Cy5 at positions 6 and 42, respectively), which was investigated in detail in this work, was carried out in the dark and under oxygen-free conditions. This procedure ensured that 90% of the RNA molecules contained a functional pair of dye labels. All solutions were thoroughly degassed and subsequently purged with argon. Enzymatic reactions and subsequent PAGE purification steps were performed in a glove bag under an inert gas atmosphere in solutions always containing 10 mM DTT. Ligation yields were determined by statistical incorporation of [γ-32P]-ATP (Amersham Biosciences) in the phosphorylation reaction. Direct comparison of band intensities with the 49-mer wild-type ribozyme standard gave ligation yields in the range of 43–46%. Products were excised and isolated with final yields between 26 and 31%.
Determination of catalytic activity by HPLC
Ribozyme activity was measured as described by Stuhlmann and Jäschke (7) on a total reaction scale of 70 µl, using 100 µM 9-hydroxymethyl anthracene (Acros) as diene, 500 µM N-pentyl maleimide as dienophile and 7 µM of the respective ribozyme construct in 1× DA buffer and 10% EtOH. The reaction was stopped after 30 min by mixing the solution with 20 µl quenching buffer, containing 0.1 M β-mercaptoethanol in MeCN/H2O (1:1). Background reactions were performed by omitting the ribozyme. Reversed phase HPLC assays for product isolation were conducted on a Luna RP-18 column (5 μm, 100 Å, 250 × 4.6 mm2) from Phenomenex (Aschaffenburg, Germany), mounted on an Agilent 1100 HPLC system (Agilent Technologies, Palo Alto, CA, USA) equipped with a UV diode array and fluorescence detector. The Diels-Alder product was synthesized by refluxing 769 mg (3.7 mmol) of the diene and 618 mg (3.7 mmol) of the dienophile in 20 ml benzene for 20 h. The precipitate was isolated, washed with hexane and dried at 50°C. The product was weighed and the chromatograms of ten different amounts, ranging from 0.1 to 8.0 mmol, obtained by elution in isocratic mode (MeCN:H2O 52:48) at 25°C oven temperature and 1.0 ml/min flow rate, were used for calibration. A calibration curve was obtained by plotting peak areas of the product at 19.3 min (210 nm) against the injected concentrations. The product content of RNA-catalyzed Diels-Alder reaction mixtures (100 µl) was determined by injection onto the HPLC column and conversion of the resulting product peak areas into molar amounts. The amount of Diels-Alder product formed in the presence of 7 µM of the dye-labeled derivative 6Cy3-42Cy5 after 30 min was ∼25% of that produced by the unmodified ribozyme.
Surface immobilization
Two untreated glass coverslips (24 × 32 mm2 and 20 × 20 mm2, Menzel, Braunschweig, Germany) were cleaned by brief combustion of contaminants in a flame followed by rinsing with water (14). The coverslips were glued together by means of two pieces of double-sided adhesive tape, leaving a 2-mm wide channel in the middle. To obtain a sparse coverage of the coverslip with DAse ribozyme molecules, the channel was first flushed with 1-mg/ml solution of biotinylated BSA in 100-mM phosphate buffered saline (PBS), pH 7.4, then with a streptavidin solution (10 μg/ml, in PBS), and finally, with a DA buffer solution containing biotinylated ribozyme (∼100 pM). Each solution was kept in the channel for 10 min. Finally, the channel was flushed with DA buffer to remove all unbound molecules. Prior to immobilization, the ribozyme solution was heated to 60°C for 3 min and then slowly cooled to room temperature. To vary the concentration of Mg2+ ions, the channel was flushed with a solution prepared from 5× DA buffer, 1 M MgCl2 and water in the appropriate proportions. An enzymatic oxygen scavenging system (0.1 mg/ml glucose oxidase, 0.02 mg/ml catalase, 10% (w/w) glucose) (15) and 2 mM of Trolox as a triplet quencher (16) was employed to extend the observation time. Measurements were started after waiting 2−3 min for equilibration.
Single-molecule fluorescence emission from immobilized molecules was measured by using a home-built laser scanning confocal microscope with two-channel detection (17). All experiments were carried out at room temperature. The Cy3 dye was excited with the green 514.5 nm line of an Ar+/Kr+-ion laser (modified model 164, Spectra-Physics, Mountain View, CA, USA); direct excitation of the Cy5 dye was provided by the red 633 nm line of a He-Ne laser. The emission was collected through a water immersion objective (UPlan-Apo 60×/1.20 w, Olympus, Hamburg, Germany) and split into two channels using a beam splitter at 640 nm (HQ640DCXR, AHF, Tübingen, Germany). After passing through separate filters optimized for donor (HQ582/50, AHF) and acceptor (emitter Cy3/Cy5, AHF) emission, the light was imaged separately onto avalanche photodiodes. Thereby, light between 555 and 610 nm was detected in the ‘green channel’, and between 650 and 750 nm in the ‘red channel’. By using a piezoelectric stage scanner (model P-731.20, Physik Instrumente, Waldbronn, Germany), areas of 30 × 30 μm2 were imaged continuously at a resolution of 128 × 128 pixels, with 5 ms dwell time for each pixel, until the emission from 500 to 1000 single molecules was collected. The same areas were first scanned with green and subsequently with red laser excitation, so that only those molecules that contained a functional pair of labels were included in the subsequent FRET efficiency analysis. Measurements were carried out at different Mg2+ concentrations between 0 and 100 mM. For each Mg2+ concentration, a freshly prepared sample was taken to avoid adverse effects on the sample during several hours of data acquisition at room temperature. To measure time traces of the fluorescence emission, molecules were selected automatically from the images using red excitation to ensure that a functional acceptor was present and moved into the focus. Then, the fluorescence intensity was excited with green light and recorded with 1 ms time resolution until photobleaching of donor and acceptor occurred. In the analysis of apparent rate coefficients, only those time traces were included that showed single-step bleaching.
Single-molecule fluorescence data analysis
Images or time traces of surface-immobilized DAse molecules were analyzed in a semi-automatic way using our own software written in MATLAB 6.5 (MathWorks, Natick, MA, USA). FRET efficiency values, E, were calculated for individual molecules as
| 1 |
where IA and ID are the fluorescence intensities emitted by acceptor and donor, respectively, corrected for background and cross talk, and γ is an experimental parameter that accounts for the differences in the detection efficiencies of the two channels and quantum yields of the dyes. From single-molecule time traces, the background, cross talk and γ factor were extracted individually by analyzing the changes following photobleaching of acceptor and donor. Average values of the cross-talk and γ factor were determined experimentally from several hundred time traces as (7 ± 2)% and 1.0 ± 0.4, respectively. These two quantities were taken to calculate FRET efficiency values of single-molecule spots from scan images by integrating photon counts in boxes of 3 × 3 pixels; the background was determined locally by averaging over a two-pixel wide frame around the box of each spot.
EXPERIMENTAL RESULTS
Design of FRET-pair-labeled constructs for single-molecule studies
To be able to study RNA structural heterogeneity and dynamics by single-molecule FRET, different conformations have to be clearly resolved on the basis of their FRET efficiency, E. By judicious choice of attachment sites for the dyes, as many as four to five species may be distinguishable (11). The inverse sixth-power distance dependence of E is steepest close to the Förster radius, R0, which is in the range 50–70 Å for FRET pairs commonly used for single-molecule studies. Consequently, the two dyes should be separated by a distance within ∼20 Å of R0. The small size of the DAse ribozyme leaves only a few options for dye attachment, as the X-ray structure reveals a surprisingly compact, λ-shaped structure with edges of ∼64, 50 and 44 Å (Figure 1c) (9). Previous single-molecule FRET studies were performed on larger RNAs, in which donor and acceptor dyes resided in different parts of an RNA complex assembled by hybridization of several RNA strands (14,15,18–20). From the chemist's point of view, such constructs do not truly represent single molecules, signifying an uninterrupted chain of covalent bonds between both dyes. More important, however, is the fact that that the covalent linkage is essential to be able to observe multiple unfolding–refolding transitions. To achieve FRET-pair labeling of a single chain, a new synthesis strategy was required.
We developed a combinatorial approach to synthesize a number of derivatives of the 49-mer DAse ribozyme (Figure 1a) to be screened for suitability in FRET experiments. Three variants of a 27-mer fragment corresponding to the 5′-end of the ribozyme were synthesized, in which different uridines were substituted with deoxyuridine–Cy3 conjugates (green arrows in Figure 1a). Likewise, three variants of a 22-mer fragment corresponding to the 3′-end were synthesized, with Cy5 labels incorporated at three different positions (red arrows). All 3′-fragments contained a biotin at their 3′-end to enable surface immobilization by means of a streptavidin–biotin linkage. Using permutations of the six fragments in splint ligation reactions with a full-length complementary DNA as a template (13), nine full-length ribozymes were generated, each of them containing both labels.
RNA folding depends sensitively on the concentration of Mg2+ ions, and therefore, a marked change in FRET efficiency E upon addition of Mg2+ ions indicates that the RNA molecule is suitable for FRET measurements of the resulting structural changes. Of the various constructs that were prepared, the ligation product with the dyes at positions 6 (Cy3) and 42 (Cy5, Figure 1b) displayed the greatest changes of E in response to varying Mg2+ concentration, and was therefore selected for detailed analysis. Figure 1c shows the X-ray structure of the DAse ribozyme with the attachment sites of the dyes (carbon atom C5 of the respective uridine) indicated by green (Cy3) and red (Cy5) spheres. To examine if the attached dyes are free to rotate or stick to the RNA, we have performed anisotropy measurements, which are described in detail in Supplementary Data. These data indicate that orientational averaging of the donor and acceptor transition dipoles is incomplete on the nanosecond timescale. However, averaging is complete and, thus, dye rotation is fast on the millisecond timescale of our single-molecule FRET efficiency measurements.
FRET histogram analysis of DAse conformations
To study conformational heterogeneity of FRET-pair-labeled DAse ribozyme, a FRET analysis was performed by imaging a few hundred individual, surface-immobilized molecules for each of nine different Mg2+ concentrations ranging from 0 to 100 mM. FRET values were calculated for each molecule and grouped in intervals of 0.04 in FRET efficiency histograms, as shown in Figure 2. The data suggest the presence of three subpopulations, corresponding to three different structural states: folded molecules (state F), with 〈EF〉 ∼ 0.9, molecules in a more expanded, intermediate conformation (state I), with 〈EI〉 ∼ 0.7 and unfolded molecules (state U), with 〈EU〉 ∼ 0. In the absence of Mg2+, the I state dominates, and small fractions are found in states U and F. With increasing concentration of Mg2+ ions, a continuous transition from I to F is clearly evident; a concomitant decrease of the minor U population is less obvious. Remarkably, even at the highest Mg2+ concentration studied, there is still a significant fraction of DAse ribozyme molecules that are not in the folded state F. After the measurement at 40 mM Mg2+, the sample was flushed with buffer without Mg2+ and imaged again (within 600 s after taking the 40 mM data). The resultant FRET distribution, plotted in Figure 2 (bottom histogram), is essentially identical to the initial FRET distribution, proving the reversible character of the folding transition.
Figure 2.

Histograms of FRET efficiency values, E, taken from single molecules exposed to buffer solutions with 0, 0.625, 1.25, 2.5, 5, 10, 20, 40 and 100 mM Mg2+ concentration. The lowest panel shows the histogram for molecules exposed to 0 mM Mg2+ immediately after exposure to 40 mM Mg2+. Three subpopulations, denoted as U (〈EU〉 ∼ 0), I (〈EI〉 ∼ 0.7) and F (〈EF〉 ∼ 0.9), can be distinguished. Dotted, dashed and solid thick lines represent fit results using model distributions for the U, I and F states, respectively. The solid line represents the sum over the three distributions.
To quantify the change of the fractional populations with Mg2+ concentration, we fitted the FRET efficiency distributions of the three conformations by continuous functions, log-normal functions for the U and F states, and a standard Gaussian for the intermediate state (21,22). The I and F distributions in Figure 2 overlap significantly, which precludes a strict separation based on the FRET efficiency values alone. To separate the two distributions, it is reasonable to take the shape of the FRET efficiency distribution of the F state as invariant with respect to Mg2+ ion concentration. After all, F is a priori the structurally best defined state, and moreover, there was no indication that the distribution parameter may change. Hence, its mean, 〈EF〉, and width (full width at half maximum, FWHMF) were determined from a fit of the FRET distribution at 40 mM Mg2+, where the F state dominates, yielding 0.93 ± 0.01 and 0.12 ± 0.01, respectively. Likewise, the corresponding parameters of the small U state distribution, 〈EU〉 = 0.06 ± 0.01 and FWHMU = 0.18 ± 0.02, were determined from fitting the 0 mM Mg2+ histogram. For fitting the data at intermediate Mg2+ concentrations, the means and widths of the U and F states were fixed to obtain parameters of the I distribution in the most reliable way. The resulting individual and overall distributions are shown in Figure 2 as lines.
A plot of the relative populations of the U, I and F states as a function of the Mg2+ ion concentration (Figure 3a) reveals a pronounced increase in the folded fraction with Mg2+ at the expense of the two other states, U and I. The I state distribution exhibits an interesting behavior with increasing Mg2+ concentration (Figure 3b); its mean, 〈EI〉, shifts to higher values, indicating a compaction of the overall ensemble of conformational substates. Concomitantly, its width increases as well, suggesting that this population becomes more heterogeneous. In Table 1, the average FRET efficiency 〈E〉, the peak of the distribution, Epeak, and the FRET efficiency values at the two half-maximal points are compiled for the U, I (for both 0 and 40 mM Mg2+) and F distributions.
Figure 3.

(a) Mg2+ dependence of the fractional populations of U, I and F. Lines represent the fit according to the model discussed in the text. (b) The mean and width of the Gaussian representing the I state distribution are shown as a function of [Mg2+]. The dashed line gives the (scaled) dependence of the fraction F in panel (a), the solid lines are fits with the Hill equation (to guide the eye).
Table 1.
FRET distribution parameters and corresponding inter-dye distances of DAse conformations U, I and F
| 〈E 〉 | R(〈E 〉)/Å | Ra(〈E 〉)/Å | |
|---|---|---|---|
| (Epeak) | R(Epeak)/Å | Ra(Epeak)/Å | |
| (Förster) | (Gaussian chain) | ||
| U | 0.06 | 84 | 151 |
 |
 |
 |
|
| I (0 mM) | 0.68 | 47 | 40 |
 |
 |
 |
|
| I (40 mM) | 0.81 | 42 | 31 |
 |
 |
 |
|
| F | 0.93 | 34 | 20 |
 |
 |
 |
The average values of the observed FRET efficiencies and calculated inter-dye distances are shown in boldface, whereas the peak values and corresponding right and left values at half maximum (displayed as sub- and superscripts) are shown in normal font.
In addition, we studied the Mg2+ dependence of E for individual molecules by imaging the same molecules multiple times in different buffer solutions. The first scan was taken with 0 mM Mg2+, the second with 40 mM, and each subsequent scan with a Mg2+ concentration that was a factor two lower than the previous one, with 1500 s between successive scans. Figure 4 shows four examples. A pronounced decrease in FRET efficiency upon Mg2+ titration was observed for every molecule studied. Remarkably, each molecule exhibits its individual titration behavior, which may be influenced by interactions with its local environment.
Figure 4.

Representative examples from the Mg2+ titration of individual molecules. Filled circles show the FRET efficiency at 0 mM Mg2+ concentration immediately after immobilization. Afterwards, measurements were performed, starting with 40 mM Mg2+ and decreasing it by a factor of two between successive measurements. Solid lines are fits with the Hill equation.
Single-molecule folding kinetics
By using conventional fluorescence correlation spectroscopy (FCS) on solution samples (23–25), we were unable to observe structural dynamics on submillisecond timescales (data not shown). To investigate motions on longer timescales, we measured time traces of the donor and acceptor emission of single, immobilized molecules. Figure 5a shows examples of FRET trajectories calculated from these data, measured at 2.5, 5 and 10 mM Mg2+ and plotted with 50-ms binning. Also shown (on the right-hand side) are histograms that represent the relative probabilities with which the different E values occur in the trace. The FRET fluctuations are much larger than expected from pure photon statistics. They arise from anticorrelated intensity variations of donor and acceptor due to conformational motions that affect the FRET coupling. Most transitions occur in the range between 0.5 and 1.0, indicating incessant switching between the I and F states. In addition, there are infrequent, brief transitions to E ∼ 0, which may represent fluctuations to the U state. We note that the traces in Figure 5a have been selected for minimal transitions to U so that simple one-step cross-correlation functions result (vide infra), but transitions to U are present in many traces at all concentrations and are more often encountered at low Mg2+ concentration (data not shown). The molecule studied at 2.5 mM Mg2+ is seen in the I state (E ∼ 0.6) for most of the time, from which it makes brief sojourns to the F state (E ∼ 0.9). For the molecule measured at 10 mM Mg2+, the behavior is just the opposite. It resides preferentially in the high-FRET, folded state and occasionally visits the I state. At 5 mM, i.e. near the midpoint of the Mg2+ titration, we observe roughly equal residence probabilities in the I and F states. As the residence times in I and F are short and the FRET distribution of the I state is broad and partially overlaps with one of the F state, the dynamics of the transitions between these states cannot be determined by simple analysis of the residence times in the two states. Rather, we have to resort to correlation analysis. The cross-correlation function, CC, is defined as
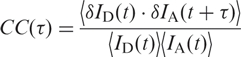 |
2 |
Here, δID = ID − 〈ID〉 and δIA = IA − 〈IA〉 represent the deviations of the donor and acceptor intensities from their time average, which is denoted by angular brackets, and t and τ are the real and correlation time, respectively. Thus, the cross-correlation function quantifies the probability to detect an acceptor photon at some time (t + τ), given that a donor photon was registered at time t. FRET causes an anticorrelated fluorescence emission by the donor and acceptor, and thus, CC(τ) should be negative. This is indeed the case for the donor and acceptor time trajectories on which the FRET traces in Figure 5a are based, as shown by the corresponding cross-correlation functions plotted in Figure 5b. For more than 30 traces longer than 1 s at each of five different Mg2+ concentrations, we have calculated CC(τ) from those parts of the traces that did not contain transitions to the U state. Afterwards, these curves were fitted with single exponential functions to obtain the apparent fluctuation rate coefficients, kapp. The results are shown in Figure 6a in the form of histograms on a (logarithmic) scale of the rate coefficients. Rather broad distributions can be seen, especially for the midpoint concentration of ∼5 mM. These distributions most likely reflect heterogeneous surroundings that endow each molecule with its specific rate coefficient. From these distributions, the means (first moment) and widths (second central moment) were calculated for each concentration. The dependence of the observed mean rate coefficients as a function of Mg2+ concentration, plotted in Figure 6b, produces a ‘chevron’ shape, as was also observed in the Mg2+-dependent folding of large ribozymes (26).
Figure 5.

Conformational fluctuations between intermediate and folded states. (a) FRET trajectories of single molecules measured at Mg2+ concentrations of 2.5, 5 and 10 mM and the corresponding histograms of FRET efficiencies, obtained with 50-ms dwell time binning. (b) Cross-correlation functions calculated from the FRET traces in panel (a).
Figure 6.

Mg2+ concentration dependence of the apparent rate coefficients. (a) Histograms of apparent rate coefficients, binned on a logarithmic scale and shown for Mg2+ ion concentrations of 0.625, 2.5, 5, 10 and 40 mM. (b) Means (open circles) and widths (error bars) of the distributions in panel (a) are shown as a function of Mg2+ concentration. The solid black line represents a curve calculated with the model explained in the text. The gray lines represent the fractional contributions of kf and ku to kapp.
DATA ANALYSIS AND DISCUSSION
Mg2+ ion dependence of DAse ribozyme conformations
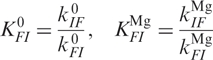
To analyze the Mg2+ dependence of the ribozyme conformations in Figure 3a, we have employed the thermodynamic scheme depicted in Figure 7a, which involves altogether six states, with U0, I0 and F0 representing the Mg2+-free states, and UMg, IMg and FMg the Mg2+-bound states. Since we can only distinguish the different conformations U, I, and F from the FRET data but are insensitive to Mg2+ binding, the measured populations correspond to the sums of the ion-free and ion-bound states, [U0] + [UMg], [I0] + [IMg] and [F0] + [FMg]. The large number of parameters governing the equilibrium between the six states requires simplifications. The ratio between populations U and I and thus their free energy difference, ▵GUI, remained constant within the error upon changing Mg2+. This treatment effectively reduces the scheme in Figure 7a to a four-state model (27,28), with the fractional populations governed by the four equilibrium coefficients
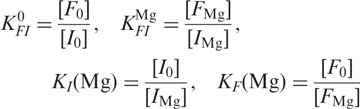 |
3 |
For the latter two equilibria, we assume that the free energy difference between Mg2+-bound and unbound states, ΔG(Mg), changes with the Mg2+ concentration according to a cooperative binding model with n ligand-binding sites,
| 4 |
where R is the gas constant; T is the absolute temperature. Details of the analysis, including the free energy differences between the four states, are given in Supplementary Data. The lines in Figure 3a represent the fit results of this model to our single-molecule data. In this model, the shape of the I ↔ F transition follows the form of a Hill equation,
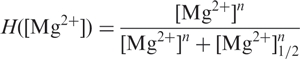 |
5 |
with midpoint concentration, [Mg2+]1/2, and cooperativity parameter (or Hill coefficient), n. The Hill coefficient, for which the fit yielded a value of 1.8 ± 0.1, is usually associated with the number of binding sites occupied in a cooperative transition (29). In the X-ray structure of the DAse ribozyme, altogether eight Mg2+ ions have been identified (9), two of which mediate contacts in the crystal lattice. From the remaining six intramolecular Mg2+ ions, Mg1 and Mg2 were found to be crucially involved in the packing of helices I and II onto each other by forming multiple direct and water-mediated bonds. This observation is in good agreement with Mg2+ ion titrations by imino-proton NMR spectroscopy, which monitored the formation of the pseudoknot base pairs G1C25, G2C24, A3U45 and G4C44 and revealed that two Mg2+ ions are required for complete formation of these base pairs (9). Therefore, the Hill coefficient of ∼2 from the single-molecule FRET analysis of the I ↔ F equilibrium correlates well with the finding that two Mg2+ ions are crucial for proper DAse ribozyme folding.
Figure 7.

Thermodynamic scheme describing the Mg2+-dependent folding of DAse ribozyme. (a) Scheme involving three Mg-free states, denoted as U0, I0 and F0, and three Mg-bound states, denoted as UMg, IMg and FMg. Folding is induced by Mg2+-dependent equilibrium coefficients KI and KF. (b) Free energy diagram of the observed populations of U (U0 + UMg), I (I0 + IMg) and F (F0 + FMg) is shown for 0 and 40 mM Mg2+.
The midpoint of the Mg2+-dependent transition is at [Mg2+]1/2 = 6.1 ± 0.1 mM, which is in the range of Mg2+ concentrations found for folding transitions in other ribozyme molecules of similar size, for example, variants of the hairpin (30) or hammerhead (31) ribozyme. To ensure that the folding transition is not markedly affected by surface immobilization, we also performed bulk FRET Mg2+ titration experiments on DAse ribozyme molecules in buffer and in buffer-containing streptavidin. These data are presented in Supplementary Data. In solution, [Mg2+]1/2 was a factor of ∼2 smaller, which may be due to RNA–surface interactions or local Mg2+concentration changes. The Hill coefficient, however, remained the same. These findings are in line with our earlier results that DAse molecules retain their 3D fold upon immobilization on a surface via their 3′ end, as shown by their high catalytic activity (32).
Figure 7b depicts the energetics of the three populations that are distinguishable from FRET histogram analysis. The unfolded conformation is 4.4 kJ/mol higher in free energy than the intermediate one, independent of Mg2+ ion concentration. The overall folded conformation, (F0 + FMg), is 5.8 kJ/mol above (I0 + IMg) in the absence of Mg2+, but is lower by 1.5 kJ/mol at 40 mM Mg2+. Therefore, Mg2+ binding preferentially lowers the free energy of the overall folded state by 7.3 kJ/mol.
Structural properties of the DAse ribozyme conformations
FRET measurements have attracted a great deal of attention because a simple equation,
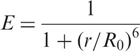 |
6 |
relates a spectroscopic observable, the FRET efficiency E, to a structural parameter, the inter-dye distance r. This analysis, however, applies only to cases where both r and the Förster radius, R0, of the dye pair are constant during the measurement, (and R0 is well known for the system under study). For well-ordered native states of biomolecules, a constant r may be a viable approximation, at least, if the dye tethers are not too long. Unfolded biopolymers cause r to continuously change with time as they fluctuate incessantly among many thermally accessible conformations. The Förster radius R0 depends on the dipolar coupling and thus on the orientation factor, κ2, which can vary between 0 and 4 with rotational motion of the dyes. Typically, it is assumed that complete orientational averaging of the transition dipoles occurs within the lifetime of the donor's excited state, τ, so that κ2 = 2/3. However, dyes attached to biomolecules frequently display significant anisotropies, indicating a lack of orientational averaging. In general, if both dye and RNA chain dynamics are slower than τ but faster than the time resolution Δt of the experiment, as shown by the anisotropy experiments, one can only calculate an average FRET efficiency 〈E〉 over all possible dye-separations r and orientation factors κ2. Here we have used the Gaussian chain model to calculate the distance probability density for a fluctuating DAse ribozyme chain; details of these calculations are discussed in Supplementary Data. For the DAse ribozyme construct studied here, the total contour length, lc = 49 × 6.3 Å = 309 Å, using an empirically determined contour length for a single nucleotide (33). The persistence length, lp, of single-stranded RNA depends on the counterion concentration and is, under the conditions chosen here, 10–21 Å (33,34). As lp ≪ lc, the Gaussian chain approximation as valid, and indeed, calculations with the widely used worm-like chain (WLC) model (34) yielded essentially identical results. We note that such a general polymer model is rather simplistic, as the base-pairing tendency may induce fairly stable, residual structure and thus impede configurational averaging. In Table 1, we have included the conversion of the FRET efficiency distribution parameters to the inter-dye distance r resulting from the standard Förster relation and the average inter-dye distance Ra from the Gaussian chain model. Both quantities were scaled with the Förster radius R0 = 53 Å for an orientationally averaged Cy3–Cy5 dye pair (35,36). Comparison of the two sets of inter-dye distances indicates that great caution is advised when attempting to determine absolute distances from FRET experiments, especially when dealing with disordered polymers. Fortunately, this is not a key issue in the present study.
The U state distribution represents a population with low FRET values, which can also result from bleaching or transitions into long-lived dark states of the acceptor dye (37,38). However, it is highly improbable that such molecules contribute because we always scanned first with green and then with red laser excitation to ensure that only molecules with a functional acceptor dye were included in the analysis. Moreover, the functional dependence of the U state population on Mg2+ suggests that these molecules can change to conformations I or F and are in this sense well behaved. The distribution peaks near E = 0, which implies that the error in the inter-dye distance is rather large. For Epeak = 0.026, we obtain an r = 97 Å from the Förster relation, and even twice this value for Ra from the Gaussian chain model. Regardless of the chosen relation, the U state is clearly much expanded, and thus should behave closest to a simple polymer chain. For the Gaussian chain model, the average end-to-end distance, Re, is given by (39)
| 7 |
With lp = 21 Å for single-stranded RNA in 300 mM NaCl and no Mg2+ (34), we thus obtain Re = 114 Å. The dyes are attached to positions 6 and 42, and the linkers correspond to ∼1.5 nt each, so that the contour length between donor and acceptor,  , is 39 × 6.3 Å = 246 Å. We can rescale the end-to-end distance, Re, of the entire chain to obtain the average inter-dye distance,
 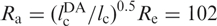 Å. This estimation suggests that there is little residual structure for those molecules with FRET efficiencies around Epeak. However, the distribution is broad and extends up to ∼0.3, corresponding to an inter-dye distance of ∼60 Å, indicating that the U ensemble may also contain RNA molecules with some secondary structure.
The FRET efficiency in the intermediate state I in the absence of Mg2+ ions corresponds to 47 and 39 Å according to the Förster and Gaussian chain-based relations. Given that the covalent connection between the two dyes  Å, the I state is considerably condensed at 0 mM Mg2+, and the distance decreases further with the addition of Mg2+ ions. We have converted the FRET efficiency distribution parameters of the I state (Figure 3b) into distances by using the Gaussian chain model. The resulting average distance and FWHM parameters are plotted in Figure 8 as a function of Mg2+ concentration. The average distance decreases by ∼25% whereas the width of the distance distribution essentially doubles. Inspection of the FRET histograms (Figure 2) suggests that the pronounced increase in heterogeneity arises from the appearance of a significant fraction of compact, high-FRET conformations without a corresponding decrease of the less compact, low-FRET conformations.
Figure 8.

Mg2+ concentration dependence of the average inter-dye distance Ra (filled squares) and the width of the distance distribution (open squares) of the I state. Solid lines represent a global fit according to the Hill equation, yielding a midpoint Mg2+ concentration of (3.8 ± 0.5) mM and a cooperativity parameter n = 4.2 ± 0.8.
We performed a simultaneous fit with the Hill equation, Equation (5), to both mean and width of the FRET distance distribution of the I state, yielding [Mg2+]1/2 = (3.8 ± 0.5) mM and a cooperativity parameter n = 4.2 ± 0.8. The resulting curves are included as lines in Figure 8. The strongly cooperative decrease of the inter-dye distance with Mg2+ by several ångströms has a midpoint that is distinctly different from that of the I ↔ F equilibrium, as already seen from comparing the solid and dashed lines in the raw data in Figure 3b. We also note that a calculation with the Förster relation instead of the Gaussian chain only affects the absolute magnitudes but not the parameters of the Hill equation, as the distance dependence of E is close to linear in the intermediate range.
For the folded state, the very high 〈E〉 = 0.93 translates into inter-dye distances of 34 and 20 Å according to the Förster and Gaussian chain-based relations. Of course, for a structurally well-defined F state, a statistical polymer model is inappropriate. From the model based on the X-ray structure (9), both the distances between the C4′ ribose atoms on the backbone and the C5 atoms on the two modified uridine bases are 22 Å. The dye molecules are connected to the C5 positions via 16-atom flexible spacers, which allow them to fluctuate by ∼7 Å (estimate from the Gaussian chain) around the attachment points. Therefore, the obtained FRET distances support the assertion that the F state distribution observed in our experiments indeed corresponds to properly folded DAse ribozyme molecules.
The three states of the DAse ribozyme that can be distinguished from the FRET analysis are depicted schematically in Figure 9. In the absence of Mg2+ ions, most of the molecules are in the I state, with a compact structure stabilized by base pairing. If one assumes coplanar stacking of helices I and II, and also good stacking of the bases inside the bulge with an average axial next-neighbor distance of 3.6 Å, the axial distance between the two modified uridine bases equals ∼33 Å. Considering the additional radial displacement and the spacer lengths, our assignment of I to the sketched structure appears sensible. Only a minority of ribozyme molecules is observed in the U state, which has largely random coil with some possible secondary structure according to our FRET analysis. The transition I → U involves opening of helix II (Figure 9, in yellow), which is known to be less stable than helices I and III from lead probing experiments (8). These show an increased cleavage in this sequence range, indicative of better accessibility (less base pairing). Helices I and III have high predicted melting temperature values, and we thus would not have expected them to open. With increasing Mg2+ concentration, we observe a compaction of the intermediate state, with a midpoint at 3.8 mM. The transition to the folded state occurs a bit higher, at 6.1 mM. It is intriguing to note that the Hill coefficient for the collapse of the I state suggests that the DAse ribozyme picks up four Mg2+ ions in this transition, and then another two Mg2+ ions in the transition I → F, so that altogether six Mg2+ ions are incorporated, which agrees nicely with the findings from the X-ray structure analysis (9).
Figure 9.

Schematic depictions of structural properties of the DAse ribozyme for the observed states U, I and F.
Structural dynamics of DAse ribozyme conformations
The analysis of FRET histograms reveals conformational heterogeneity, but it is not a priori clear if this heterogeneity is static or dynamic. This distinction can only be made by studying the time dependence of FRET efficiencies. Knowledge of the structural dynamics is of key relevance, as most if not all biomolecular functional processes are associated with conformational motions (40). Indeed, a discussion of function that is based solely on the structure may lead to wrong conclusions.
The measurement of single-molecule FRET trajectories provides a powerful way to examine the structural dynamics under equilibrium conditions. As the data in Figure 5 indicate, the structure fluctuates permanently between the folded and intermediate states, and may even unfold completely on rare occasion. The direct observation of individual denatured molecules in the context of a full population is a novelty owing to our new labeling strategy. For a single DAse ribozyme molecule, the Mg2+ concentration governs the average time that it spends in the folded, intermediate and unfolded states. At high Mg2+ concentration, the molecule resides predominantly in the F state and unfolds only rarely. At lower Mg2+ concentration, the probability to be folded is decreased, as the DAse ribozyme spends more time in the I state. This unfolding and refolding happens with an average lifetime of 60 ms at 5 mM Mg2+. The small ribozyme of artificial sequence examined here thus shows folding properties similar to those found in larger RNAs of natural sequence. For example, folding of the catalytic domain of Bacillus subtilis RNase P occurs via several intermediate states within 1 s at 25°C (26). Even relatively small RNA molecules such as the natural form of the hairpin ribozyme (18) and the P4-P6 domain of the Tetrahymena group I ribozyme (41) form their tertiary structures within ∼300 and 150 ms, respectively. However, it was also demonstrated for the hairpin and hammerhead ribozymes that their minimal motifs required much longer folding and cleavage times as well as higher Mg2+ concentration than their natural forms (18,42). The folding time of the DAse ribozyme reported here is comparable to other ribozymes in their native form despite of the minimal form of the DAse ribozyme used. Large RNA molecules like a group II intron have been observed to encounter kinetic traps during folding, and it therefore may take them more than 30 s to fold into their native states (43).
The dependence of the transition rate coefficients on the concentration of Mg2+ ions (Figure 6b) can be analyzed with the thermodynamic scheme shown in Figure 7, again focusing on a four-state subscheme involving only states I and F. We introduce the rate coefficients  and
and  , for transitions between the Mg-free forms I0 → F0 and F0 → I0, respectively, and
  and
and  for transitions between Mg-bound forms IMg → FMg and FMg → IMg. These rate coefficients are connected to the equilibrium coefficients and by the relations
 |
8 |
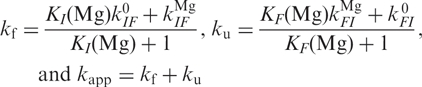
Following the approach by Kim et al. (14), we assume that Mg2+ ion binding and release occur faster than conformational changes. Conformational transitions can occur between the Mg-free forms I0 and F0 or the Mg-bound forms IMg and FMg. We can calculate the overall folding and unfolding rate coefficients, kf and ku, and the apparent rate coefficient, kapp, which can be measured by correlation analysis, using
 |
9 |
The limited kinetic data do not allow us to optimize all the parameters in a non-linear least-squares fit procedure. Instead, we have introduced the parameters obtained from the equilibrium model to simulate the Mg2+ dependence of kapp, and was adjusted to ∼40 s−1 force the simulated curve through the point at 40 mM. The two parameters and , which represent the asymptotic behavior of ku at high and kf at low Mg2+ concentrations, were set to zero because their contribution to kapp was negligible. The calculated curve, shown as the solid line in Figure 6b, describes the Mg2+ concentration of the experimental points very well.
While the dynamics of the DAse ribozyme is apparent from the kinetic data in Figure 5, there is also evidence of considerable static heterogeneity in the intermediate state I. In Figure 4, the DAse ribozyme molecules display individual Mg2+ titration curves, with markedly varying [Mg2+]1/2 values and FRET efficiency levels at low Mg2+ concentration. This result can be explained by heterogeneous I state conformations with very different properties. To measure a smooth Mg2+ dependence, the respective DAse ribozyme molecules must have maintained these substrates essentially during the entire time of the measurement. How much of this effect is intrinsic to the DAse ribozyme and how much can be attributed to surface interactions cannot be resolved here. However, the catalytic activity of immobilized DAse indicates that surface binding does not prevent the observation of correctly folded ribozyme molecules (32).
Because of the complexity of the investigated system, the observed folding steps cannot be directly correlated to catalytic activity. However, the fundamental folding dynamics reported here still have bearings on catalysis. They indeed reveal an important fact that had been overlooked so far and that offer explanations to poorly understood phenomena. One of the central and unusual features attributed to this ribozyme is the existence of a preformed catalytic pocket, initially inferred from chemical probing experiments (8), and then proven by the nearly identical crystal structures of this ribozyme in the unbound state and complexed with the reaction product (9). However, standard X-ray structure analysis is a static method and cannot reveal transient forms that appear with small probabilities (or not at all because of the crystalline environment). There are, however, two as yet unsolved problems that can now be explained on the basis of this single-molecule study: (1) In the X-ray structure, the tethered Diels-Alder reaction product was bound quantitatively in the unexpected ‘wrong’ orientation. To enter the pocket in this orientation, it must have squeezed through an opening that is, according to the X-ray structure, far too narrow (9). (2) It was recently demonstrated that, under certain conditions, the anthracene diene can enter the pocket from the ‘wrong’ side, through a small ‘back door’ opening, giving rise to an alternative stereochemical course of the reaction (44). Again, the dimensions of this orifice are too small for the substrate to gain access. Transient opening of the pseudoknot structure, however, temporarily destroys the catalytic pocket, removes the back and side walls, and may thereby permit access of substrates from and release of products to almost any direction. This dynamic scenario is similar to those inferred for ligand binding to internal active sites of proteins (40,45); it easily explains the unusual behavior of this ribozyme, and the stereochemical consequences of the approach to the catalytic center from different sides.
To date, the Diels-Alderase ribozyme is the only ribozyme that catalyzes small-molecule chemistry with multiple turnovers. All other members of this group are single-turnover ‘enzymes’ that only act on themselves or on substrates covalently tethered to them. The continuous breakdown and restoration of the catalytically competent structure observed in this single-molecule study may be a key difference in comparison with the other RNAs. After accelerating the chemical step, the catalytic center occasionally disintegrates, bound product dissociates, the catalyst reassembles, and can start again a new catalytic cycle. This dynamic scenario permits multiple turnovers, even in the case of product inhibition (7).
CONCLUSIONS
RNA folding in vitro is generally believed to start from a largely denatured, random coil state in the absence of counterions, proceeding to the formation of secondary structure in the presence of monovalent cations, and finally, in the presence of divalent cations, to the formation of more complex features of tertiary structure (46). In the present single-molecule FRET study, these three stages are represented by three different states, U, I and F that were characterized structurally and thermodynamically, in analogy to related work on medium-sized and large RNA molecules (11,20,31,47–54). However, because both dyes are located on the same RNA strand, no docking or undocking events between RNA strands interfere with the observation of truly intramolecular folding. Remarkably, we found a small yet noticeable portion of largely random-coil RNA even at high concentrations of monovalent cations, and also a large fraction of DAse ribozyme molecules in the intermediate state at high concentration of divalent cations. The folding process from I to F is usually described by a conformational search and formation of metal-ion-binding sites (53,55). Here we have observed a compaction of the I state with increasing Mg2+, with a very sharp transition (Hill coefficient ∼4.2) at 3.8 mM, and a subsequent folding at 6.1 mM with Hill coefficient ∼1.8. These findings are in excellent agreement with the X-ray structure by Serganov et al. (9), who showed that ∼6 Mg2+ ions participate in the formation of the native structure. The folding of the remarkably complex, double-pseudoknot structure of the DAse ribozyme from the I state proceeds slowly, on the ∼100-ms scale. Such slow opening and re-closing of an RNA structure has occasionally been addressed as ‘breathing’ in the literature (46), and may offer clues for the explanation of the otherwise poorly understood mechanism of multiple turnover catalysis by the DAse ribozyme.
Supplementary Material
ACKNOWLEDGEMENTS
Financial support from the Deutsche Forschungsgemeinschaft (DFG, grant SFB569 to G.U.N.) and the Fonds der Chemischen Industrie is gratefully acknowledged. A.J. acknowledges funding by the HFSPO and the DFG (JA 794/3); M.H. acknowledges funding by the DFG (HE 3397/3).
Conflict of interest statement. None declared.
REFERENCES
- 1.Fedor MJ, Williamson JR. The catalytic diversity of RNAs. Nat. Rev. Mol. Cell. Biol. 2005;6:399–412. doi: 10.1038/nrm1647. [DOI] [PubMed] [Google Scholar]
- 2.Lilley DMJ. Structure, folding and mechanisms of ribozymes. Curr. Opin. Struct. Biol. 2005;15:313–323. doi: 10.1016/j.sbi.2005.05.002. [DOI] [PubMed] [Google Scholar]
- 3.Steitz TA, Moore PB. RNA, the first macromolecular catalyst: the ribosome is a ribozyme. Trends Biochem. Sci. 2003;28:411–418. doi: 10.1016/S0968-0004(03)00169-5. [DOI] [PubMed] [Google Scholar]
- 4.Weigand BS, Zerressen A, Schlatterer JC, Helm M, Jschke A. In: The Aptamer Handbook. Klussmann S, editor. Weinheim: Wiley VCH; 2006. pp. 211–227. [Google Scholar]
- 5.Seelig B, Jäschke A. A small catalytic RNA motif with Diels-Alderase activity. Chem. Biol. 1999;6:167–176. doi: 10.1016/S1074-5521(99)89008-5. [DOI] [PubMed] [Google Scholar]
- 6.Seelig B, Keiper S, Stuhlmann F, Jäschke A. Enantioselective ribozyme catalysis of a bimolecular cycloaddition reaction. Angew. Chem. Int. Ed. Engl. 2000;39:4576–4579. [PubMed] [Google Scholar]
- 7.Stuhlmann F, Jäschke A. Characterization of an RNA active site: interactions between a Diels-Alderase ribozyme and its substrates and products. J. Am. Chem. Soc. 2002;124:3238–3244. doi: 10.1021/ja0167405. [DOI] [PubMed] [Google Scholar]
- 8.Keiper S, Bebenroth D, Seelig B, Westhof E, Jäschke A. Architecture of a Diels-Alderase ribozyme with a preformed catalytic pocket. Chem. Biol. 2004;11:1217–1227. doi: 10.1016/j.chembiol.2004.06.011. [DOI] [PubMed] [Google Scholar]
- 9.Serganov A, Keiper S, Malinina L, Tereshko V, Skripkin E, Höbartner C, Polonskaia A, Phan AT, Wombacher R, et al. Structural basis for Diels-Alder ribozyme-catalyzed carbon-carbon bond formation. Nat. Struct. Mol. Biol. 2005;12:218–224. doi: 10.1038/nsmb906. [DOI] [PMC free article] [PubMed] [Google Scholar]
- 10.Zhuang X. Single-molecule RNA science. Annu. Rev. Biophys. Biomol. Struct. 2005;34:399–414. doi: 10.1146/annurev.biophys.34.040204.144641. [DOI] [PubMed] [Google Scholar]
- 11.Russell R, Zhuang X, Babcock HP, Millett IS, Doniach S, Chu S, Herschlag D. Exploring the folding landscape of a structured RNA. Proc. Natl. Acad. Sci. U.S.A. 2002;99:155–160. doi: 10.1073/pnas.221593598. [DOI] [PMC free article] [PubMed] [Google Scholar]
- 12. http://www.ambion.com/techlib/misc/oligo_calculator.html.
- 13.Kurschat WC, Müller J, Wombacher R, Helm M. Optimizing splinted ligation of highly structured small RNAs. RNA. 2005;11:1909–1914. doi: 10.1261/rna.2170705. [DOI] [PMC free article] [PubMed] [Google Scholar]
- 14.Kim HD, Nienhaus GU, Ha T, Orr JW, Williamson JR, Chu S. Mg2+-dependent conformational change of RNA studied by fluorescence correlation and FRET on immobilized single molecules. Proc. Natl. Acad. Sci. U.S.A. 2002;99:4284–4289. doi: 10.1073/pnas.032077799. [DOI] [PMC free article] [PubMed] [Google Scholar]
- 15.Nahas MK, Wilson TJ, Hohng S, Jarvie K, Lilley DM, Ha T. Observation of internal cleavage and ligation reactions of a ribozyme. Nat. Struct. Mol. Biol. 2004;11:1107–1113. doi: 10.1038/nsmb842. [DOI] [PubMed] [Google Scholar]
- 16.Rasnik I, McKinney SA, Ha T. Nonblinking and long-lasting single-molecule fluorescence imaging. Nat. Methods. 2006;3:891–893. doi: 10.1038/nmeth934. [DOI] [PubMed] [Google Scholar]
- 17.Amirgoulova EV, Groll J, Heyes CD, Ameringer T, Rocker C, Moller M, Nienhaus GU. Biofunctionalized polymer surfaces exhibiting minimal interaction towards immobilized proteins. ChemPhysChem. 2004;5:552–555. doi: 10.1002/cphc.200400024. [DOI] [PubMed] [Google Scholar]
- 18.Tan E, Wilson TJ, Nahas MK, Clegg RM, Lilley DM, Ha T. A four-way junction accelerates hairpin ribozyme folding via a discrete intermediate. Proc. Natl. Acad. Sci. U.S.A. 2003;100:9308–9313. doi: 10.1073/pnas.1233536100. [DOI] [PMC free article] [PubMed] [Google Scholar]
- 19.Zhuang X, Kim H, Pereira MJ, Babcock HP, Walter NG, Chu S. Correlating structural dynamics and function in single ribozyme molecules. Science. 2002;296:1473–1476. doi: 10.1126/science.1069013. [DOI] [PubMed] [Google Scholar]
- 20.Xie Z, Srividya N, Sosnick TR, Pan T, Scherer NF. Single-molecule studies highlight conformational heterogeneity in the early folding steps of a large ribozyme. Proc. Natl. Acad. Sci. U.S.A. 2004;101:534–539. doi: 10.1073/pnas.2636333100. [DOI] [PMC free article] [PubMed] [Google Scholar]
- 21.Schuler B, Lipman EA, Eaton WA. Probing the free-energy surface for protein folding with single-molecule fluorescence spectroscopy. Nature. 2002;419:743–747. doi: 10.1038/nature01060. [DOI] [PubMed] [Google Scholar]
- 22.Kuzmenkina EV, Heyes CD, Nienhaus GU. Single-molecule FRET study of denaturant induced unfolding of RNase H. J. Mol. Biol. 2006;357:313–324. doi: 10.1016/j.jmb.2005.12.061. [DOI] [PubMed] [Google Scholar]
- 23.Haustein E, Schwille P. Ultrasensitive investigations of biological systems by fluorescence correlation spectroscopy. Methods. 2003;29:153–166. doi: 10.1016/s1046-2023(02)00306-7. [DOI] [PubMed] [Google Scholar]
- 24.Zemanova L, Schenk A, Valler MJ, Nienhaus GU, Heilker R. Confocal optics microscopy for biochemical and cellular high-throughput screening. Drug Discov. Today. 2003;8:1085–1093. doi: 10.1016/s1359-6446(03)02833-2. [DOI] [PubMed] [Google Scholar]
- 25.Rieger R, Röcker C, Nienhaus GU. Fluctuation correlation spectroscopy for the advanced physics laboratory. Am. J. Phys. 2005;73:1129–1134. [Google Scholar]
- 26.Fang XW, Pan T, Sosnick TR. Mg2+-dependent folding of a large ribozyme without kinetic traps. Nat. Struct. Biol. 1999;6:1091–1095. doi: 10.1038/70016. [DOI] [PubMed] [Google Scholar]
- 27.Misra VK, Draper DE. The linkage between magnesium binding and RNA folding. J. Mol. Biol. 2002;317:507–521. doi: 10.1006/jmbi.2002.5422. [DOI] [PubMed] [Google Scholar]
- 28.Misra VK, Shiman R, Draper DE. A thermodynamic framework for the magnesium-dependent folding of RNA. Biopolymers. 2003;69:118–136. doi: 10.1002/bip.10353. [DOI] [PubMed] [Google Scholar]
- 29.Fang X, Pan T, Sosnick TR. A thermodynamic framework and cooperativity in the tertiary folding of a Mg2+-dependent ribozyme. Biochemistry. 1999;38:16840–16846. doi: 10.1021/bi991700n. [DOI] [PubMed] [Google Scholar]
- 30.Walter NG, Burke JM, Millar DP. Stability of hairpin ribozyme tertiary structure is governed by the interdomain junction. Nat. Struct. Biol. 1999;6:544–549. doi: 10.1038/9316. [DOI] [PubMed] [Google Scholar]
- 31.Bassi GS, Mollegaard NE, Murchie AI, Lilley DM. RNA folding and misfolding of the hammerhead ribozyme. Biochemistry. 1999;38:3345–3354. doi: 10.1021/bi982985r. [DOI] [PubMed] [Google Scholar]
- 32.Schlatterer JC, Stuhlmann F, Jäschke A. Stereoselective synthesis using immobilized Diels-Alderase ribozymes. ChemBioChem. 2003;4:1089–1092. doi: 10.1002/cbic.200300676. [DOI] [PubMed] [Google Scholar]
- 33.Murphy MC, Rasnik I, Cheng W, Lohman TM, Ha T. Probing single-stranded DNA conformational flexibility using fluorescence spectroscopy. Biophys. J. 2004;86:2530–2537. doi: 10.1016/S0006-3495(04)74308-8. [DOI] [PMC free article] [PubMed] [Google Scholar]
- 34.Caliskan G, Hyeon C, Perez-Salas U, Briber RM, Woodson SA, Thirumalai D. Persistence length changes dramatically as RNA folds. Phys. Rev. Lett. 2005;95:268303. doi: 10.1103/PhysRevLett.95.268303. [DOI] [PubMed] [Google Scholar]
- 35.Ishii Y, Yoshida T, Funatsu T, Wazawa T, Yanagida T. Fluorescence resonance energy transfer between single fluorophores attached to a coiled-coil protein in aqueous solution. Chem. Phys. 1999;247:163–173. [Google Scholar]
- 36.Coban O, Lamb DC, Zaychikov E, Heumann H, Nienhaus GU. Conformational heterogeneity in RNA polymerase observed by single-pair FRET microscopy. Biophys. J. 2006;90:4605–4617. doi: 10.1529/biophysj.105.078840. [DOI] [PMC free article] [PubMed] [Google Scholar]
- 37.Widengren J, Schwille P. Characterization of photoinduced isomerization and back-isomerization of the cyanine dye Cy5 by fluorescence correlation spectroscopy. J. Phys. Chem. A. 2000;104:6416–6428. [Google Scholar]
- 38.Sabanayagam CR, Eid JS, Meller A. Long time scale blinking kinetics of cyanine fluorophores conjugated to DNA and its effect on Förster resonance energy transfer. J. Chem. Phys. 2005;123:224708. doi: 10.1063/1.2136157. [DOI] [PubMed] [Google Scholar]
- 39.Flory PJ. Statistical Mechanics of Chain Molecules. New York, U.S.A: Wiley; 1969. [Google Scholar]
- 40.Nienhaus GU, Young RD. In: Encyclopedia of Applied Physics. Trigg G, editor. Vol. 15. New York, U.S.A: Wiley-VCH; pp. 163–184. [Google Scholar]
- 41.Silverman SK, Deras ML, Woodson SA, Scaringe SA, Cech TR. Multiple folding pathways for the P4-P6 RNA domain. Biochemistry. 2000;39:12465–12475. doi: 10.1021/bi000828y. [DOI] [PubMed] [Google Scholar]
- 42.Penedo JC, Wilson TJ, Jayasena SD, Khvorova A, Lilley DM. Folding of the natural hammerhead ribozyme is enhanced by interaction of auxiliary elements. RNA. 2004;10:880–888. doi: 10.1261/rna.5268404. [DOI] [PMC free article] [PubMed] [Google Scholar]
- 43.Swisher JF, Su LJ, Brenowitz M, Anderson VE, Pyle AM. Productive folding to the native state by a group II intron ribozyme. J. Mol. Biol. 2002;315:297–310. doi: 10.1006/jmbi.2001.5233. [DOI] [PubMed] [Google Scholar]
- 44.Wombacher R, Keiper S, Suhm S, Serganov A, Patel DJ, Jäschke A. Control of stereoselectivity in an enzymatic reaction by backdoor access. Angew. Chem. Int. Ed. Engl. 2006;45:2469–2472. doi: 10.1002/anie.200503280. [DOI] [PMC free article] [PubMed] [Google Scholar]
- 45.Ostermann A, Waschipky R, Parak FG, Nienhaus GU. Ligand binding and conformational motions in myoglobin. Nature. 2000;404:205–208. doi: 10.1038/35004622. [DOI] [PubMed] [Google Scholar]
- 46.Brion P, Westhof E. Hierarchy and dynamics of RNA folding. Annu. Rev. Biophys. Biomol. Struct. 1997;26:113–137. doi: 10.1146/annurev.biophys.26.1.113. [DOI] [PubMed] [Google Scholar]
- 47.Zarrinkar PP, Williamson JR. Kinetic intermediates in RNA folding. Science. 1994;265:918–924. doi: 10.1126/science.8052848. [DOI] [PubMed] [Google Scholar]
- 48.Pan J, Thirumalai D, Woodson SA. Folding of RNA involves parallel pathways. J. Mol. Biol. 1997;273:7–13. doi: 10.1006/jmbi.1997.1311. [DOI] [PubMed] [Google Scholar]
- 49.Sclavi B, Sullivan M, Chance MR, Brenowitz M, Woodson SA. RNA folding at millisecond intervals by synchrotron hydroxyl radical footprinting. Science. 1998;279:1940–1943. doi: 10.1126/science.279.5358.1940. [DOI] [PubMed] [Google Scholar]
- 50.Rook MS, Treiber DK, Williamson JR. Fast folding mutants of the Tetrahymena group I ribozyme reveal a rugged folding energy landscape. J. Mol. Biol. 1998;281:609–620. doi: 10.1006/jmbi.1998.1960. [DOI] [PubMed] [Google Scholar]
- 51.Buchmueller KL, Webb AE, Richardson DA, Weeks KM. A collapsed non-native RNA folding state. Nat. Struct. Biol. 2000;7:362–366. doi: 10.1038/75125. [DOI] [PubMed] [Google Scholar]
- 52.Zhuang X, Bartley LE, Babcock HP, Russell R, Ha T, Herschlag D, Chu S. A single-molecule study of RNA catalysis and folding. Science. 2000;288:2048–2051. doi: 10.1126/science.288.5473.2048. [DOI] [PubMed] [Google Scholar]
- 53.Bokinsky G, Rueda D, Misra VK, Rhodes MM, Gordus A, Babcock HP, Walter NG, Zhuang X. Single-molecule transition-state analysis of RNA folding. Proc. Natl. Acad. Sci. U.S.A. 2003;100:9302–9307. doi: 10.1073/pnas.1133280100. [DOI] [PMC free article] [PubMed] [Google Scholar]
- 54.Bokinsky G, Zhuang X. Single-molecule RNA folding. Acc. Chem. Res. 2005;38:566–573. doi: 10.1021/ar040142o. [DOI] [PubMed] [Google Scholar]
- 55.Sosnick TR, Pan T. RNA folding: models and perspectives. Curr. Opin. Struct. Biol. 2003;13:309–316. doi: 10.1016/s0959-440x(03)00066-6. [DOI] [PubMed] [Google Scholar]
Associated Data
This section collects any data citations, data availability statements, or supplementary materials included in this article.