

Abstract
All protein sequences from 19 complete chloroplast genomes (cpDNA) have been studied using a new computational method able to analyze functional correlations among series of protein sequences contained in complete proteomes. First, all open reading frames (ORFs) from the cpDNAs, comprising a total of 2266 protein sequences, were compared against the 3168 proteins from Synechocystis PCC6803 complete genome to find functionally related orthologous proteins. Additionally, all cpDNA genomes were pairwise compared to find orthologous groups not present in cyanobacteria. Annotations in the cluster of othologous proteins database and CyanoBase were used as reference for the functional assignments. Following this protocol, new functional assignments were made for ORFs of unknown function and for ycfs (hypothetical chloroplast frames), which still lack a functional assignment. Using this information, a matrix of functional relationships was derived from profiles of the presence and/or absence of orthologous proteins; the matrix included 1837 proteins in 277 orthologous clusters. A factor analysis study of this matrix, followed by cluster analysis, allowed us to obtain accurate phylogenetic reconstructions and the detection of genes probably involved in speciation as phylogenetic correlates. Finally, by grouping common evolutionary patterns, we show that it is possible to determine functionally linked protein networks. This has allowed us to suggest putative associations for some unknown ORFs.
The so-called postgenomic era is linked to the knowledge of complete genomes for many organisms. In this context, the design and the testing of new mathematical and computational tools able to assign function to gene products and compare complete genomes are becoming crucial. The use of computational tools to infer, analyze, and compare both structure and function of the complete predicted proteome is being considered an essential new instrument for the progress of biological research (for reviews, see Andrade and Sander 1997; Bork et al. 1998; Eisenberg et al. 2000; Pellegrini 2001). Still, the field of bioinformatics is in its infancy. For example, the fraction of hypothetical proteins or open reading frames (ORFs) in complete genomes remains remarkably high. Thus, the most recently sequenced first complete plant genome, from Arabidopsis thaliana (Arabidopsis genome 2000), presents 25,498 identified genes, out of which ∼30% correspond to hypothetical proteins or proteins of unknown function. Similarly, and in spite of the impressive accumulation of genome information over the last several years, the availability of tools for comparative genome analysis to establish the implications of the differences in gene content between species from a biomolecular perspective is virtually absent.
The chloroplast is an essential organelle in plants. It performs photosynthesis and therefore is required for the photoautotrophic plant growth that moves our biosphere. The generally accepted endosymbiontic hypothesis states that chloroplasts have arisen from an internalized cyanobacterial ancestor (Cavalier-Smith 2000). Chloroplasts have maintained an independent genome that encodes an important part of the proteins required for their photosynthetic activity and different housekeeping functions. The chloroplast genome (cpDNA) consists of homogeneous circular double-stranded DNA molecules of 110–200 kb size, containing between 30 to 50 different RNA genes and a number of protein-coding genes, which ranges from about 100 in land plants and green algae to 150–200 in nongreen algae (Sugiura 1995). These protein-coding genes can be roughly classified into two main groups: genes enrolled in the expression and translation machinery of the chloroplast and genes related to bioenergetics and photosynthetic function. The largest known chloroplast genome corresponds to the red alga Porphyra and has 70–80 additional genes, one-third of which are related to biosynthesis of amino acids and other essential biomolecules. A feature of chloroplast genomes from most plants is the presence of two large inverted repeats (IRs) of 6–76 kb that divide the cpDNA in one large and one small single-copy region (called LSC and SSC, respectively; Sugiura 1995).
The nonrecombinant, uniparentally inherited nature of organelle genomes makes them potentially useful tools for evolutionary studies. However, in practice, detecting useful polymorphism at the population level is often difficult due to the low level of substitutions (slow substitution rates) in plant chloroplast genomes. Attempts to reconstruct plastid evolution with traditional biomolecular approaches (i.e., sequence-based analyses of RNAs or of protein-encoding genes) have proven particularly difficult (Martin et al. 1998; Sugiura et al. 1998; Adachi et al. 2000). Thus, in a recent study, Martin and coworkers attempted to build phylogenetic trees and to obtain evolutionary information by comparing 45 common chloroplast proteins, pasted together in a unique macroprotein with 9957 (Adachi et al. 2000) and 11,039 (Martin et al. 1998) amino acid sites. The investigators encountered some difficulties to statistically discriminate among the several possible phylogenetic trees obtained. Therefore, alternative and independent types of evidence that might provide new information about ancient plastid history are required. Some new alternatives for phylogenetic assignments involve examination of the arrangement or order of genes in genomes by gene-cluster analysis history (Stoebe and Kowallik 1999). However, such analysis are usually carried out with some particular sets of related proteins or group of genes and, therefore, they tend to reflect the partial phylogeny of these genes rather than that of the whole organisms or genomes.
The knowledge of complete genomes opens up the possibility of developing innovative tools for phylogenetic reconstruction and evolutionary analyses. A promising approach is presented here, based on the quantitative analysis of clusters of orthologous proteins (COGs) and applied to chloroplast history. Chloroplast genomes are, as a result of the considerable number available and small size, excellent model systems in computational genomics studies. A number of important questions from the bioinformatics perspective can be addressed by experimenting with them. For example, how accurate can phylogenetic reconstructions be made by using the complete genome information? Or is it possible to uncover evolutionary forces by comparing complete genomes? Finally, can phylogenetic profiles, derived from the absence/presence of a given gene in the set of genomes under study, be used to determine functional associations? In this study we try to address these questions. First, we apply a new program developed in our laboratory for genome annotation, and compare its performance with the well-known approach of using PSI-BLAST. Then, a comparative genomics study is carried out using techniques borrowed from multivariate analysis.
RESULTS AND DISCUSSION
Functional Annotations of cpDNA Proteins
Quality of Annotations
All protein sequences from 19 complete chloroplast genomes (cpDNA) were compared against the 3168 proteins from Synechocystis PCC6803 complete genome. The number of proteins in a chloroplast proteome ranges from 66 in the smallest genome (Euglena gracilis) to 209 proteins in the largest one (Porphyra purpurea). Taking all genomes, the total number of chloroplast proteins compared was 2266. As described in Methods, we compared genomes pairwise, taking all proteins in one genome and comparing them with all proteins in the other, trying to find the most likely ortholog pair. The degree of functional matching was evaluated with the μ-score, a measure of the structurally implied similarity between two sequences (see Methods). Figure 1 presents the values of μ-scores obtained by pairwise comparison of all the chloroplast proteins against the following: (1) the set of Synechocystis proteins annotated in the COGs database (http://www.ncbi.nlm.nih.gov/COG/), which included 2113 proteins; (2) the complete proteome of Synechocystis, which included 3168 proteins and was taken from the CyanoBase database (http://www.kazusa.or.jp/cyano/); and (3) the set of Saccharomyces proteins constituted by its database of COGs, which included 2175 proteins.
Figure 1.

Plot of the μ-scores obtained by pairwise comparison of all proteins of each cpDNA (a total of 2266 proteins) against the complete predicted proteome of Synechocystis (3168 proteins), against the Synechocystis clusters of orthologous proteins (COGs; 2113 proteins) and against Saccharocyces cerevisiae (2175 proteins). The figures are plotted in linear (top graph) and in log scale (bottom graph). Inset indicates the correct pairs of proteins (squares) and the incorrect pairs (open triangles) for the data corresponding to comparison with the complete Synechocystis proteome below μ-score 5; gray lines indicate cases in which both proteins are hypothetical.
In Figure 1A the values of μ-scores obtained are plotted versus the number of proteins, and in Figure 1B the same data are represented using a log scale for the number of proteins. From these plots it is possible to estimate the optimal cutoff value μc (see Methods). Previously (Fabrega et al. 2001) it was found that a cutoff of about 2.5 was reliable to separate pairs with the same function from those with different functions, and such cutoff value is marked with a line in Figure 1. In the curves (Fig. 1A), especially in the comparison against Synechocystis COGs, a clear inflexion point at around μ-score 2.5 can be observed. The inflexion point is more evident when genomes are matched against the COGs database because, in our interpretation, this database includes protein families with function assignments across phylogenetically distant species, and consequently it is difficult to provide an accurate functional class assignment for largely diverged sequences. On the other hand, since CyanoBase is specialized in cyanobacteria, it seems that it has been possible to detect during the database compilation highly diverged sequences, that is, functional assignments for diverged sequences are more reliable. The observed 2.5 inflexion point marks our threshold for functional assignment. Above μ-score of 2.5 all assignments were correct when compared against Synechocystis COGs. It is also interesting to see that the comparison against proteins of an eukaryote such as Saccharomyces finds, as expected, a much smaller number of significant matches, but it also presents the indicated inflexion point around μ-score 2.5. The log plot in Figure 1B highlights proteins with a high degree of functional conservation. For example, it can be observed that a large proportion of the highest μ-scores (>30) were obtained for two polypeptides corresponding to photosystem I (i.e., psaA and psaB). An analogous step is observed in the comparison with Synechocystis COGs, in which the highest points (of μ-scores >25) correspond mainly to ribulose bisphosphate carboxylase (i.e., rubisco) large subunit (rbcL). In the comparison with Saccharomyces COGs, the highest values (μ-score between 15 and 20) correspond mainly to the contribution of two ATP synthase subunits (atpF and atpA). These data indicate that in chloroplast genomes there is a very strong conservation of those protein complexes essential for bioenergetics. This is not surprising, considering that chloroplasts are the organelles responsible for the energy supply in plant cells. But our data seem also to indicate that these conserved subunits of the multimeric protein complexes PSI, rubisco, and ATPase may constitute an ancient core for these protein complexes because they correspond to the most conserved genes. The comparison with Saccharomyces COGs also shows two other smaller steps around μ-scores 8 and 4, which mainly correspond to ribosomal proteins (rpl2, rps12, rpl16) and to RNA polymerase subunit (rpoB). These marks indicate that together with photosynthetic-energy production the other essential function in chloroplasts is the translation machinery. A previous study of ribosomal and atp gene clusters in chloroplasts has also shown a strong conservation in genes atpA, atpF, rpl2, and rpoB (Stoebe and Kowallik 1999).
The Figure 1A inset presents in more detail the region in the μ-score between 1 and 5 for the curve corresponding to the comparison of all the cpDNA proteins versus the complete Synechocystis proteome. The inset shows in solid squares the correct matches, in open triangles the detected mismatches, and with gray lines unresolved matches (i.e., those in the pairwise comparison in which at least one protein is hypothetical or has unknown function). It can be seen that up to 2.5, all the known matches are correct. The number of possible false-positives for μ-scores ≥2.5 was checked by looking at the identity of function of well-known and well-annotated proteins pairs. Among the first 100 known Synechocystis proteins, all assignments were correct. Therefore, the cutoff of 2.5 seems a good, conservative threshold for functional assignment in this case. Below 2.5, most pairs do not have assigned function (gray lines). There is an intermediate zone between 2.5 and 1.9 in which the method still maintains a significant proportion of correct matches. This region includes 131 matches, out of which 50 are correct, 2 are erroneous, 15 correspond to new assignments, and 64 correspond to hypothetical proteins in both sides. The new assignments identified in this region are included in Table 3 (see below). Below 1.9 a significant amount of mismatches start to appear.
Table 3.
Proteins Annotated as ORF or unknown which Are Assigned to Proteins of Known Function
| μ-score | Synechocystis proteins | Chloroplasts proteins—ORF or unknown | PSI-BLAST | ||||||||
|---|---|---|---|---|---|---|---|---|---|---|---|
| Prot. ID | Prot. function | Gene | aa | Prot. ID | Prot. function | Organism | aa | Hits | Prot. detected | ||
| 1 | 17.10 | 6466376a | rubisco expression prot | cfxX/Q | 301 | 1276694 | ORF301 | Porphyra purpurea | 301 | >1000 | CFXQ_CYAME |
| 2 | 12.00 | sll1536 | molybdopterin biosynthesis prot MoeB | moeB | 392 | 1276801 | ORF382 | Porphyra purpurea | 382 | 585 | moeB_MYCTU |
| 3 | 9.60 | sll1536 | molybdopterin biosynthesis prot MoeB | moeB | 392 | 6466397 | chlN (incorrect) | Cyanidium caldarium | 395 | 574 | moeB_MYCTU |
| 4 | 7.60 | sll0621 | thiol:disulfide interchange prot DsbD | dsbD | 248 | 1276830 | ORF240 | Porphyra purpurea | 240 | 58 | cycZ_ECOLI |
| 5 | 5.40 | sll1035 | uracil phosphoribosyl transferase | upp | 216 | 1276820 | ORF198 | Porphyra purpurea | 198 | 88 | UPP_STRSL |
| 6 | 4.70 | slr1365 | BioY prot | bioY | 217 | 1016197 | ORF188 | Cyanophora parado | 188 | 26 | BIOY_BACSH |
| 7 | 3.90 | slr0839 | ferrochelatase | hemH | 387 | 1276821 | ORF48 | Porphyra purpurea | 48 | 47 | HEMZ_SYNY3 |
| 8 | 3.60 | slr1365 | BioY prot | bioY | 217 | 7259544 | unknown | Mesostigma viride | 223 | 2 | bioY_SYNY3 |
| 9 | 2.50 | 11691a | cytochrome b6/f subunit VI (3.5kD) | petL | 31 | 5881712 | ORF31 | Arabidopsis thaliano | 31 | 2 | PETL_BETVU |
| 10 | 2.50 | 12005a | cytochrome b6/f subunit VI (3.5kD) | petL | 31 | 1262631 | ORF62b | Pinus thunbergii | 62 | 2 | PETL_BETVU |
| 11 | 2.50 | 11809a | maturase K | matK | 509 | 295955 | ORF506 | Euglena gracilis | 506 | 994 | mat_PSEAL |
List of ORFs from different cpDNAs for which functional annotation has been possible. The results from PSI-BLAST are also shown, indicating the number of significant hits obtained (column 11), and the ortholog assigned (column 12). Proteins in column 12 are labeled according to SwissProt nomenclature.
Not in Synechocystis.
Fraction of Annotations in Complete Genomes
The number of proteins with μ-scores above the cutoff (μc = 2.5) was 1097 when Synechocystis COGs database was used and 1696 when Synechocystis CyanoBase was used. A good linear correlation was found between proteome size and number of assignments to COGs. Table 1 includes this information and some other derived data. In the first three columns we show the size of each cpDNA, the size considering only ORFs (i.e., counting only the nucleotides corresponding to ORFs), and the percentage of nonencoding DNA (No cod DNA, calculated by subtracting columns 1 and 2 and then dividing by total DNA). The next four columns show the total number of proteins in each cpDNA (Prot Total) and the assignments based on Synechocystis COGs (Syn COGs), on all Synechocystis proteome (Syn CyanoB), and on the comparsion with all other cpDNAs (in other cpDNA). This last pairwise comparison between cpDNAs was done using only proteins not assigned to any Synechocystis orthologs. The final number of cpDNA proteins assigned was 1837 out of 2266, which is 81% of the ORFs in the cpDNAs. Of these proteins, 1696 correspond to Synechocystis orthologies and 141 to orthologous groups specific to the plant chloroplasts. The remaining 429 proteins were left unassigned.
Table 1.
cpDNA Size, Percentage of Assignments, and Presence of Introns, matK, and IR
| Species | Total DNA cpDNA bp | No.nuclotides in ORFs | No. cod DNA (%) | Prot Total | In Syn COGs | In Syn CyanoB | In other cpDNA | No. assigned | No.introns | Presence of matK | Presence of IR | |
|---|---|---|---|---|---|---|---|---|---|---|---|---|
| ORFs | (%) | |||||||||||
| Nongreen algae | ||||||||||||
| CyaPar | 135,599 | 97,656 | 28.0 | 149 | 83 | 135 | 5 | 9 | 6.0 | 1 | No | Yes |
| GuiThe | 121,524 | 97,233 | 20.0 | 147 | 86 | 132 | 8 | 7 | 4.8 | No | Yes | |
| OdoSin | 119,704 | 91,098 | 23.9 | 140 | 75 | 118 | 3 | 19 | 13.6 | 0 | No | Yes |
| CyaCal | 164,921 | 142,182 | 13.8 | 197 | 115 | 172 | 6 | 19 | 9.6 | No | ||
| PorPur | 191,028 | 153,396 | 19.7 | 209 | 120 | 194 | 9 | 6 | 2.9 | 0 | No | |
| Euglenophyta | ||||||||||||
| EugGra | 143,172 | 50,964 | 64.4 | 66 | 32 | 52 | 4 | 10 | 15.1 | 155 | Yes | |
| Green algae | ||||||||||||
| ChlVul | 150,613 | 91,074 | 39.5 | (174) 106 | 45 | 71 | 2 | (101) 33 | (58.0) | 3 | No | Not present |
| MesVir | 118,360 | 77,412 | 34.6 | 105 | 60 | 95 | 2 | 8 | 7.6 | 0 | No | Yes |
| NepOli | 200,799 | 127,470 | 36.5 | 155 | 64 | 96 | 2 | 57 | 36.8 | 0 | No | Yes |
| Land plants | ||||||||||||
| PinThu | 119,707 | 76,605 | 36.0 | (160) 114 | 37 | 63 | 8 | (89) 43 | (55.6) | Yes | Very small | |
| MarPol | 121,024 | 72,528 | 40.1 | 89 | 50 | 78 | 6 | 5 | 5.6 | ≈20 | Yes | Yes |
| SpiOle | 150,725 | 75,108 | 50.2 | 98 | 49 | 76 | 4 | 18 | 18.4 | ≈20 | Yes | Yes |
| AraTha | 154,478 | 85,044 | 44.9 | 88 | 50 | 78 | 9 | 1 | 1.1 | ≈20 | Yes | Yes |
| OenEla | 159,443 | 88,197 | 44.7 | 119 | 50 | 77 | 12 | 30 | 25.2 | Yes | Yes | |
| NicTab | 155,939 | 80,343 | 48.5 | 101 | 50 | 74 | 16 | 11 | 10.9 | ≈20 | Yes | Yes |
| OrySat | 134,525 | 67,434 | 49.9 | 108 | 53 | 78 | 23 | 7 | 6.5 | ≈20 | Yes | Yes |
| ZeaMay | 140,387 | 68,772 | 51.0 | 111 | 50 | 75 | 17 | 19 | 17.1 | ≈20 | Yes | Yes |
| Other | ||||||||||||
| EpiVir | 70,028 | 30,348 | 56.7 | 24 | 17 | 20 | 4 | 0 | 0.0 | Yes | Yes | |
| ToxGon | 34,996 | 18,747 | 46.4 | 26 | 11 | 12 | 1 | 13 | 50.0 | |||
| TOTAL | 2266 | 1097 | 1696 | 141 | 429 | |||||||
Data about the genomes that include the size of each cpDNA, the percentage of encoding DNA (counted as the size of ORFs), the number of proteins assigned for each species, and the presence of introns, maturase (matK) and inverted repeats (IR) in the cpDNAs.
There is a linear correlation between the predicted proteome size and number of assignments, which, however, presents exceptions in three genomes: Chlorella vulgaris (ChlVul), Nephroselmis olivacea (NepOli), and Pinus thunbergii (PinThu). These contain the major fraction of unassigned proteins: 102 in C. vulgaris, 57 in N. olivacea, and 89 in P. thunbergii (that represent 58% of the total, 247/429). The average number of proteins left unassigned in the other 16 cpDNA is ∼11 proteins per genome, which gives a percentage of assigned proteins of 89.8% in these 16 cpDNAs. By contrast, the average number of assignment proteins in the mentioned 3 species is only 49.5%. The most up-to-date annotation of Chlorella and Pinus shows many tRNA genes (trn) in the encoding region (see http://www.ncbi.nlm.nih.gov/cgi-bin/Entrez/framik?gi=13217&db=Genome), including 69 trn in Chlorella-encoding region and 46 trn in Pinus. If these trn genes are removed from the proteomes, the number of unassigned ORFs is 33 and 43 for Chlorella and Pinus, respectively (Table 1). After this adjustment, the size of their proteomes is now 106 and 114 proteins, respectively. These numbers are in better agreement with the trends in proteome size observed for chloroplast genomes in green algae and land plants (see Table 1). Still, we have reasons to suggest that many of the other unassigned ORFs (perhaps ∼20 per genome) in these three genomes also correspond to RNA genes or perhaps pseudogenes: (1) No sequence homology was detected internally among the members of the group of 247 ORFs; (2) most of these ORFs are too short (for example, Chlorella has 60 ORFs of 40–59 codons, which would not give polypeptides longer than 20 amino acids); and (3) the inverted repeat (IR) is not present, or it is very reduced, in Chlorella and Pinus. The IR is a portion of cpDNA well conserved in angiospermae (Goulding et al. 1996), which mainly includes RNA genes. Complete clarification of this issue is out of the scope of this paper.
The proportion of nonencoding DNA correlates in some extent with the presence of introns and the maturase gene (matK) in the cpDNAs (see Table 1). On the basis of these genomic characteristics, green algae seem to define an evolutionary area marking a transition between unicellular nongreen algae (closer to cyanobacteria) and higher plant chloroplast genomes. The percentage of nonencoding DNA steadily increases along with the increase in biological complexity (from unicellular aquatic algae to pluricellular terrestrial plants): It is 15%–30% in nongreen algae and rises to 35%–40% in green algae and 40%–50% in land plants. The presence of introns and maturase occurs in land plants and also marks a distinction from algae. An exception to this trend is the green flagellate E. gracilis, which has a high proportion of nonencoding DNA (68%) and a large number of introns (155; Hallick et al. 1993). This difference is reckoned by its phylogenetic classification because euglenoids are not plants but protist flagellates, that include both photoautotropic species like Euglena and also many colorless heterotrophic species that do not have chloroplasts.
Discussion of New Annotations
We have been able to provide some new functional assignments for some ycfs (hypothetical chloroplast frames), which correspond to ORFs well conserved in cpDNAs but without a clear functional annotation (Rochaix 1999). Previous studies on cpDNA have indicated putative functions for several of them (Douglas and Penny 1999). Our study confirms all functions attributed to ycfs as reported by Douglas and Penny (data not shown) and additionally provides assignments to some cpDNA ORFs of still unknown function. Table 2 presents a list of Synechocystis proteins that matched with ycfs at a significant μ-score. The identity number (prot.ID) of each protein is included. Table 2 also includes proteins annotated as ORFs or unknown but orthologous to a ycf. In some cases (see Table 2, rows 1, 3, 6, and 7) the unknown protein comes from the Synechocystis genome. In one case, the μ-score is below the threshold (μ-score = 2.2), but the function attributed to ycf9 has been recently confirmed by experimental data indicating that encodes the photosystem II core subunit protein PsbZ (Swiatek et al. 2001). Other investigators have detected a down-regulation of photosynthetic activity when this gene was inactivated, consistent with an alteration of a photosystem II subunit (Baena-Gonzalez et al. 2001). We detect the presence of the ycf9 gene in Synechocystis and in all other cpDNA studied, excluding the nonphotosynthetic parasites Epifagus virginiana and Toxoplasma gondii.
Table 2.
Functional Assignments for ycfs Hypothetical Chloroplast Frames
| μ-score | Prot. ID | Synechocystis Proteins Prot. function | Gene | Prot. ID | Chloroplasts Proteins Prot. function | Organism | ycf | Gene assignment | |
|---|---|---|---|---|---|---|---|---|---|
| 1 | 3.1 | sml0004 | hypothetical prot ycf6 (29aa) | petN | 6723740 | cytb6/f subunit VIII (3.2kD) | Oenothera elata | ycf6 | petN |
| 2 | 2.2 | sll1281 | PSII subunit PsbZ (ycf9) | psbZ | 1185234 | ORF61 (ycf9) | Odontella sinensis | ycf9 | psbZ |
| 3 | 2.4 | sll0047 | hypothetical prot (103aa) | ? | 1016157 | ycf12 | Cyanophora paradoxa | ycf12 | ? |
| 4 | 2.7 | ssr1789 | light inducible prot (CAB/ELIP/HILP family) | hliA | 6466403 | unknown | Cyanidium caldarium | ycf17 | hliA |
| 5 | 2.7 | ssl0453 | phycobilisome degradation prot NblA | nblA | 2465760 | unknown | Cyanidium caldarium | ycf18 | nblA |
| 6 | 2.5 | sml0007 | ycf32 (39aa) | psbY | 1185183 | PSII subunit Y (ORF36) | Odontella sinensis | ycf32 | — |
| 7 | 2.4 | sml0007 | ycf32 (39aa) | — | 2465767 | unknown | Cyanidium caldarium | ycf32 | psbY |
List of chloroplast ycfs that were assigned to specific proteins with known function.
Table 3 presents a list of chloroplast proteins, annotated as ORF or unknown, which are assigned to proteins of known function in the present study. Using the cutoff of 2.5, 11 ORFs were newly assigned: 7 to known proteins in Synechocystis and 4 to known proteins in other cpDNA. Table 3 also shows the μ-scores corresponding to each assignment. The identity number (prot.ID) and the number of residues of each protein (aa) are also included. PSI-BLAST (Altschul et al. 1997) searches were also conducted with all the protein sequences included in Table 3. PSI-BLAST detected similar orthologs for queries with μ-score above 2.5. One interesting result in Table 3 is the identification in Euglena of a gene corresponding to maturase (matK). As shown in Table 1, maturase separates land plants from the rest. Euglena cpDNA includes many introns (Hallick et al. 1993) and could not possibly survive without enzymes essential for RNA maturation.
Chloroplast genomes in most higher plants contain two giant ORFs designated ycf1 and ycf2. The functional assignment of these genes has been the subject of some discussion. In tobacco, for example, ycf1 potentially specifies a protein of 1901 amino acids, whereas the putative gene product of the ycf2 reading frame is a protein of 2280 amino acids. It has been suggested that these long genes do not correspond to functional proteins; instead some investigators have suggested that they correspond to pseudogenes that have lost function. However, experiments with mutant alleles for targeted disruption and/or deletion of these two ORFs in tobacco plants (Drescher et al. 2000) have indicated that ycf1 and ycf2 encode products essential for cell survival. We assign ycf2 to a cell division protein (fstH) and ycf1 to an ABC-transporter, supporting the idea that these genes are indispensable for the plant. However, we do not include them in Table 2, as these functional assignments can also be detected by PSI-BLAST.
Factor Analysis of the Matrix of Orthologous Genes
Construction of the X-Matrix
During the construction of the X-matrix, it was observed that only five genes were present in all 20 genomes. These genes (not included in the matrix) were rpl2, rps2, rps3, rps4, and rps12. All of them correspond to ribosomal proteins, and they form the most conserved core of the chloroplast ribosome probably essential for its translation activity. In the 277 groups of orthologous proteins that form the X-matrix (which are lines 101 type), 256 correspond to COGs present in Synechocystis and 21 to COGs that are specific to plant chloroplasts, not present in cyanobacteria. Functional annotation was taken from CyanoBase, with some small modifications. In the 277 COGs, a total of 73 correspond to hypothetical proteins (i.e., groups of proteins not having functional annotations in databases and present in at least two cpDNAs). The matrix will be available at http://alice.usal.es/cpDNA20x277matrix and can also be obtained by contacting the authors.
Loadings Matrix at the Optimal Dimensionality and Phylogenetic Analysis Derived
The X-matrix (a 20 × 277 binary matrix) was analyzed by multivariate analysis as described in Methods. These analyses allow us to obtain important quantitative information about the mutual relationships among genomes, as well as relationships among orthologous proteins. These relationships are mathematically expressed by the loadings (which provide information about the degree of similarity between the genomes) and by the dot product (DP) scores (see equation 6) and the factor scores (which provide information about the proteins and about the relationship between them). Table 4 shows the values of the loadings obtained for each genome. A second X-matrix including only 18 genomes was also analyzed. In this matrix all COGs corresponding to the nonphotosynthetic parasitic genomes (E. virginiana and T. gondii) were excluded. Exclusion of these two genomes was done for the phylogenetic analysis (vide infra) to avoid possible noise introduced by nonphotosynthetic parasitic species. The values of the loadings for the second matrix are also presented in Table 4. A set of 22 chloroplast genes is lost in these excluded genomes: atpA, atpB, atpE, atpF, atpH, petB, psaA, psaB, psbA, psbB, psbC, psbD, psbE, psbF, psbH, psbJ, psbK, psbL, psbT, rbcL, rpoC2, and ycf4. They are mostly photosynthetic subunits that belong to ATPase and photosystem II. A set of 3 proteins is only lost in Epifagus: rpl14, rpoB, and rpoC1; 8 proteins, all ribosomal, are only lost in Toxoplasma: rpl16, rpl20, rps7, rps8, rps11, rps14, rps18, and rps19. The type of proteins lost in Epifagus and Toxoplasma genomes clearly reveals that these organisms have nonphotosynthetic plastids and that they have a very diminished ability for independent translation.
Table 4.
Loadings Matrix Obtained by Factor Analysis of the Two X-Matrices
| 20 genome species | Dimensionsb | 18 genome species | Dimensionsb | |||||||||||||
|---|---|---|---|---|---|---|---|---|---|---|---|---|---|---|---|---|
| 1 | Synechocystis | −0.02 | 0 | 0.281 | 0 | −0.85 | 1 | −0.11 | 0 | Synechocystis | −0.05 | 0 | 0.244 | 0 | −0.85 | 1 |
| 2 | AraTha | 0.949 | 1 | 0.124 | 0 | 0.071 | 0 | −0.042 | 0 | AraTha | 0.951 | 1 | 0.124 | 0 | 0.043 | 0 |
| 3 | ChlVul | 0.753 | 1 | 0.330 | — | −0.221 | 0 | 0.155 | 0 | ChlVul | 0.745 | 1 | 0.321 | — | −0.299 | 0 |
| 4 | CyaCal | 0.012 | 0 | 0.712 | 1 | −0.050 | 0 | −0.050 | 0 | CyaCal | 0.010 | 0 | 0.704 | 1 | −0.074 | 0 |
| 5 | CyaPar | 0.252 | 0 | 0.549 | 1 | −0.244 | 0 | 0.060 | 0 | CyaPar | 0.243 | 0 | 0.540 | 1 | −0.284 | 0 |
| 6 | EpiVir | 0.420 | — | 0.089 | 0 | 0.309 | — | −0.248 | 0 | — | — | — | — | — | — | — |
| 7 | EugGra | 0.625 | 1 | 0.406 | — | −0.001 | 0 | 0.271 | 0 | EugGra | 0.629 | 1 | 0.413 | — | −0.069 | 0 |
| 8 | GuiThe | 0.190 | 0 | 0.840 | 1 | 0.023 | 0 | 0.071 | 0 | GuiThe | 0.194 | 0 | 0.851 | 1 | 0.016 | 0 |
| 9 | MarPol | 0.920 | 1 | 0.078 | 0 | −0.104 | 0 | 0.000 | 0 | MarPol | 0.915 | 1 | 0.071 | 0 | −0.146 | 0 |
| 10 | MesVir | 0.836 | 1 | 0.099 | 0 | −0.289 | 0 | 0.086 | 0 | MesVir | 0.826 | 1 | 0.094 | 0 | −0.316 | 0 |
| 11 | NepOli | 0.860 | 1 | 0.084 | 0 | −0.264 | 0 | 0.105 | 0 | NepOli | 0.852 | 1 | 0.079 | 0 | −0.301 | 0 |
| 12 | NicTab | 0.921 | 1 | 0.072 | 0 | 0.136 | 0 | −0.032 | 0 | NicTab | 0.926 | 1 | 0.077 | 0 | 0.122 | 0 |
| 13 | OdoSin | 0.263 | 0 | 0.832 | 1 | 0.020 | 0 | 0.095 | 0 | OdoSin | 0.266 | 0 | 0.841 | 1 | 0.003 | 0 |
| 14 | OenEla | 0.939 | 1 | 0.129 | 0 | 0.094 | 0 | −0.036 | 0 | OenEla | 0.942 | 1 | 0.129 | 0 | 0.066 | 0 |
| 15 | OrySat | 0.914 | 1 | 0.045 | 0 | 0.211 | 0 | −0.013 | 0 | OrySat | 0.925 | 1 | 0.057 | 0 | 0.207 | 0 |
| 16 | PinThu | 0.830 | 1 | 0.327 | 0 | 0.026 | 0 | 0.010 | 0 | PinThu | 0.828 | 1 | 0.318 | 0 | −0.046 | 0 |
| 17 | PorPur | −0.067 | 0 | 0.791 | 1 | −0.132 | 0 | −0.065 | 0 | PorPur | −0.073 | 0 | 0.781 | 1 | −0.151 | 0 |
| 18 | SpiOle | 0.938 | 1 | 0.119 | 0 | 0.034 | 0 | −0.044 | 0 | SpiOle | 0.938 | 1 | 0.116 | 0 | 0.003 | 0 |
| 19 | ToxGon | 0.030 | 0 | 0.057 | 0 | 0.067 | 0 | 0.932 | 1 | — | — | — | — | — | — | — |
| 20 | ZeaMay | 0.897 | 1 | 0.020 | 0 | 0.269 | 0 | −0.008 | 0 | ZeaMay | 0.910 | 1 | 0.034 | 0 | 0.268 | 0 |
Loadings matrix for the genomes at the optimal dimensionality: four dimensions for the set of 20 genomes and three dimensions for the set of 18 genomes. Values vary from −1 to 1. The larger the absolute value of the loading, the larger the significance of that factor for the corresponding genome. Decimal numbers in bold indicate relevant loadings at each dimension. Integer numbers in bold are the result of converting the loading infomation into “fingerprints” (see text for details).
Four dimensions explain 75.7% variance.
Three dimensions explain 77.2% variance.
Table 4 presents the loadings corresponding to the most significant dimensions. The optimal number of dimensions was found to be four when 20 genomes were included (explaining 75.7% of the variance) and three for 18 genomes (explaining in this case 77.2% of the variance). Figure 2 shows the accumulated percentage of variance explained at each dimension. Selection of the optimal number of dimensions is based in eigenvalue analysis. To simplify, when the eigenvalue reaches 1, a major part of the variance included in the X-matrix has already been explained. As detailed in Table 4, the first dimension explains green plants (land plants, streptophyta, and green algae, chlorophyta) plus euglenophyta and separates them from the nongreen algae and cyanobacteria. The second dimension, on the other hand, explains the nongreen algae and separates them from green plants and cyanobacteria. The third dimension, finally, is a factor specific for cyanobacteria. These results are rather insensitive to the incorporation or not of the nonphotosynthetic genomes.
Figure 2.

Accumulated percentage of variance explained at each dimensionality, as obtained by the factorial analyses of the X-matrices. The matrices include 277 groups of orthologous proteins from 20 genomes (solid triangles) or 18 genomes (open triangles).
Using the loadings matrix corresponding to the 18 genomes, a phylogenetic tree for the organisms was built. Figure 3A presents the tree in phylogram view. Figure 3C shows the same tree as a rectangular cladogram, including, close to each branch, the percentage of stability according to a bootstraping analysis. Figure 3D shows the same tree in a radial view, including the names of the main phylogenetic groups corresponding to the species studied. The tree shows that the chloroplast of Cyanophora paradoxa is the closest to the ancient cyanobacteria type common ancestor, as it is included in the first short branch, the closest to Synechocystis. On this tree line a more distant second branch appears, including two sub-branches: one that corresponds to bacillarophyta (Odontella sinensis) and cryptophyta (Guillardia theta) and another that corresponds to rhodophyta (Cyanidium caldarium and P. purpurea). The other main branch, opposite to the previous ones in Figure 3D, includes first euglenophyta (E. gracilis) and then all the green plants, starting with chlorophyta (green algae) and following with all the streptophyta (land plants). The tree topology is consistent with the phylogenetic and evolutionary order currently assigned to the organellar genomes (Gray 1999). It also agrees with the phylogenetic classification of these genomes obtained by RNA analyses (Sugiura et al. 1998). The two endosymbiotic events known to occur during chloroplast evolution (Cavalier-Smith 2000) are indicated as small circles in Figure 3D, with 1° for the primary endosymbiosis and 2° for the secondary endosymbiosis. Secondary endosymbiosis has been described to occur in Guillardia (Douglas et al. 2001) and Odontella (Kowallik et al. 1995) and also in an independent way in Euglena (Hallick et al. 1993). The tree also locates well these genomes, in agreement with their endosymbiotic origin. Figure 3B presents another tree obtained with the raw 286 matrix obtained automatically before its manual editing (see Methods). This tree is very similar to the first one, with small variations in the relative location of the green algae and of Oenothera, and it confirms the ability and stability of the method to produce an adequate phylogenetic tree.
Figure 3.

Phylogenetic tree derived from the analysis of the X-matrix of orthologs genes of 17 complete chloroplast genomes plus Synechocystis genome. (A) Tree in phylogram view. (B) A different tree obtained with the raw 286 X-matrix obtained automatically but before manual editing (see Methods). (C) The same tree as in A, but in a rectangular cladogram, including close to each branch the percentage of stability according to bootstrapping analysis. (D) The A tree in a radial view, including names of the main phylogenetic groups corresponding to the species studied.
In recent years several molecular evolutionary studies have been conducted to clarify the evolutionary events in chloroplasts (Martin et al. 1998; Tomitani et al. 1999; Turmel et al. 1999; Adachi et al. 2000; Lemieux et al. 2000; Moreira et al. 2000; Bauer et al. 2001; Provan et al. 2001). A phylogenetic tree for chloroplasts based on the analysis of the sequences of 45 common chloroplast proteins has been recently proposed (Martin et al. 1998; Adachi et al. 2000). The genomic tree presented here shows a remarkable agreement with the phylogenetic tree obtained by Martin and coworkers on the basis of molecular patterns (Martin et al. 1998; Adachi et al. 2000). The location of Cyanophora as the closest relative to the cyanobacterial origin, the location of euglenophytas separated from the rest of green plants, and the correct location of the three organisms involved in the secondary endosymbiotic event are some of the features illustrating such agreement.
It can be concluded that the loadings, as deduced from the matrix of orthologous proteins, can be used to explore and define rather accurately the phylogenetic relationships between cpDNA genomes. The approach is a reasonable extrapolation of the sequence-based methods to whole-genome-tree reconstruction. The initial matrix being diagonalized is basically a similarity matrix between genomes, encoding a reasonable description of genome distances. The use of the loadings matrix, rather than the original correlation matrix, for the clustering algorithm has the effect of giving higher weight to those combinations of genes changing together in a concerted way during evolutionary time. It therefore is equivalent to assuming that independent, uncorrelated gene acquisitions or deletions do not contribute to the phylogenetic tree. Although more studies are required, we argue that this approach, because it focuses on large-scale, correlated changes of the biochemical machinery of all the organisms under study, is adequate for phylogenetic analysis at the genome level.
Detection of Specific Genes as Phylogenetic Correlates
One of the most interesting features of a phylogenetic analysis at the genome level is that it not only allows one to obtain phylogenetic relationships between species, but it may also provide a way to identify the specific proteins or genes that can best explain the differences between species or groups of species, according to the derived phylogenetic tree. In Table 5 we list the proteins we find as the most specific or peculiar for the different groups of chloroplasts. The genes are in descending order according to their DP scores (see Methods for an explanation of this derivation). In this way, genes present at the top of each group in Table 5 are the most important to differentiate and define each branch of genomes in the tree. The profiles column marks with a 1 the presence of a certain gene in a specific genome. Each number (1 or 0) corresponds to 1 of the 20 species ordered from left to right as enumerated in Table 4, starting with Synechocystis.
Table 5.
Genes Selected as Phylogenetic Correlates Specific to Each Tree Branch
| DI score | Syn prot | Gene | Profile | Protein function | |
|---|---|---|---|---|---|
| Branch CyaPar | |||||
| 1 | 0.0400 | sll0534 | clpP | 10001000000000000000 | ATP-dep. translocation rel. protease |
| 2 | 0.0400 | slr0739 | crtE | 10001000000000000000 | geranylgeranyl pyrophosphate synthase |
| 3 | 0.0400 | slr2075 | groES | 10001000000000000000 | 10kD chaperonin 1 |
| 4 | 0.0400 | slr1808 | hemA | 10001000000000000000 | transfer RNA-Gln reductase |
| 5 | 0.0400 | sll1599 | mntA | 10001000000000000000 | Mn transporter |
| 6 | 0.0400 | sll1600 | mntB | 10001000000000000000 | Mn transporter |
| 7 | 0.0400 | sll0622 | nadA | 10001000000000000000 | quinolinate synthetase |
| 8 | 0.0400 | slr2034 | ycf | 10001000000000000000 | hypothetical protein |
| 9 | 0.0400 | slr2073 | ycf | 10001000000000000000 | hypothetical protein |
| 10 | 0.0400 | slr0181 | ycf | 10001000000000000000 | hypothetical protein |
| 11 | 0.0400 | slr1552 | ycf | 10001000000000000000 | hypothetical protein |
| 12 | 0.0400 | sll1702 | ycf | 10001000000000000000 | hypothetical protein |
| Branch Nongreen algae (and CyaPar) | |||||
| 1 | 0.1192 | sll1325 | atpD | 10011001000010001000 | ATP synthase d subunit |
| 2 | 0.1192 | sll1323 | atpG | 10011001000010001000 | ATP synthase subunit b′ |
| 3 | 0.1192 | sll0170 | dnaK | 10011001000010001000 | DnaK protein chaperonin |
| 4 | 0.1192 | slr2076 | groEL | 10011001000010001000 | 60kD chaperonin 1 |
| 5 | 0.1192 | sll0998 | lysR | 10011001000010001000 | LysR transcriptional regulator |
| 6 | 0.1192 | sal0020 | petF | 10011001000010001000 | ferredoxin |
| 7 | 0.1192 | ssr2831 | psaE | 10011001000010001000 | photosystem I subunit IV |
| 8 | 0.1192 | sll0819 | psaF | 10011001000010001000 | photosystem I subunit III |
| 9 | 0.1192 | sll1398 | psbW | 10011001000010001000 | photosystem II 13 kD protein |
| 10 | 0.1192 | sll0258 | ptbV | 10011001000010001000 | cytochrome c550 |
| 11 | 0.1192 | sml0007 | psbY | 10011001000010001000 | photosystem II PsbY protein |
| 12 | 0.1192 | slr0012 | rbcS | 10011001000010001000 | ribulose bisphosphate carboxylase small sub. |
| 13 | 0.1192 | sll1744 | rpl1 | 10011001000010001000 | 50S ribosomal protein L1 |
| 14 | 0.1192 | sll1799 | rpl3 | 10011001000010001000 | 50S ribosomal protein L3 |
| 15 | 0.1192 | sll1810 | rpl6 | 10011001000010001000 | 50S ribosomal protein L6 |
| 16 | 0.1192 | sll1743 | rpl11 | 10011001000010001000 | 50S ribosomal protein L11 |
| 17 | 0.1192 | sll1811 | rpl18 | 10011001000010001000 | 50S ribosomal protein L18 |
| 18 | 0.1192 | sll1812 | rps5 | 10011001000010001000 | 30S ribosomal protein S5 |
| 19 | 0.1192 | sll1767 | rps6 | 10011001000010001000 | 30S ribosomal protein S6 |
| 20 | 0.1192 | sll1102 | rps10 | 10011001000010001000 | 30S ribosomal protein S10 |
| 21 | 0.1192 | sll1816 | rps13 | 10011001000010001000 | 30S ribosomal protein S13 |
| 22 | 0.1192 | sal3437 | rps17 | 10011001000010001000 | 30S ribosomal protein S17 |
| 23 | 0.1192 | sll1814 | secY | 10011001000010001000 | preprotein translocase subunit Y |
| 24 | 0.1192 | slr0075 | ycf16 | 10011001000010001000 | ABC transporter subunit |
| 25 | 0.1192 | slr0399 | ycf39 | 10011001000010001000 | hypothetical protein |
| Branch Red algae (and CyaPar) | |||||
| 1 | 0.0712 | slr2067 | apcA | 10011000000000001000 | allophycocyanin a chain |
| 2 | 0.0712 | slr1986 | apcB | 10011000000000001000 | allophycocyanin b chain |
| 3 | 0.0712 | slr0335 | apcE | 10011000000000001000 | phycobilisome LCM core-membrane linker prot. |
| 4 | 0.0712 | slr0611 | sds | 10011000000000001000 | solanesyl diphosphate synthase |
| 5 | 0.0712 | slr0055 | trpG | 10011000000000001000 | anthranilate synthase component II |
| 6 | 0.0712 | slr2032 | ycf23 | 10011000000000001000 | hypothetical protein |
| Branch Nongreen algae (but no CyaPar) | |||||
| 1 | 0.1460 | — | cfxQ | 00010001000010001000 | rubisco expression protein |
| 2 | 0.1339 | — | ycf | 00010001000000001000 | hypothetical protein |
| 3 | 0.1192 | slr0228 | ftsH | 10010001000010011000 | cell division protein |
| 4 | 0.1192 | sll0020 | clpC | 10010001000010001010 | ATP-dep. translocation rel. protease, regulator |
| 5 | 0.1306 | sal2084 | acp | 10010001000010001000 | acyl carrier protein |
| 6 | 0.1306 | slr0833 | dnaB | 10010001000010001000 | replicative DNA helicase |
| 7 | 0.1306 | slr0737 | psaD | 10010001000010001000 | photosystem I subunit II |
| 8 | 0.1306 | slr1655 | psaL | 10010001000010001000 | photosystem I subunit XI |
| 9 | 0.1306 | sll1800 | rpl4 | 10010001000010001000 | 50S ribosomal protein L4 |
| 10 | 0.1306 | sll1821 | rpl13 | 10010001000010001000 | 50S ribosomal protein L13 |
| 11 | 0.1306 | sll1807 | rpl24 | 10010001000010001000 | 50S ribosomal protein L24 |
| 12 | 0.1306 | sar2799 | rpl27 | 10010001000010001000 | 50S ribosomal protein L27 |
| 13 | 0.1306 | sal3436 | rpl29 | 10010001000010001000 | 50S ribosomal protein L29 |
| 14 | 0.1306 | sal3445 | rpl31 | 10010001000010001000 | 50S ribosomal protein L31 |
| 15 | 0.1306 | sll0616 | secA | 10010001000010001000 | preprotein translocase subunit A |
| 16 | 0.1306 | sll0194 | ycf43 | 10010001000010001000 | hypothetical protein |
| 17 | 0.1306 | slr2087 | ycf44 | 10010001000010001000 | hypothetical protein |
| Branch Red algae (but no CyaPar) | |||||
| 1 | 0.0822 | sll0728 | accA | 10010000000000001000 | acetyl-CoA carboxylase alpha subunit |
| 2 | 0.0822 | slr0435 | accB | 10010000000000001000 | biotin carboxyl carrier of acetyl-CoA carboxy |
| 3 | 0.0822 | slr1898 | argB | 10010000000000001000 | N-acetylglutamate kinase |
| 4 | 0.0822 | sll1214 | AT103 | 10010000000000001000 | phytochrome-regulated gene |
| 5 | 0.0822 | sll1498 | carA | 10010000000000001000 | carbamoyl-phosphate synthetase subunit A |
| 6 | 0.0822 | slr2051 | cpcG | 10010000000000001000 | phycobilisome rod-core linker polypeptide |
| 7 | 0.0822 | sll0698 | dfr | 10010000000000001000 | drug sensory protein A |
| 8 | 0.0822 | sal0707 | glnB | 10010000000000001000 | nitrogen regulatory protein P-II |
| 9 | 0.0822 | sll1499 | gltB | 10010000000000001000 | ferredoxin-dependent glutamate synthase |
| 10 | 0.0822 | slr0974 | infC | 10010000000000001000 | initiation factor IF-3 |
| 11 | 0.0822 | sll1536 | moeB | 10010000000000001000 | molybdopterin biosynthesis protein |
| 12 | 0.0822 | sll1423 | ntcA | 10010000000000001000 | global nitrogen regulator |
| 13 | 0.0822 | slr1934 | pdhA | 10010000000000001000 | pyruvate dehydrogenase E1 component α sub |
| 14 | 0.0822 | sll1796 | petJ | 10010000000000001000 | cytochrome c553 |
| 15 | 0.0822 | slr0966 | trpA | 10010000000000001000 | tryptophan synthase α chain |
| 16 | 0.0822 | slr0623 | trxA | 10010000000000001000 | thioredoxin |
| 17 | 0.0822 | slr1780 | ycf | 10010000000000001000 | hypothetical protein |
| 18 | 0.0822 | sll1737 | ycf | 10010000000000001000 | hypothetical protein |
| 19 | 0.0822 | sll0558 | ycf | 10010000000000001000 | hypothetical protein |
| 20 | 0.0822 | sll1879 | ycf | 10010000000000001000 | hypothetical protein |
| Branch EugGra | |||||
| 1 | 0.0731 | — | ycf | 00000010000000000010 | hypothetical protein |
| 2 | 0.0731 | slr0913 | ycf | 10000010000000000000 | hypothetical protein |
| 3 | 0.0731 | slr0914 | ycf | 10000010000000000000 | hypothetical protein |
| Branch Green algae | |||||
| 1 | 0.1373 | sll1833 | fts1 | 10000000011000000000 | penicillin-binding protein |
| 2 | 0.1373 | slr1972 | ycf | 10000000011000000000 | hypothetical protein |
| 3 | 0.1333 | slr1455 | cysA | 10100000111000000000 | sulfate transport system permease protein |
| 4 | 0.1333 | slr1453 | cysT | 10100000111000000000 | sulfate transport system permease protein |
| 5 | 0.1064 | sll0289 | minD | 10100001011000000000 | septum site-determining protein |
| 6 | 0.1054 | slr0772 | chlB | 10101000111000011000 | protochlorophyllide reductase subunit B |
| 7 | 0.1054 | slr0749 | chlL | 10101000111000011000 | light-indep. protochlorophyllide reductase Fe |
| 8 | 0.0899 | slr0750 | chlN | 10101000011000011000 | protochlorophillide reductase subunit N |
| 9 | 0.0979 | sll1463 | ftsH | 10100000101000000000 | cell division protein |
| Branch Land plants | |||||
| 1 | 0.1017 | — | petL | 01000000101101110101 | cytochrome b6-f subunit VI |
| 2 | 0.1006 | — | ycf2 | 01000100000101000001 | hypothetical protein |
| 3 | 0.0965 | — | matK | 01000110100101110101 | maturase K |
| 4 | 0.0813 | — | ycf1 | 01100100111101010100 | hypothetical protein |
| 5 | 0.0970 | slr1281 | ndhJ | 11000000110101100101 | NADH dehydrogenase subunit J |
| 6 | 0.0921 | sll0519 | ndhA | 11000000111101100101 | NADH dehydrogenase subunit 1 |
| 7 | 0.0921 | sll0223 | ndhB | 11000000111101100101 | NADH dehydrogenase subunit 2 |
| 8 | 0.0921 | slr1279 | ndhC | 11000000111101100101 | NADH dehydrogenase subunit 3 |
| 9 | 0.0921 | slr0331 | ndhD | 11000000111101100101 | NADH dehydrogenase subunit 4 |
| 10 | 0.0921 | sll0522 | ndhE | 11000000111101100101 | NADH dehydrogenase subunit 4L |
| 11 | 0.0921 | slr0844 | ndhF | 11000000111101100101 | NADH dehydrogenase subunit 5 |
| 12 | 0.0921 | sll0521 | ndhG | 11000000111101100101 | NADH dehydrogenase subunit 6 |
| 13 | 0.0921 | slr0261 | ndhH | 11000000111101100101 | NADH dehydrogenase subunit 7 |
| 14 | 0.0921 | sll0520 | ndhI | 11000000111101100101 | NADH dehydrogenase subunit I |
| 15 | 0.0921 | slr1280 | ndhK | 11000000111101100101 | NADH dehydrogenase subunit K |
| 16 | 0.0878 | sml0003 | psbM | 11101000101101100101 | photosystem II M protein |
| EpiVir | |||||
| 1 | 0.0169 | — | ycf2 | 01000100000101000001 | hypothetical protein |
| 2 | 0.0119 | — | ycf1 | 01100100111101010100 | hypothetical protein |
| 3 | 0.0119 | — | matK | 01000110100101110101 | maturase K |
| 4 | 0.0119 | ssl3441 | infA | 10100100111000110101 | initiation factor IF-1 |
Genes acting as phylogenetic correlates, as derived from the factor analysis and DP scoring.
Table 5 shows 12 genes that are most specific to Cyanophora cpDNA and only common with Synechocystis: clpP, crtE, groES, hemA, mntA, mntB, nadA, and 5 hypothetical proteins. These genes could be considered as coding for the most conserved genes from the ancient chloroplast, among those that show variation. Among them, it is interesting the presence of clpP, a translocation-related protease, and groES, the small subunit of a main chaperonin. Both gene products are homologous to similar Escherichia coli prokaryotic proteins essential for proper protein translocation and folding. The large subunit of this chaperonin, groEL, is present in all nongreen algae but has disappeared in the rest of the higher plant genomes. The same occurs with dnaK, another chaperonin involved in protein folding after translation, and with secY, which with secA form the thylakoid membrane translocase system, similar to the one found in prokaryotes. These observations indicate a trend of gene loss toward land plant chloroplasts that first affects to the translation, translocation, and folding machinery. The deletion of an important number of ribosomal proteins also is in keeping with this observation. The ribosomal proteins specific from nongreen algae are rpl1, rpl3, rpl6, rpl11, rpl18, rps5, rps6, rps10, rps13, and rps17 (present also in Cyanophora) and rpl4, rpl13, rpl24, rpl27, rpl29, and rpl31 (excluded in Cyanophora). This significant amount of ribosomal proteins only present in the cpDNAs more similar to Synechocystis may reveal an ancient part of the ribosomal architecture. In higher plants, many of these functions are taken on by genes encoded in the nuclear genome.
Two other interesting genes are only present in Synechocystis and Cyanophora. These are the ones that form the manganese transporter system: mntA and mntB. Manganese is essential for oxygenic photosynthesis. It is quite feasible that ancient chloroplasts were in origin closer to nonoxygenic photosynthesis and that they acquired through evolution the ability for water splitting and oxygen production. Under these circumstances, it could have been useful to have manganese transporters to incorporate as much manganese as possible from the surrounding media, as this ion can by itself be an electron donor to photosystem II. Higher plants would have evolved toward a more sophisticated control and regulation of the manganese pool, avoiding having free manganese within the cells, perhaps due to its toxicity.
The most important phylogenetic correlate for nongreen algae chloroplasts is the rubisco expression protein (cfxQ; see Table 5), only present in genomes of nongreen algae (excluding Cyanophora). Thus, nongreen algae have incorporated through evolution a specific gene not present in cyanobacteria to control rubisco expression, an essential photosynthetic enzyme in charge of CO2 fixation (Choquet and Vallon 2000). Rubisco is the most abundant protein in the chloroplast and its expression is crucial for the photosynthetic machinery. It has two main subunits, rbcS and rbcL, both of which are encoded by the chloroplast genome in nongreen algae. However, in higher plants, the cell nucleus encodes the small rubisco subunit (rbcS; Whitney and Andrews 2001) and the nucleus has also taken responsibility in the control of rubisco expression because cfxQ is also lost in higher plants.
Other significant genes in nongreen algae are some subunits of major protein complexes: psaD and pasL, which are not present in Cyanophora; psaE and psaF, all included in photosystem I complex; psbW, psbV, and psbY, from photosystem II; and atpD and atpG from ATPase. These subunits are not present in the cpDNAs of more evolved plants, and in this way they show some functions that may have been lost during evolution or which may have been replaced by better regulated subunits. This is, for example, the case of psbV, a subunit lost in the extrinsic part of the oxygen-evolving complex of higher plants. The plants have instead acquired two other polypeptides (psbP and psbQ) that stabilize the manganese cluster and are encoded by the nucleus of the plant cell (Shen et al. 1995).
The red algae constitute a subgroup inside the nongreen algae, but they have some genes that are unique to their cpDNAs. The most significant of them are genes related to the phycobilisome architecture and function: apcA, apcB, and apcE. Another significant type of genes characteristic of red algae, but not included in Cyanophora cpDNA, are genes involved in different biosynthetic pathways, such as the biosynthesis of fatty acids accA and accB and synthesis of amino acids argB, glnB, gtlB, and trpA.
The genes best identified as phylogenetic correlates within green algae cpDNAs are several genes involved in the synthesis of chlorophyll—chlB, chlL, and chlN—and two genes involved in sulfate absorption—cysA and cysT (see Table 5). Many of the green algae are unicellular organisms that need to take nutrients from the aquatic environment. Sulfate is one of these important nutrients. Most of the absorption and nutritional functions are coded by nuclear genes in higher pluricellular plants. In fact, in land plants the root cells are specialized to carry out such functions.
The following phylogenetic correlates (see Table 5) were identified in the case of land plant chloroplast genomes: maturase (matK), NADH dehydrogenase (ndhA, B, C, D, E, F, G, H, I, J, and K), one subunit of cytochrome b6/f (petL), and another subunit from photoystem II (psbM). The presence of maturase is a distinct feature in higher land plants directly related with the appearance of introns (see Table 1; Wolfe et al. 1991). The requirement of a correct translation for genes with introns in plant chloroplasts may have forced incorporation of maturase into these cpDNAs. On the other hand, appearance of new specific subunits to multienzymatic protein complexes, like cytochrome b6/f and photosystem II, indicate that the selected genes (petL and psbM) are incorporated later than the other common subunits to the plant cpDNAs. They correspond to subunits carrying some new regulatory function. The petL subunit is only present in land plants and contrasts with two other cytochrome b6/f subunits that are only present in nongreen algae: petF and petM. Recent work has shown that petM is involved in cytochrome b6/f regulation in cyanobacteria (Schneider et al. 2001). Finally, the presence of NADH dehydrogenase in land plants, and also in cyanobacteria but not in any algae, may be related to the control of redox equilibrium. Oxyphotosynthetic organisms avoid photoinhibition and inconvenient oxidations through different mechanisms (Aro et al. 1993; De Las Rivas et al. 1993), but although in vivo algae have many potential mechanisms to avoid photoinhibition, static land plants may need better controlled mechanisms that involve the incorporation of specific molecular systems. Maintenance in the land plant chloroplasts of an alternative redox enzyme like NADH dehydrogenase, also present in the cyanobacteria, will most probably be related with such protection and balancing mechanisms (Allen and Pfannschmidt 2000). The ndh chloroplastic genes have certain homology to genes encoding subunits of the NADH ubiquinone oxidoreductase (complex I) of mitochondria and eubacteria and they could be involved in a proposed chloroplast respiratory chain (Burrows et al. 1998).
Finally, the phylogenetic correlates for E. gracilis and E. virginiana cpDNAs are also included in Table 5. For Euglena not much can be said because all correspond to hypothetical proteins. E. virginiana, on the other hand, is a parasitic flowering plant that lacks most of the photosynthetic genes, but it is remarkable that it conserves, as phylogenetic correlates, three of the genes that best define land plants in chloroplast genomes: ycf1, ycf2, and matK. This probably indicates that Epifagus cpDNA was once a real chloroplast genome that has suffered a strong positive selection in its parasitic ecosystem (Wolfe et al. 1992).
Clustering of Phylogenetic Profiles
The clustering method automatically classifies genes in the score matrix within nine groups. The main results from the clustering analysis can be found in Table 6, which presents the proportion of a subset of selected complexes or functional units in each cluster. Complexes selected to test the ability of the clustering procedure are indicated in Methods. Figure 4 presents the three-dimensional plots of the relative position in a three-dimensional projection of the original euclidian space spanned by the 20 genomes (Fig. 4A,B), along with the position of the nine gene clusters (Fig. 4C,D). As can be seen in Table 6A, the method locates in cluster number 9 a hypothetical photosyntetic chloroplast core, composed by a major number of subunits from ATPase, photosystem II (PSII), and cytochrome b6f (Cytb6f) and by important populations of photosystem I (PSI) and ribosomal proteins (RibProt). The other clusters include proteins or polypeptides characteristic of specific groups of organisms. For example, cluster number 1 contains a significant proportion of photosystem I subunits (33.33%) and ribosomal proteins (46.51%), specific of nongreen algae; cluster no.; 3 includes a major proportion of phycobilisome (Phyb) proteins (77.78%) representing mainly red algae; and cluster number 5 includes all NADH dehydrogenase (NADHase) proteins (100%) representing land plants. The rest of the clusters are less significantly assigned to one group of organisms. The method also clearly identifies in which functional units a specific loss of proteins or subunits occur along the evolution. Thus, in cluster number 1 it can be observed that two main complexes (PSI and ribosome) suffer a strong reduction of genes when passing from nongreen algae to green plants (see Table 6C).
Table 6.
Gene Clusters Deduced from the X-Matrix, for a Selected Set of Complexes/Functional Units
| A. Percentage of each complex accumulated in each one of the nine clusters | ||||||||||
| Complexes | Cluster No.No. of Prot. | 1 51 | 2 55 | 3 58 | 4 12 | 5 17 | 6 6 | 7 15 | 8 9 | 9 54 |
|---|---|---|---|---|---|---|---|---|---|---|
| PSI | 12 | 33.33 | 8.33 | 8.33 | 0 | 0 | 0 | 0 | 8.33 | 41.67 |
| PSII | 18 | 16.67 | 0 | 5.56 | 0 | 5.56 | 0 | 0 | 0 | 72.22 |
| ATPase | 8 | 25 | 0 | 0 | 0 | 0 | 0 | 0 | 0 | 75 |
| Cytb6f | 6 | 16.67 | 0 | 0 | 0 | 0 | 0 | 16.67 | 0 | 66.67 |
| NADHase | 11 | 0 | 0 | 0 | 0 | 100 | 0 | 0 | 0 | 0 |
| Phyb | 9 | 11.11 | 11.11 | 77.78 | 0 | 0 | 0 | 0 | 0 | 0 |
| RibProt | 43 | 46.51 | 4.65 | 2.33 | 0 | 2.33 | 0 | 0 | 9.3 | 34.88 |
| RNAApol | 4 | 0 | 0 | 0 | 0 | 0 | 0 | 0 | 0 | 100 |
| CellDiv | 5 | 20 | 40 | 0 | 40 | 0 | 0 | 0 | 0 | 0 |
| HypoProt | 73 | 8.22 | 30.14 | 24.66 | 2.74 | 1.37 | 6.85 | 17.81 | 1.37 | 6.85 |
| B. Weight (in percentage) of each complex within each of the clusters | ||||||||||
| Complexes | Cluster No.No. of Prot. | 1 51 | 2 55 | 3 58 | 4 12 | 5 17 | 6 6 | 7 15 | 8 9 | 9 54 |
| PSI | 12 | 7.84 | 1.82 | 1.72 | 0 | 0 | 0 | 0 | 11.11 | 9.26 |
| PSII | 18 | 5.88 | 0 | 1.72 | 0 | 5.88 | 0 | 0 | 0 | 24.07 |
| ATPase | 8 | 3.92 | 0 | 0 | 0 | 0 | 0 | 0 | 0 | 11.11 |
| Cytb6f | 6 | 1.96 | 0 | 0 | 0 | 0 | 0 | 6.67 | 0 | 7.41 |
| NADHase | 11 | 0 | 0 | 0 | 0 | 64.71 | 0 | 0 | 0 | 0 |
| Phyb | 9 | 1.96 | 1.82 | 12.07 | 0 | 0 | 0 | 0 | 0 | 0 |
| RibProt | 43 | 39.22 | 3.64 | 1.72 | 0 | 5.88 | 0 | 0 | 44.44 | 27.78 |
| RNApol | 4 | 0 | 0 | 0 | 0 | 0 | 0 | 0 | 0 | 7.41 |
| CellDiv | 5 | 1.96 | 3.64 | 0 | 16.67 | 0 | 0 | 0 | 0 | 0 |
| HypoProt | 73 | 11.76 | 40 | 31.03 | 16.67 | 5.88 | 83.33 | 86.67 | 11.11 | 9.26 |
| C. Recovery of original complexes in the clusters and Purity inside the clusters | ||||||||||
| Cluster No. | Complexes | −1n(P-value) >3 | Recovery % | Purity % | HypoProt % | Organisms best represented in each cluster | ||||
| Synecho. | Nongreen algae | Red algae | Green algae | Land plants | ||||||
| 1 | RiPr | 4.09 | 46.51 | 39.22 | 8.22 | × | × | |||
| 3 | Phyb | 3.12 | 77.78 | 12.07 | 24.66 | × | ||||
| 4 | CellDiv | (2.9) | 40 | 16.67 | 2.74 | × | ||||
| 5 | NADHase | 11.01 | 100 | 64.71 | 1.37 | × | × | |||
| 9 | PSII | 4.72 | 72.22 | 24.07 | 6.85 | × | × | × | × | × |
| Total | All clusters | >3 | 73.05 | 36.45 | ||||||
Cluster analysis of genes as deduced from the scores matrix. The optimal number of clusters was found to be equal to nine. Tables include data about nine well-known chloroplast complexes (see Methods) and the hypothetical proteins. (A) Percentage of each complex accumulated in each one of the nine clusters obtained. (B) Percentage of weight of each complex within each one of the clusters. (C) The most relevant functional units as detected with the parameter of the statistical significance (P-value < 10−3). The P-value was derived assuming a background Poisson distribution (J.J. Lozano and A.R. Ortiz, in prep.). %R is the percentage of recovery of original complexes in the clusters. %P is the purity inside the clusters. %H is the percentage of functionally unknown proteins. Groups of genomes maximally represented in each cluster are marked by ×'s on the right of the table.
Figure 4.

(A) and (B) Projections of the 20 analyzed genomes on the first three factors. Unicellular nongreen algae are shown in red triangles. Green algae and superior plants are in green diamonds. Parasite chloroplasts are in yellow triangles. Cyanobacteria is in solid circles. (C) and (D) Projections of the nine clusters of 20 analyzed genome orthologous groups. The same approximate view of A (in C) and B (in D) is used for comparison. Each cluster is shown with a color-symbol pair: 1, red circles; 2, blue diamonds; 3, red squares; 4, light blue triangles; 5, green squares; 6, yellow triangles; 7, green inverted triangles; 8, purple diamonds; 9, black triangles.
Finally, in these analyses the quality of the functional recovery and purity of the clusters has been measured. The method allows a recovery of 73.0% of the original functional associations in the clusters for the statistically significant associations (those with P-value < 10−3). The percentage of proteins belonging to one specific functional unit is 36.4% within the nine clusters produced. The specificity level seems to be high enough to allow prediction of tentative functional associations for hypothetical proteins. For example, the following proteins in nongreen algae present exactly the same set of scores in the X-matrix: 30S ribosomal protein S20 (rps20), 50S ribosomal protein L34 (rpl34), 50S ribosomal protein L35 (rpl35), and two ycf proteins (ycf33 and ycf35). On the basis of our results, it is tempting to speculate that ycf33 and ycf35 are ribosomal or translation-related proteins.
Conclusions
A set of recently developed methods for function annotation and genome comparison has been applied to a series of 19 chloroplast genomes. Genome annotation using these methods has proved to be very reliable, providing high confidence functional assignments for an average of 81% of the proteins in chloroplast genomes. Multivariate analysis of a binary data matrix derived from these genomes has allowed us to derive rather accurate phylogenetic relationships between them at the genome level. One of the most interesting features of such analysis is the possibility of detecting genes acting as phylogenetic correlates, genes critical to the formation of the observed tree topology. These genes are, from a mathematical perspective, responsible of the tree topology and, on the basis of the quality of the tree, possibly related to speciation from a biological viewpoint. Therefore, this type of analysis has the potential to help uncover the evolutionary forces shaping the organisms and their adaptative responses through the modification of their biochemical systems. In the case of chloroplasts, we have found in our analysis that these genes acting as phylogenetic actually form part of important components of the chloroplast biochemical machinery.
It is important to emphasize that the phylogenetic correlates should not be identified with genes that lead the way in evolution. A more plausible mechanism is that gain/loss of function would follow adjustments to new environments, which, by imposing a selective pressure, can select subpopulations generated by a random process. However, by studying them it may be possible to infer what general environmental selective pressure could operate in the different lineages. From our analysis, one of the driving forces in the evolution of green algae and plant chloroplasts appear to be the acquisition of molecular systems providing higher levels of regulation, probably with increasing levels of involvement by the genome from the host cell. This increased level of regulation appears to be reflected at two levels: First, regulatory units appear to be added to the energy generating complexes, along with specific molecular systems to control photooxidative stress. Second, at the same time an eukaryote-like genome organization of the chloroplast genome is developed, changing the translation and translocation machinery and incorporating intron-processing enzymes such as maturase, presumably for all to have a higher level of synchronization between the gene expression of the photosynthetic apparatus and the host genes. It is obvious that a better understanding of these processes, in addition to the insight gained in basic biological processes, can have enormous impact in genetic engineering and biotechnology. We have shown that comparative genomics is a powerful tool toward that goal.
METHODS
Genome Data Set
At the time of conducting this work 17 cpDNA had been fully sequenced. They correspond to eight land plants (Arabidopsis thaliana, Marchantia polymorpha, Nicotiana tabacum, Oenothera elata, Oryza sativa, P. thunbergii, Spinacia oleracea, and Zea mays); three green algae (C. vulgaris, Mesostigma viride, and N. olivacea); one Euglenophyta (E. gracilis); two Rhodophyta or red algae (C. caldarium and P. purpurea); one Bacillariophyta (O. sinensis); one Cryptophyta (G. theta); and one Glaucocystophyceae (C. paradoxa). The complete proteomes of the plastid genomes from two nonphotosynthetic parasites were also available and were also included in this study: One is from the protozoan parasite T. gondii and the other from the parasitic flowering plant E. virginiana. These two genomes were included due to their functional similarities and evolutionary relationships to cpDNA. The E. virginiana chloroplast genome lacks the main photosynthetic genes (Wolfe et al. 1992). The T. gondii one cannot be considered a true chloroplast genome, but it can be considered a plastid genome of probable green algal origin (Kohler et al. 1997). All genome sequences were downloaded from http://www.ncbi.nlm.nih.gov/PMGifs/Genomes/plastids_tax.html.
Functional Annotations
Functional annotations of ORFs derived from the complete chloropast genomes were carried out with a recently developed computer program for functional annotation (Fabrega et al. 2001). This program finds pairs or orthologs in two different genomes, A and B. To do so, each of the N sequences in genome A is scanned against all other M sequences in genome B. Pairs of sequences are aligned using the Needleman and Wunsch algorithm with zero end gaps with a normalized Gonnet matrix (Gonnet et al. 1992). After the scanning step, an orthology likelihood score (μ-score) for ORF i in genome A is defined as
 |
1 |
In turn, each of the scores σij are defined as the number of times the sequence similarity between sequences i and j exceeds the expected minimum value of the score consistent with a common fold: sc(ni,mj), where ni is the length of sequence i and mj is the length of sequence j, as derived from training sets of sequence-structure matches by Abagyan and Batalov (1997):
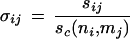 |
2 |
The cutoff value in the μ-score (μc) needed for the pair to have the same function is then obtained by finding the value in the μ-score providing optimal discrimination between proteins with the same and proteins with different functions in two given genomes. This was done as follows: A training set of known pairs of orthologs between both genomes is first derived. Then, the frequency distribution of true-positives and true-negatives as a function of the μ-score is computed. The μ-score value at which optimal discrimination is observed is finally chosen as the cutoff μc. Then, a protein i in genome A has an ortholog in genome B if μi > μc. Previous use of this technique in the comparison of the Methanococcus jannaschii genome with the genomes of E. coli, Bacillus subtilis, and Haemophilus influenzae gave a value for μc of ∼2.5 (Fabrega et al. 2001). Similar computations reported in this paper using the set of chloroplast genomes have shown that 2.5 is a safe cutoff to obtain all true-positives with a negligible amount of false-negatives, but it is possible to lower the threshold to ∼1.9, in this case keeping a correctness level above 80%.
Construction of the X-Matrix
A matrix of orthologous chloroplast proteins was then constructed based on the above results of pairwise genome comparisons using a simple binary count for the presence (1) or absence (0) of a given ortholog. In this way, a matrix was built that had 20 columns (Synechocystis and 19 cpDNA species) and 277 lines, corresponding to 277 different orthologous groups (i.e., COGs). The matrix was built first by automatically including all the 1837 proteins with μ-score ≥2.5 (this gave a set of 286 lines) and secondly by manual correction of some lines to include proteins well annotated between μ-score 2.5 and 1.9 (this reduced the total set to 277 lines). The matrix designed was of the 101 type, meaning that each group of orthologous should have a member in at least two cpDNAs or in one cpDNA and in the Synechocystis genome. In this way, COGs present in only one species (lines type 100) or COGs present in all species (lines type 111) were discarded. COGs of the type 100 were not adequate to study pairwise relationships between genomes. Type 111 corresponds to functions present in all the cpDNAs and therefore did not include any differential information for the matrix. The 101-type matrix seems to provide the best equilibrium between variability and conservation.
Factor Analysis of the X-Matrix
Factor analysis (FA; Reyment and Joreskog 1996) was used for the comparative genomics studies. FA seeks to find an underlying orthogonal factor model of an original X-matrix (in this case our 101 matrix) of the form
 |
3 |
where L is the loadings matrix, F the scores matrix, and E is the residual matrix. Principal components analysis (PCA) was used to obtain a solution of the factor model given by equation 3. First, the loadings were obtained by scaling the eigenvector matrix (P) obtained from PCA:
 |
4 |
A lower dimensionality space was chosen from the optimal number of dimensions that explain most of the variance of the original X-matrix. After this, we proceeded to rotate the factors by means of a varimax rotation (Reyment and Joreskog 1996). Then the scores matrix was generated by an ordinary (unweighted) least squares procedure:
 |
5 |
where P* are the rotated eigenvectors and the prime denotes the transpose.
Phylogenetic Reconstruction
Phylogenetic trees of the genomes studied were derived by clustering genomes in the loadings space with a neighbor-joining method (Saitou and Nei 1987). To generate the distance matrix needed in the neighbor-joining algorithm, we used the distribution of points representing the organisms in the space given by the loadings matrix at the optimal dimensionality found by FA (i.e., the dimensionality at which the eigenvalue of 1 is reached). In this space euclidean distances between each pair of genome loadings were calculated. Once the main tree was built, an estimation of confidence or reliability of each branch was obtained by means of a jackknife bootstrap analysis using 1000 replicates. Bootstrap values were computed by selecting random subsets of 75% of the genes per genome (Durbin et al. 1998), reanalyzing the new X-matrix by FA and recalculating the trees. Distribution of trees and frequency of each branch in the original tree were recorded using the CONSENSE program included in PHYLIP software package (Felsenstein 1996).
Detection of Phylogenetic Correlates and Gene Clustering
The FA results can be used to identify the specific COGs or groups of proteins contributing heavily to the specific character of different species, as inferred from the phylogenetic analysis. This is done here as follows: The values of the loadings at each dimension k are transformed to fingerprints by translating them to a binary form—1 when the value is >0.5 and 0 otherwise, forming a vector. These patterns can be correlated with the patterns of presence/absence of the genes used to build up the original X-matrix, so that the specific genes that best define each dimension can be identified. For each variable (i.e., each COG in the X-matrix) i, with a profile in the X-matrix, and at each dimension k, we compute the phylogenetic correlates (i.e., the variables mainly responsible for discrimination in that dimension) as the 10% upper-ranking COGs obtained according to the following dot product (DP):
 |
6 |
Study of Functional Linkages
It has been suggested that functionally linked proteins tend to co-evolve, displaying patterns of correlation according to their presence or absence in a set of genomes. Consequently, this form of co-evolution could be detected using a bit-like representation of the genomes (Pellegrini et al. 1999), in a similar way to the one used here to create the X-matrix. We have tested the ability of our method to detect these functional associations using the scores derived from FA, as the projection into a low dimensional space should provide a better metric to establish these associations, and the chloroplast genomes are a good model system for such study.
We have clustered the elements of the scores matrix at the optimal dimensionality using two agglomerative methods sequentially. The procedure includes first the Ward algorithm (Ward 1963) to determine the set of centroids from the cloud of points and then the derivation of the members connected to each centroid by using a k-means algorithm (Johnson and Wichern 1992). As the optimal number of clusters is unknown, a stopping rule for determining the optimum number of clusters (in the interval of 5 to 50 clusters) must be employed. The figure of merit we have used in the stopping rule is the C-index (Milligan 1980), defined as
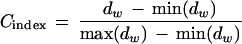 |
7 |
where dw is the sum of within-cluster distances (a within-cluster is the squared euclidean distance between a case and its centroid). The cluster distribution yielding the smallest value of the C-index is considered optimal. Although we have not evaluated this algorithm extensively, it seems to provide satisfactory results.
Further, we have checked the significance of the observed clustering. For that, we have centered our study in the ability of the clustering procedure to classify well-defined macromolecular functional complexes present in chloroplasts. These complexes are as follows: photosystem I (which includes 12 polypeptides, genes psa-); photosystem II (18 polypeptides, genes psb-); ATPase (8 polypeptides, genes atp-); cytochrome b6/f complex (6 polypeptides, genes pet-); NADH dehydrogenase (11 polypeptides, genes ndh-); phycobilisoma (9 polypeptides, genes apc-, cpc-, and nbl); ribosome (43 ribosomal proteins, genes rpl- and rps-); RNA polymerase (4 polypeptides, genes rpo-); and cell division proteins (5 polypeptides, genes fts- and min-). Thus, we have used a test set of 116 polypeptides divided into nine different complexes or functional units, which include 42% of the full COGs matrix constructed and represent a model plant chloroplast genome that will have ∼100 proteins. We evaluated the performance of the clustering procedure by monitoring two parameters: the recovery of a given complex in a given cluster, expressed as a percentage (%R), and the purity in a given functional complex of a specific cluster, expressed as a percentage (%P). Thus, the former informs about the ability of the clustering procedure to concentrate the elements of a functional complex in a cluster, whereas the latter informs about the specificity of the cluster toward a given complex. The two parameters are computed as
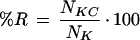 |
8 |
 |
9 |
where NKC are the number of COGs from macromolecular complex K observed in cluster C; NK is the number of COGs comprising complex K and NC is the number of COGs in cluster C.
WEB SITE REFERENCES
http://alice.usal.es/cpDNA20x277matrix
http://www.kazusa.or.jp/cyano/; CyanoBase database.
http://www.ncbi.nlm.nih.gov/COG/; COGs database.
Acknowledgments
This work was supported by Mount Sinai start-up funds (ARO). J.D.L.R. acknowledges a short-term fellowship from OCDE and support from the Spanish government (grant MCT-DGI-PGC, PB98–0480). J.J.L. is a NATO postdoctoral fellow.
The publication costs of this article were defrayed in part by payment of page charges. This article must therefore be hereby marked “advertisement” in accordance with 18 USC section 1734 solely to indicate this fact.
Footnotes
E-MAIL ortiz@inka.mssm.edu; FAX 212-860-3369.
Article and publication are at http://www.genome.org/cgi/doi/10.1101/gr.209402.
REFERENCES
- Abagyan RA, Batalov S. Do aligned sequences share the same fold? J Mol Biol. 1997;273:355–368. doi: 10.1006/jmbi.1997.1287. [DOI] [PubMed] [Google Scholar]
- Adachi J, Waddell PJ, Martin W, Hasegawa M. Plastid genome phylogeny and a model of amino acid substitution for proteins encoded by chloroplast DNA. J Mol Evol. 2000;50:348–358. doi: 10.1007/s002399910038. [DOI] [PubMed] [Google Scholar]
- Allen JF, Pfannschmidt T. Balancing the two photosystems: Photosynthetic electron transfer governs transcription of reaction centre genes in chloroplasts. Philos Trans R Soc Lond B Biol Sci. 2000;355:1351–1359. doi: 10.1098/rstb.2000.0697. [DOI] [PMC free article] [PubMed] [Google Scholar]
- Altschul SF, Madden TL, Schaffer AA, Zhang J, Zhang Z, Miller W, Lipman DJ. Gapped BLAST and PSI-BLAST: A new generation of protein database search programs. Nucleic Acids Res. 1997;25:3389–3402. doi: 10.1093/nar/25.17.3389. [DOI] [PMC free article] [PubMed] [Google Scholar]
- Andrade MA, Sander C. Bioinformatics: From genome data to biological knowledge. Curr Opin Biotechnol. 1997;8:675–683. doi: 10.1016/s0958-1669(97)80118-8. [DOI] [PubMed] [Google Scholar]
- The Arabidopsis Initiative. Analysis of the genome sequence of the flowering plant Arabidopsis thaliana. Nature. 2000;408:796–815. doi: 10.1038/35048692. [DOI] [PubMed] [Google Scholar]
- Aro E-M, Virgin I, Andersson B. Photoinhibition of photosystem II. Inactivation, protein damage and turnover. Biochim Biophys Acta. 1993;1143:113–134. doi: 10.1016/0005-2728(93)90134-2. [DOI] [PubMed] [Google Scholar]
- Baena-Gonzalez E, Gray JC, Tyystjarvi E, Aro E-M, Maenpaa P. Abnormal regulation of photosynthetic electron transport in a chloroplast ycf9 inactivation mutant. J Biol Chem. 2001;276:20795–20802. doi: 10.1074/jbc.M101255200. [DOI] [PubMed] [Google Scholar]
- Bauer J, Hiltbrunner A, Kessler F. Molecular biology of chloroplast biogenesis: Gene expression, protein import and intraorganellar sorting. Cell Mol Life Sci. 2001;58:420–433. doi: 10.1007/PL00000867. [DOI] [PMC free article] [PubMed] [Google Scholar]
- Bork P, Dandekar T, Diaz-Lacoz Y, Eisenhaber F, Huynen M, Yuan Y. Predicting function: From genes to genomes and back. J Mol Biol. 1998;283:707–725. doi: 10.1006/jmbi.1998.2144. [DOI] [PubMed] [Google Scholar]
- Burrows PA, Sazanov LA, Svab Z, Maliga P, Nixon PJ. Identification of a functional respiratory complex in chloroplasts through analysis of tobacco mutants containing disrupted plastid ndh genes. EMBO J. 1998;17:868–876. doi: 10.1093/emboj/17.4.868. [DOI] [PMC free article] [PubMed] [Google Scholar]
- Cavalier-Smith T. Membrane heredity and early chloroplast evolution. Trends Plant Sci. 2000;5:174–182. doi: 10.1016/s1360-1385(00)01598-3. [DOI] [PubMed] [Google Scholar]
- Choquet Y, Vallon O. Synthesis, assembly and degradation of thylakoid membrane proteins. Biochimie. 2000;82:615–634. doi: 10.1016/s0300-9084(00)00609-x. [DOI] [PubMed] [Google Scholar]
- De Las Rivas J, Shipton CA, Ponticos M, Barber J. Acceptor side mechanism of photoinduced proteolysis of the D1 protein in photosystem II reaction centers. Biochemistry. 1993;32:6944–6950. doi: 10.1021/bi00078a019. [DOI] [PubMed] [Google Scholar]
- Douglas SE, Penny SL. The plastid genome of the cryptophyte alga, Guillardia theta: Complete sequence and conserved synteny groups confirm its common ancestry with red algae. J Mol Evol. 1999;48:236–244. doi: 10.1007/pl00006462. [DOI] [PubMed] [Google Scholar]
- Douglas S, Zauner S, Fraunholz M, Beaton M, Penny S, Deng LT, Wu X, Reith M, Cavalier-Smith T, Maier UG. The highly reduced genome of an enslaved algal nucleus. Nature. 2001;410:1091–1096. doi: 10.1038/35074092. [DOI] [PubMed] [Google Scholar]
- Drescher A, Ruf S, Calsa T, Jr, Carrer H, Bock R. The two largest chloroplast genome-encoded open reading frames of higher plants are essential genes. Plant J. 2000;22:97–104. doi: 10.1046/j.1365-313x.2000.00722.x. [DOI] [PubMed] [Google Scholar]
- Durbin R, Eddy S, Krogh A, Mitchison G. Biological sequence analysis. Probabilistics models of proteins and nucleic acids. Cambridge, UK: Cambridge University Press; 1998. [Google Scholar]
- Eisenberg D, Marcotte EM, Xenarios I, Yeates TO. Protein function in the post-genomic era. Nature. 2000;405:823–826. doi: 10.1038/35015694. [DOI] [PubMed] [Google Scholar]
- Fabrega C, Farrow MA, Mukhopadhyay B, de Crecy-Lagard V, Ortiz AR, Schimmel P. An aminoacyl tRNA synthetase whose sequence fits into neither of the two known classes. Nature. 2001;411:110–114. doi: 10.1038/35075121. [DOI] [PubMed] [Google Scholar]
- Felsenstein J. Inferring phylogenies from protein sequences by parsimony, distance, and likelihood methods. Methods Enzymol. 1996;266:418–427. doi: 10.1016/s0076-6879(96)66026-1. [DOI] [PubMed] [Google Scholar]
- Gonnet GH, Cohen MA, Benner SA. Exhaustive matching of the entire protein sequence database. Science. 1992;256:1443–1445. doi: 10.1126/science.1604319. [DOI] [PubMed] [Google Scholar]
- Goulding SE, Olmstead RG, Morden CW, Wolfe KH. Ebb and flow of the chloroplast inverted repeat. Mol Gen Genet. 1996;252:195–206. doi: 10.1007/BF02173220. [DOI] [PubMed] [Google Scholar]
- Gray MW. Evolution of organellar genomes. Curr Opin Genet Dev. 1999;9:678–687. doi: 10.1016/s0959-437x(99)00030-1. [DOI] [PubMed] [Google Scholar]
- Hallick RB, Hong L, Drager RG, Favreau MR, Monfort A, Orsat B, Spielmann A, Stutz E. Complete sequence of Euglena gracilis chloroplast DNA. Nucleic Acids Res. 1993;21:3537–3544. doi: 10.1093/nar/21.15.3537. [DOI] [PMC free article] [PubMed] [Google Scholar]
- Johnson RA, Wichern DW. Applied Multivariate Statistical Analysis. Upper Saddle River, NJ: Prentice Hall; 1992. [Google Scholar]
- Kohler S, Delwiche CF, Denny PW, Tilney LG, Webster P, Wilson RJ, Palmer JD, Roos DS. A plastid of probable green algal origin in Apicomplexan parasites. Science. 1997;275:1485–1489. doi: 10.1126/science.275.5305.1485. [DOI] [PubMed] [Google Scholar]
- Kowallik KV, Stoebe B, Schaffran I, Kroth-Pancic P, Freier U. The chloroplast genome of a chlorophyll a+c-containing alga, Odontella sinensis. Plant Mol Biol Rep. 1995;13:336–342. [Google Scholar]
- Lemieux C, Otis C, Turmel M. Ancestral chloroplast genome in Mesostigma viride reveals an early branch of green plant evolution. Nature. 2000;403:649–652. doi: 10.1038/35001059. [DOI] [PubMed] [Google Scholar]
- Martin W, Stoebe B, Goremykin V, Hansmann S, Hasegawa M, Kowallik KV. Gene transfer to the nucleus and the evolution of chloroplasts. Nature. 1998;393:162–165. doi: 10.1038/30234. [DOI] [PubMed] [Google Scholar]
- Milligan GW. An examination of the effect of six types of error perturbation on fifteen clustering algorithms. Psychometrika. 1980;45:325–342. [Google Scholar]
- Moreira D, Le Guyader H, Phillippe H. The origin of red algae and the evolution of chloroplasts. Nature. 2000;405:69–72. doi: 10.1038/35011054. [DOI] [PubMed] [Google Scholar]
- Muller A, MacCallum RM, Sternberg MJ. Benchmarking PSI-BLAST in genome annotation. J Mol Biol. 1999;293:1257–1271. doi: 10.1006/jmbi.1999.3233. [DOI] [PubMed] [Google Scholar]
- Pellegrini M. Computational methods for protein function analysis. Curr Opin Chem Biol. 2001;5:46–50. doi: 10.1016/s1367-5931(00)00165-4. [DOI] [PubMed] [Google Scholar]
- Pellegrini M, Marcotte EM, Thompson MJ, Eisenberg D, Yeates TO. Assigning protein functions by comparative genome analysis: Protein phylogenetic profiles Proc. Natl Acad Sci. 1999;96:4285–4288. doi: 10.1073/pnas.96.8.4285. [DOI] [PMC free article] [PubMed] [Google Scholar]
- Provan J, Powell W, Hollingsworth PM. Chloroplast microsatellites: New tools for studies in plant ecology and evolution. Trends Ecol Evol. 2001;16:142–147. doi: 10.1016/s0169-5347(00)02097-8. [DOI] [PubMed] [Google Scholar]
- Reyment R, Joreskog KG. Applied Factor Analysis in the Natural Sciences. Cambridge: Cambridge University Press; 1996. [Google Scholar]
- Rochaix JD. Chloroplast. In: Creighton TE, editor. Encyclopedia of Molecular Biology. New York: J. Wiley & Sons, Inc.; 1999. pp. 433–439. [Google Scholar]
- Saitou N, Nei M. The neighbor-joining method: A new method for reconstructing phylogenetic trees. Mol Biol Evol. 1987;4:406–425. doi: 10.1093/oxfordjournals.molbev.a040454. [DOI] [PubMed] [Google Scholar]
- Schneider D, Berry S, Rich P, Seidler A, Rogner M. A regulatory role of the PetM subunit in a cyanobacterial cytochrome b6f complex. J Biol Chem. 2001;276:16780–16785. doi: 10.1074/jbc.M009503200. [DOI] [PubMed] [Google Scholar]
- Shen JR, Burnap RL, Inoue Y. An independent role of cytochrome c550 in cyanobacterial photosystem II as revealed by double-deletion mutagenesis of the psbO and psbV genes in Synechocystis sp PCC 6803. Biochemistry. 1995;34:12661–12668. doi: 10.1021/bi00039a023. [DOI] [PubMed] [Google Scholar]
- Stoebe B, Kowallik KV. Gene-cluster analysis in chloroplast genomics. Trends Genet. 1999;15:344–347. doi: 10.1016/s0168-9525(99)01815-6. [DOI] [PubMed] [Google Scholar]
- Sugiura M. The chloroplast genome. Essays Biochem. 1995;30:49–57. [PubMed] [Google Scholar]
- Sugiura M, Hirose T, Sugita M. Evolution and mechanism of translation in chloroplasts. Annu Rev Genet. 1998;32:437–459. doi: 10.1146/annurev.genet.32.1.437. [DOI] [PubMed] [Google Scholar]
- Swiatek M, Kuras R, Sokolenko A, Higgs D, Olive J, Cinque G, Muller B, Eichacker LA, Stern DB, Bassi R, et al. The chloroplast gene ycf9 encodes a photosystem II (PSII) core subunit, PsbZ, that participates in PSII supramolecular architecture. Plant Cell. 2001;13:1347–1367. doi: 10.1105/tpc.13.6.1347. [DOI] [PMC free article] [PubMed] [Google Scholar]
- Tomitani A, Okada K, Miyashita H, Matthijs HC, Ohno T, Tanaka A. Chlorophyll b and phycobilins in the common ancestor of cyanobacteria and chloroplasts. Nature. 1999;400:159–162. doi: 10.1038/22101. [DOI] [PubMed] [Google Scholar]
- Turmel M, Otis C, Lemieux C. The complete chloroplast DNA sequence of the green alga Nephroselmis olivacea: Insights into the architecture of ancestral chloroplast genomes. Proc Natl Acad Sci. 1999;96:10248–10253. doi: 10.1073/pnas.96.18.10248. [DOI] [PMC free article] [PubMed] [Google Scholar]
- Ward JH. Hierarchical grouping to optimize an objective function. J Am Statistic Assoc. 1963;58:236–244. [Google Scholar]
- Whitney S, Andrews T. The gene for the ribulose-1,5-bisphosphate carboxylase/oxygenase rubisco. Small subunit relocated to the plastid genome of tobacco directs the synthesis of small subunits that assemble into rubisco. Plant Cell. 2001;13:193–205. doi: 10.1105/tpc.13.1.193. [DOI] [PMC free article] [PubMed] [Google Scholar]
- Wolfe KH, Morden CW, Palmer JD. Ins and outs of plastid genome evolution. Curr Opin Genet Dev. 1991;1:523–529. doi: 10.1016/s0959-437x(05)80202-3. [DOI] [PubMed] [Google Scholar]
- ————— Function and evolution of a minimal plastid genome from a nonphotosynthetic parasitic plant. Proc Natl Acad Sci. 1992;89:10648–10652. doi: 10.1073/pnas.89.22.10648. [DOI] [PMC free article] [PubMed] [Google Scholar]