Abstract
The ongoing analyses of published genome-scale data sets is evidence that different approaches are required to completely mine this data. We report the use of novel tools for both visualization and data set comparison to analyze yeast gene-expression (cell cycle and exit from stationary phase/G0) and protein-interaction studies. This analysis led to new insights about each data set. For example, G1-regulated genes are not co-regulated during exit from stationary phase, indicating that the cells are not synchronized. The tight clustering of other genes during exit from stationary-phase data set further indicates the physiological responses during G0 exit are separable from cell-cycle events. Comparison of the two data sets showed that ribosomal-protein genes cluster tightly during exit from stationary phase, but are found in three significantly different clusters in the cell-cycle data set. Two protein-interaction data sets were also compared with the gene-expression data. Visual analysis of the complete data sets showed no clear correlation between co-expression of genes and protein interactions, in contrast to published reports examining subsets of the protein-interaction data. Neither two-hybrid study identified a large number of interactions between ribosomal proteins, consistent with recent structural data, indicating that for both data sets, the identification of false-positive interactions may be lower than previously thought.
[Supplemental material is available online at http://www.genome.org and at http://biology.unm.edu/biology/maggieww/Public_Html/Visualcomparison.htm, including data sets and download information for VxInsight.]
Enormous amounts of data are generated by high-throughput, genome-scale studies. Currently, data sets are available in which the quality of the data is so good that numerous reanalyses have yet to mine all the information present in them. Because of the size of genome-scale data sets, it is currently difficult, if not impossible, for the average researcher to ask global questions about a single data set, much less compare several data sets simultaneously. For this data to be completely mined, improved methods for integration and analysis of this information will be necessary to extract information from within and between the data sets and to develop hypotheses on the basis of these analyses (Aach et al. 2000). Toward that end, we performed a comparative analysis of four data sets from the yeast Saccharomyces cerevisiae, using the ordination and visualization tool VxInsight (Viswave).
As a model system for which the entire genome has been known since 1996 (Goffeau et al. 1996), S. cerevisiae has been the subject of several genome-scale studies, including gene expression (Lasharki et al. 1997; Chu et al. 1998; Eisen et al. 1998; Ferea et al. 1999; Gasch et al. 2000), protein-protein interactions (Schwikowski et al. 2000; Ito et al. 2001), and gene deletions (Winzeler et al. 1999). Research using yeast and other model systems is now poised to reveal even greater insight into cellular dynamics. As information about localization, modification, and abundance of all the proteins in the cell is obtained, it will become possible to reconstruct the dynamic interactions between all the major levels of organization in living organisms.
The data sets that we used for this comparative analysis include the following: transcriptional analysis of exit from stationary phase and the cell cycle after release from α-factor arrest (Spellman et al. 1998) and two protein-protein interaction data sets (Schwikowski et al. 2000; Ito et al. 2001). We chose these gene-expression data sets because stationary phase, or G0, is an offshoot of the mitotic cell cycle, and cells exiting G0 reenter mitosis at G1 (Werner-Washburne et al. 1993). In addition, starvation-induced G0 arrest is commonly used to synchronize eukaryotic cells to study reentry into the cell cycle (Callard and Mazzolini 1997; Zeise et al. 1998; Hildebrand and Dahlin 2000).
It is important to understand the relationship between the quiescent state and the cell cycle because most solid tumors are derived from G0 cells, and the proof-of-principal for chemotherapeutics is the ability to restore G0 arrest (Clark and Gillespie 1997; Zeitler et al. 1997; Joshi et al. 1998; Pajic et al. 2000). Additionally, a variety of important pathogens, such as Mycobacterium tuberculosis and Cryptoccus neoformans, are relatively difficult to treat because they reside in the body for extended periods of time as quiescent antibiotic-resistant cells (Tomee et al. 1997; Murray 1999). Finally, pathogens used as bio-weapons are usually stored and disseminated as quiescent cells. Thus, the importance of the G0 state and the relative lack of information about this phase of the life cycle underscore the importance of identifying the differences and similarities between the mitotic cell cycle and exit from G0.
In the visual comparison reported here, we were able to detect significant differences in gene clusters between the two gene-expression data sets, indicating that yeast cells exiting starvation-induced quiescence are not synchronous and that expression of ribosomal protein genes during the cell cycle shows three distinct patterns. Overlaying protein-interaction data led to the rapid detection of differences in the data sets and the finding that neither protein-interaction data set detected interactions between ribosomal proteins in the same subunit, which is consistent with recently published structural data, and indicates that the two-hybrid assay may be less prone to false-positives than previously thought.
RESULTS
Data Set Topographies
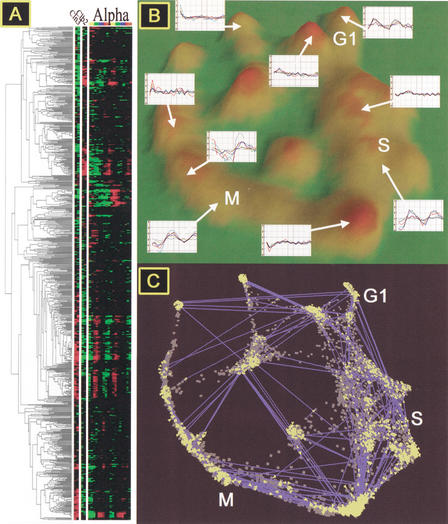
Ordination of genes of the α-factor arrest/cell-cycle data into clusters (18 experiments per 6000 genes; Spellman et al. 1998), as described in Methods, resulted in a circular pattern (Fig. 1B,C). Hills or ridges of G1-, S-, M-, and M-G1–regulated genes are found on the circumference of the circle, although not all of the groups of genes on the circumference of the ordination are cell-cycle regulated (see Web Supplement). In addition, M and G1 clusters, with genes with expressions that are approximately opposite, are located on opposite sides of the topography. The two inner groups contain genes with regulation that is fairly constant throughout the cell cycle, including many genes involved in secretion, sterol biosynthesis, Golgi function, and other constitutive pathways.
Figure 1.
α-Factor–arrest data set (18 time points) ordinated and visualized in VxInsight. (A) Cell-cycle gene expression after α-factor arrest and the dendogram indicating similarities of gene expression as presented by Spellman et al. (Reprinted, with permission, from Spellman et al. 1998.) (B) Three-dimensional topography in which mountains are formed over clusters of genes. The height of the mountain corresponds to the number of genes beneath it. Typical expression profiles for genes in each mountain are provided. G1, S, and M: Genes in these clusters are induced during the G1, S, or M phase of the cell cycle, respectively. (C) Ordination of genes (dots) that underlie the topography with links (blue lines with yellow arrows at each end) showing strong similarities (Pearson's R > 0.887) that exist between genes in different clusters.
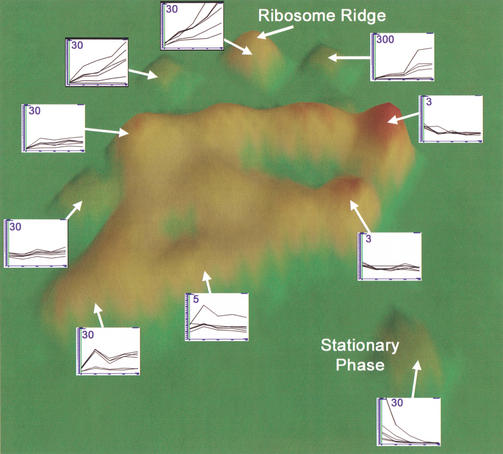
In the topography of the exit from stationary-phase data set, the 45 genes with mRNAs that accumulate in stationary phase are clustered in a hill at the bottom right of the topography (Fig. 2). Genes with mRNAs that accumulate rapidly as cultures exit stationary phase are found at the top and left sides of the topography. Background-normalized data from membrane hybridizations were used for this analysis. Although there is variation in each of the expression profiles as a function of membrane and hybridization order, these differences were not significant, and normalization of this data by several methods did not affect the clusters, although it did have an effect on the overall topography (data not shown).
Figure 2.
VxInsight-generated ordination of exit from stationary-phase data set. Examples of gene expression within each hill or cluster are shown. Along the x-axis of insert graphs are time points (0, 15, 30, 45, and 60 min) after re-feeding. The y-axis of insert graphs indicates the fold-increase or decrease from time equals; 0, which is an average of four to five replicates for each time point. Numbers in the insert graphs indicate the maximum value of the y-axis, which indicates relative expression values obtained using GeneSpring (Silicon Genetics; see Methods). Data were generated as described (Methods).
Visual Queries of Two Gene-Expression Data Sets
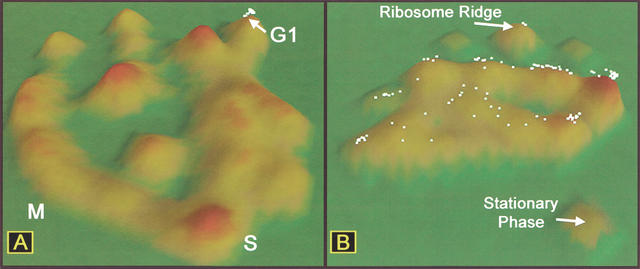
Using microarray data to develop hypotheses about related biological processes requires the ability to make comparative queries of multiple data sets. For this analysis, we chose to investigate the relationships between the processes of the mitotic cell cycle and exit from stationary phase in yeast. Cells in stationary-phase cultures are small and unbudded and are considered to be in the G0 state of the cell cycle. We asked whether cell cycle–regulated genes that clustered in the cell-cycle data set (Fig. 1B,C) also clustered in the exit from stationary-phase data set (Fig. 2). A set of G1-regulated genes in the cell-cycle topography (Fig. 3A) was selected, and the position of these genes was identified in the stationary-phase exit topography (Fig. 3B). The selected G1-induced genes, which are tightly clustered during the cell cycle, were randomly positioned in the stationary-phase exit topography.
Figure 3.
Location of G1-regulated genes in two different gene-expression data sets. (A) Dots represent selected G1-regulated genes in α-factor–arrest cell-cycle data (Spellman et al. 1998). (B) Location of the same genes in the ordination of stationary-phase exit data.
To determine whether genes were G1 regulated, each gene was assigned a value that reflected how purely its expression coincided with G1, which allowed us to rank order the subset of classical cell-cycle genes. We then examined groups of these genes. Of the 10 strongest G1-regulated genes—including CLB6, SWI4, MCD1, RNR1, MNN1, YOX1, POL30, CLN2, SVS1, and TOS4—one half of these genes were randomly distributed, and one half were clustered (P < 0.001) in the exit from stationary-phase data set (see supplemental data). When the positions of these genes were evaluated in the exit from stationary-phase topography, POL30 and MCD1 clustered with the genes with induction that occurs almost immediately on refeeding, including CLN3 and most of the ribosomal protein genes. SWI4 clustered with genes with mRNAs that accumulate in the first 15 min and then remain fairly constant. In contrast, five of the most G1-like genes cluster in a region in which mRNA abundance fluctuates as a function of the particular membrane, but overall, the gene expression remains constant from hybridization to hybridization for the same membrane. These genes are CLB6, RNR1, CLN2, TOS4, and SVS1. The probability of finding these genes clustered in a region of 516 genes is highly significant (P < 0.001).
During the cell cycle, CLN3 is induced first, followed by POL30 and MCD1, which are co-expressed with CLN1 (Stanford Genome Database). Although we had hypothesized that at least some of the patterns of gene expression might be conserved between the cell cycle and exit from stationary phase, the small subset of highly G1-regulated genes does not follow this temporal relationship. Early, morphological data had indicated that the cells in stationary-phase cultures did not exit stationary phase synchronously (Johnston et al. 1977). The induction of CLN3, POL30, and MCD1 almost immediately on refeeding and the relatively random distribution of the majority of other strongly G1-regulated genes in the exit from stationary-phase data set are consistent with the hypothesis that cells exiting stationary phase are not synchronous. Further analysis will be required to determine the conditions under which cells exiting stationary phase can be completely synchronized.
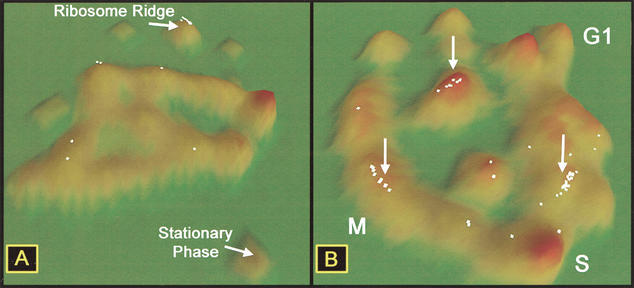
Despite the lack of co-regulation of cell-cycle genes, there are clusters of genes with expression that increased or decreased dramatically during exit from stationary phase. To determine whether genes co-expressed during exit from stationary phase might also be co-expressed in the cell-cycle data set, we investigated the small subunit ribosomal-protein (RPS) genes. Fifty-three of the 59 RPS genes are found in a ridge in the exit data set (Fig. 4A). When the positions of all the RPS genes are identified in the cell-cycle topography, they are not clustered in one group but are located mostly in three different groups of genes (Fig. 4B), with gene-expression profiles that are significantly different (P < 0.0001). We conclude from this that RPS gene expression, which is tightly co-regulated during exit from stationary phase and during other stress conditions (Gasch et al. 2000), shows at least three distinct patterns of expression during the mitotic cell cycle.
Figure 4.
Location of ribosomal protein genes (RPS genes) in two gene-expression data sets. (A) Location of RPS genes in exit from stationary phase data. Fifty-three of 59 RPS genes are localized in the upper middle cluster. (B) Localization of the same RPS genes in cell-cycle data set. Arrows indicate three major groups of RPS genes.
The clustering of these genes into three groups is interesting because many ribosomal protein genes are duplicated and found as highly conserved gene pairs. Thus, any separation of these pairs of genes may have evolutionary implications. Of the 46 genes comprising 23 pairs of ribosomal protein genes that were present in the three clusters, there was an almost a threefold higher chance of members of a pair being in different clusters (34 of 48) compared with finding them in the same cluster (12 of 48; data not shown). Additional experiments will be required to determine the correlation of expression with protein abundance and, thus, whether the differences in ribosomal gene expression during the cell cycle have an effect on ribosome function or biogenesis.
Visual Analysis of Protein-Protein Interactions
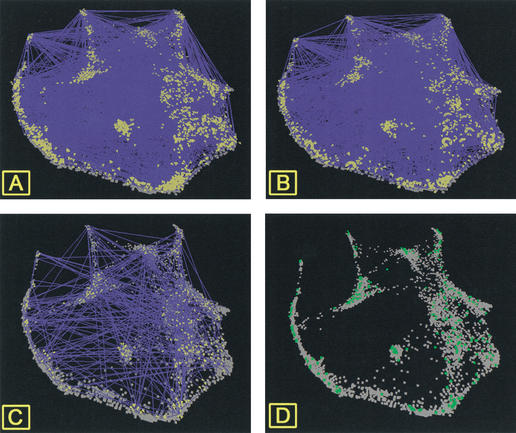
To evaluate the extent to which co-expressed genes were found to encode interacting proteins, we incorporated information from two protein-protein interaction data sets (Schwikowski et al. 2000; Ito et al. 2001) in the cell-cycle topography (Fig. 5). Ito's data sets including 4549 interactions (1532 nonduplicated interactions) in the full data set (Ito et al. 2001) are based on yeast two-hybrid assays, whereas Schwikowski's data set, reporting 2709 interactions (1157 nonduplicated interactions), was gathered from yeast two-hybrid, biochemical, and genetic data (Schwikowski et al. 2000). Interacting pairs of proteins are visualized as lines drawn between two genes on the topography. Because the protein-protein interaction data is binary—that is, proteins either interact or they do not—the relative strength of the interactions is not a parameter that can be used for visualization.
Figure 5.
Protein-protein interaction maps as a function of the cell-cycle gene-expression topography. Lines are drawn between genes encoding interacting proteins. (A) Schwikowski's complete data set. (B) Ito's full data set. (C) Protein-protein interactions reported from both data sets. (D) Genes encoding interacting proteins common to both data sets. In A and B, genes encoding proteins involved in interactions are indicated by yellow pyramids.
The impression from both data sets is that the complete set of interacting proteins creates a network over the entire expression topography (Fig. 5A,B; see supplemental data). At this level of analysis, differences in the structure of the data can be detected only at the margins. When the protein interactions that are common to both data sets are visualized in VxInsight, the previously reported lack of overlap in the two data sets (Ito et al. 2001) can be clearly seen (only 19% of Schwikowski and 8.3% of Ito's full data sets are in common; Fig. 5C,D). Visualization of only the genes encoding interacting proteins common to both data sets (Fig. 5D) shows that relatively large segments of the topography contain no interacting proteins.
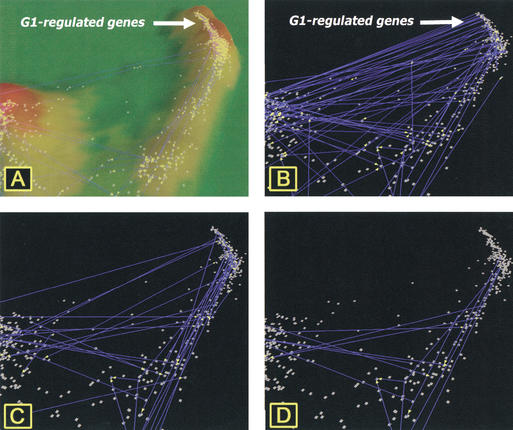
In both data sets, many interactions are observed between proteins encoded by tightly clustered G1 phase–regulated genes (Fig. 6). Although both data sets contain G1-regulated genes that interact with each other, there is little overlap between the data sets (Fig. 6D). Ito's data set (Fig. 6B) includes many interactions between proteins encoded by genes in the G1 cluster and an adjacent cluster, containing genes that are not cell-cycle regulated. In contrast, the interactions reported in Schwikowski's data set (Fig. 6C) more closely parallel the connections based on strong similarities of gene expression (Fig. 6D). In the region of M phase–regulated genes, both data sets report interacting proteins that parallel the strong similarities in gene expression, but with little overlap between the data sets (data not shown). In examining the G1-regulated genes reported to be involved in interactions in both data sets, Ito's data set is much more likely to contain genes of unknown function (33 of 78; 42%) than is Schwikowski's data set (5 of 50; 10%; data not shown). Furthermore, there are no genes in the main G1-regulated cluster that encode interactive proteins common to both data sets (Fig. 6D). Looking at genes within the G1-regulated gene cluster that are reported to interact in each data set, Schwikowski reports an interaction between MSH6 and PMS1, both involved in mismatch repair, whereas Ito reports an interaction between RFL2 and CAC1, both subunits of chromatin assembly factor (CAF-1). The lack of overlap in the two data sets and the presence of reasonable interacting pairs in both data sets indicate that for the present time, the data sets are most useful when examined concurrently, as was performed in a recent paper (Ge et al. 2001). We conclude from this analysis that the differences in results of both studies could be indicative of the range of detection in the two-hybrid assay and the difficulty in obtaining sample sizes large enough to include the entire set of interactions.
Figure 6.
Interactions among proteins encoded by G1-regulated genes from the cell-cycle data set. (A) Topographical presentation of G1-regulated gene cluster with connections between genes showing strong similarities (R > 0.887) of expression between genes. (B) Genes encoding interacting proteins from Ito's full data set. (C) Genes encoding interacting proteins reported from Schwikowski's data set. (D) Protein interactions in common to the two data sets. Connections between genes in B–D indicate interactions occurring between proteins encoded by the specific genes.
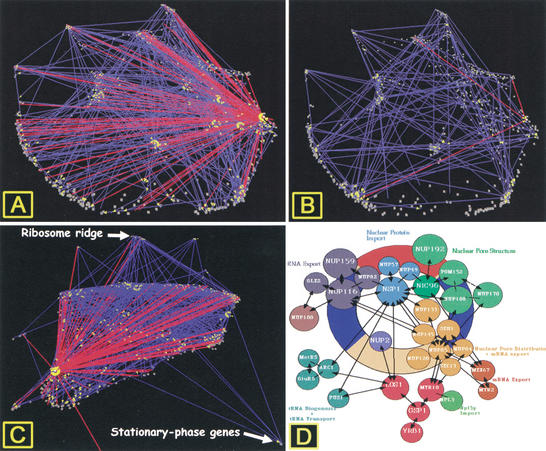
The structures of the two data sets are also distinct. Several genes have significantly more interactions in the Ito data set (Fig. 7A) than in the Schwikowski data set (Fig. 7B). One of these, Nup116p, a nuclear pore protein, is reported to have 125 interactions in the Ito full data set, 15 in the core data set (interactions observed three separate times), and three in the Schwikowski data set (which includes data from the Munich Information Center for Protein Sequences). Nup116p has been shown genetically or biochemically to interact with 15 proteins (www.Proteome.com), including many involved in nuclear pore function (Fig. 7D). Based on information from the Munich Information Center for Protein Sequences, Schwikowski reported three Nup116p-interacting proteins: Kap95p, Kap104p, and Gle2p. Ito, based solely on two-hybrid data, also identified three of these interacting proteins, Gle2p, Nup 82p, and Nup100p, in the full data set (Fig. 7B).
Figure 7.
Protein-protein interactions between Nup116p and other proteins as a function of gene expression. (A) Ito's full data set: cell-cycle expression topography. (B) Schwikowski's full data set: cell-cycle topography. (C) Ito's full data set: exit from stationary phase topography. (D) Diagram of Nup116p interactions in the nuclear pore from the Munich Information Center for Protein Sequences (http://vms.gsf.de/htbin/search_code/YMR047C). (Reprinted, with permission, from E. Hurt, BZH; Universitaet Heidelberg.)
Interestingly, when interactions reported in Ito's full data set for Nup116p are visualized as a function of gene expression during exit from stationary phase (Fig. 7C), it is striking that there are no interactions between Nup116p and proteins encoded by stationary-phase genes and only three interactions with proteins encoded by genes with expression that increases rapidly after refeeding, including those in ribosome ridge. If Nup116p interactions were randomly distributed, more than nine interactions would have been expected with proteins encoded by these genes. In ribosome ridge alone, ∼125 proteins (of 290) are known to be ribosomal, and nine other proteins are predicted to be nuclear, yet there is are only two interactions with proteins encoded by genes in this cluster. Further experiments will be necessary to determine whether this interaction pattern is accurate or reflective of a higher than expected rate of false negatives (Ito et al. 2001) with this assay.
Relative Absence of Ribosomal-Protein Interactions in the Protein-Interaction Data Sets
Because of the strong similarity in gene expression among the ribosomal protein genes (RPS and RPL genes) during exit from stationary phase, we were interested in examining the interactions among proteins encoded by genes found in ribosome ridge in the exit from stationary-phase data set. Surprisingly, although there was a high degree of similarity of gene expression and some interactions reported between nonribosomal proteins in ribosome ridge, there was only one interaction reported between ribosomal proteins (see Web Supplement). The absence of interactions among these proteins was surprising but consistent with recent structural data, indicating that ribosomal proteins interact primarily with ribosomal RNA and not with each other (Spahn et al. 2001). This observation, which is in contrast to results from immunoprecipitation–mass spectroscopy analysis of protein complexes in which ribosomal proteins are common contaminants (Gavin et al. 2002), actually strengthens the confidence in both two-hybrid data sets, indicating that the level of identification of false-positive interactions (Schwikowski et al. 2000), at least among some groups of proteins, is relatively low.
DISCUSSION
An integrative approach to cell function requires the tools to compile and integrate information from different levels of cellular organization (Ideker et al. 2001). We have shown the utility of visual comparison of distinct types of genome-scale data sets. In this process, we were able to conclude that G1-regulated genes were not coordinately regulated during exit from stationary phase, indicating that cells exiting stationary phase are not synchronous or that a subset of G1-regulated genes is required for this process, leading to interesting and testable, novel hypotheses about reentry into the mitotic cell cycle.
The hypothesis that the cells in stationary-phase cultures are not synchronous is supported by the observation of different sizes of cells in stationary-phase cultures (Werner-Washburne et al. 1993) and previous studies of reentry into the cell cycle indicating that cells do not bud until they reach a critical size (Johnston et al. 1977). In addition, one report indicated that mammalian cells are not synchronized when induced to grow by refeeding (Cooper 1998), although G0 arrest by serum starvation is a method commonly used to synchronize mammalian cells (Callard and Mazzolini 1997; Zeise et al. 1998; Hildebrand and Dahlin 2000). If yeast cells can be synchronized during exit from stationary phase; for example, by isolating small unbudded cells, it should be possible to distinguish those changes in gene expression that are physiological in nature (e.g., induction of ribosomal-protein genes) from those that are specific for the cell-cycle transition (e.g., expression of cell cycle–regulated genes). The discovery of different genes required for the physiological response and the cell-cycle response could easily lead to the development of novel drug-targeting strategies that are specific for quiescent cells.
The lack of overlap in the two protein-interaction data sets from yeast (Schwikowski et al. 2000; Ito et al. 2001) has been a puzzle to researchers interested in proteomics; to date no clear reason for these differences has been determined. One suggestion was that the size of the cloned genes might have been a factor (Hazbun and Fields 2001). In our analysis, there was no clear reason to exclude data from either data set. A study of the relationship between cell-cycle expression and protein-interaction data was recently published (Ge et al. 2001) in which the protein-interaction data were combined. This is consistent with our conclusions for the two data sets analyzed here. We hypothesize that the differences between the two data sets could be caused by the ability of two-hybrid analysis to detect a very wide range of interactions, and that the sample size, even in genome-scale analyses, may be too small to detect all of the interactions in one or even in several experiments.
The process of analysis presented here, although extremely useful to researchers interested in the quiescent state, is also meant to serve as an example that can be used by biologists interested in other questions. For example, is it possible to evaluate differences between distinct, but related, developmental pathways by identifying genes that cluster in one expression data set but not in another? Is it possible to identify protein interactions that occur only under specific growth conditions by identifying those conditions in which interacting proteins are clustered as a function of gene expression?
As multi–data set analyses become more common, they will also lead to changes in experimental design, for example, the increased use of time-course experiments and coordination or parallelization of assays for gene expression and protein interactions, abundance, and/or modifications. Additional pressure for these types of experiments will come from the need for complete characterization of complex processes, such as regulatory pathways, involving every level of cellular and multicellular organization. Because it is also unlikely that any one level of cellular organization will provide all the critical elements for diagnostics, both basic and applied research will fuel the continued development of more functional and intuitive software tools for this analysis.
METHODS
Exit From Stationary Phase: Growth Conditions, RNA Isolation, and Microarray Analysis
Overnight cultures of yeast cells (S288C) were inoculated into rich glucose-based medium (YPD) and incubated at 30°C with shaking. At day 7, cells were harvested, washed, resuspended to an OD600 of 2 in fresh YPD and returned to 30°C. Samples (∼40 OD600 units) were taken at t = 0, 15, 30, 45, and 60 min after cells were resuspended in fresh rich medium. Cells were harvested by centrifugation at 4°C and washed once with ice-cold water. Cell pellets were stored at −70°C until use.
Total RNA from ∼40 OD units of cells was extracted using a modified Gentra protocol. Briefly, cell pellets were resuspended in 300 μL of cell lysis buffer (Gentra) to which ∼0.2 gm of acid-washed beads had been added. The cells were lysed by vortexing for 30 sec followed by 30 sec on ice (six repetitions). DNA and protein were precipitated from the supernatant, and the RNA was further purified with a phenol/choloroform extraction and DNase treatment.
Radiolabeled ([33P]-dCTP) cDNA “probe” was obtained by reverse transcription of total RNA (2 μg) following the protocol from Research Genetics (www.resgen.com). cDNA was purified to remove unincorporated nucleotides, and total incorporated counts were measured by scintillation counting. The entire probe was then hybridized to nylon membranes containing 6144 yeast open reading frames (Research Genetics). Five sets of nylon membranes were hybridized per experiment (one time point per membrane set per hybridization). Hybridization was detected by phosphor imaging, and the scanned images were uploaded into Research Pathways Image software (Research Genetics) and as background-subtracted counts into GeneSpring (Silicon Genetics) and VxInsight (Viswave). Data were normalized using the 50th percentile of all measurements as a positive control. Each measurement was divided by this synthetic positive control to obtain relative expression values.
Replicate experiments were performed by stripping the nylon membranes and reprobing (following the protocol from Research Genetics) with a new reverse transcription reaction obtained from the original RNA extracts. Four to five replicates were performed for each time point.
Data Preparation and Analysis With VxInsight
Gene expression values in tab-delimited data files were used to compute all pair-wise correlations between genes. For each gene, the 20 strongest positive correlations were retained and used for clustering. Because the significance of correlations is nonlinear (a change of 0.05 is much more significant for larger correlations than for smaller ones), the correlations were transformed to a T-statistic, which reflects the statistical rareness of the correlation numbers. In each case, the two gene names and the T-statistic for their correlation were passed to the VxOrd clustering program. The algorithm used by VxOrd places genes on a two-dimensional plane with respect to their similarities (i.e., the T-statistics). It minimizes the potential energy of particles (genes) attracted to each other by forces proportional to their similarities and repulsed from each other by a local force proportional to the density of genes in the immediate region of each gene. The details of the ordination are described more fully elsewhere (Davidson et al. 2001). The hills represent gene clusters, which are determined by similarities in gene expression. The topographical distance between genes and clusters is a function of the similarity of expression between the genes, and the height of the hills in VxInsight corresponds to the number of genes beneath them.
We decided to identify as strongly correlated, all gene pairs that could have true correlations, ρ exceeding 0.95. To find the appropriate critical value for R, the sample correlation rather than the assumed underlying true correlation ρ we used the approach described in Davidson et al. (2001). Briefly, if two genes have some true long-term correlations (e.g., ρ = 0.95) and we measure these two genes with only 18 microarray experiments, our particular sample correlation will often fall below R = 0.95. For any critical value we might choose, there would be a risk of some rare set of 18 experiments yielding a sample correlation less than our selected value. However, we can control that risk by choosing a critical value such that the chance of seeing one of those misleading sample correlations is acceptably small. So, for example, in our analysis we were willing to accept the chance of missing a pair of strongly correlated genes (with a true long-term correlation, ρ ≥ 0.95) only one time in 20. The analysis described in Davidson et al. (2001) indicates that the critical value for the observed sample correlations should be R > 0.887. Gene pairs passing this test are identified as being strongly correlated in our analysis.
Identification of Highly Correlated, G1-Regulated Genes
Genes that are strongly up-regulated in G1-phase in the α-factor arrest/cell cycle data set show sharp increases in the third through fifth experiment and then again in the 11th through 13th experiment and are much lower at all other times (Spellman et al. 1998). To generate a list of these genes, we computed the dot product of the expression of every gene with a vector having +1 values where G1-regulated genes would be expected to be up-regulated, and −1 values elsewhere. These dot products were sorted and the largest of them were used to identify the strongest G1-regulated genes.
Testing the Significance of the Clustering for Ribosomal-Protein Genes
To answer the question “Are two mountains in the VxInsight map significantly different from each other?” we compared the empirical distribution of pair-wise correlations in each mountain, and also the distributions of correlations between the two mountains. There are three ways clusters could systematically differ from each other:
- 1.
Expression correlations within each of the two mountains could be very different from each other and also different from the intermountain correlations.
- 2.
The correlations might be vaguely similar in each of the mountains, but their intermountain correlations could be noticeably different from the correlations in either mountain.
- 3.
The correlations in each mountain could be noticeably different from each other, but the intermountain correlations could have some intermediate value, such that the intermountain correlations could not be detected as being different from either of the mountains, even if the mountains were, themselves, statistically different.
The first case corresponds to strongly separated clusters, the second to weakly separated clusters, and the third case corresponds to a gradual gradation from one cluster into another. However, there is only one way that the genes can be incorrectly separated into different groups: that is if all three groupings are found to be indistinguishable.
If the gene expressions for genes in, and between, the two mountains were really indistinguishable (the null hypothesis), then analysis of variance (ANOVA) should fail to detect a significant difference between the means of the three sets of correlations. We tested a number of clusters using ANOVA to assure ourselves that the clustering was significant.
Briefly, we started with two nonintersecting gene lists, GroupA and GroupB. We computed all possible correlations between the genes in GroupA, all possible correlations between genes in GroupB, and finally the correlations between every gene in GroupA with every gene in GroupB. These individual correlations were transformed to their corresponding T-statistics, which are directly related to the P values associated with observing the correlations when the expressions are not actually correlated. ANOVA was performed to test if the mean correlations for these three different groups were significantly different. Under the null hypothesis, one would rarely (the ANOVA P value) see large F-statistics from this analysis. On the other hand, ANOVA should uncover a difference if the genes in the two VxInsight clusters were correctly separated into different groups. That is, we expect ANOVA to yield a very small P value when the expressions for genes in either mountain are more like the expressions for genes in the same mountain than they are for genes in the other mountain. Further, when the correlations between the two clusters are different from the correlations in at least one of the mountains, ANOVA should also allow us to reject the null hypothesis. In either case, we would conclude that the VxInsight clusters are not artifacts.
WEB SITE REFERENCES
http://www.Proteome.com; Nup116p has been shown genetically or biochemically to interact with 15 proteins.
http://vms.gsf.de/htbin/search_code/YMR047C; Munich Information Center for Protein Sequences.
http://genome-www.stanford.edu/Saccharomyces/; Stanford Genome Database
Acknowledgments
This paper is dedicated to the memory of Judith Galbraith. We would like to thank Andreas Wagner for careful reading of the manuscript and the members of our laboratories for extremely helpful discussions. This work was funded by grants from National Science Foundation (MCB-0092374) to M.W.W., National Institutes of Health Initiatives for Minority Student Development (NIH-IMSD 1R25 GM60201-01) to J.W., and by Laboratory Directed Research and Development, Sandia National Laboratories, U.S. Department of Energy (DE-AC04-94AL85000).
The publication costs of this article were defrayed in part by payment of page charges. This article must therefore be hereby marked “advertisement” in accordance with 18 USC section 1734 solely to indicate this fact.
Footnotes
E-MAIL maggieww@unm.edu; FAX (505) 277-0304.
Article and publication are at http://www.genome.org/cgi/doi/10.1101/gr.225402.
REFERENCES
- Aach J, Rindone W, Church G. Systematic management and analysis of yeast gene expression data. Genome Res. 2000;10:431–445. doi: 10.1101/gr.10.4.431. [DOI] [PubMed] [Google Scholar]
- Callard D, Mazzolini L. Identification of proliferation-induced genes in Arabidopsis thaliana: Characterization of a new member of the highly evolutionarily conserved histone H2A.F/Z variant subfamily. Plant Physiol. 1997;115:1385–1395. doi: 10.1104/pp.115.4.1385. [DOI] [PMC free article] [PubMed] [Google Scholar]
- Chu S, DeRisi J, Eisen M, Mulholland J, Botstein D, Brown PO, Herskowitz I. The transciptional program of sporulation in budding yeast. Science. 1998;282:699–705. doi: 10.1126/science.282.5389.699. [DOI] [PubMed] [Google Scholar]
- Clark W, Gillespie DAF. Transformation by v-Jun prevents cell cycle exit and promotes apoptosis in the absence of serum growth factors. Cell Growth Differ. 1997;8:371–380. [PubMed] [Google Scholar]
- Cooper S. Mammalian cells are not synchronized in G1-phase by starvation or inhibition: Considerations of the fundamental concept of G1-phase synchronization. Cell Prolif. 1998;31:9–16. doi: 10.1046/j.1365-2184.1998.00110.x. [DOI] [PMC free article] [PubMed] [Google Scholar]
- Davidson GS, Wylie BN, Boyack K. Cluster stability and the use of noise in interpretation of clustering. Proc IEEE Information Visualization. 2001;2001:23–30. [Google Scholar]
- Eisen MB, Spellman PT, Brown PO, Botstein D. Cluster analysis and display of genome-wide expression patterns. Proc Natl Acad Sci. 1998;95:14863–14868. doi: 10.1073/pnas.95.25.14863. [DOI] [PMC free article] [PubMed] [Google Scholar]
- Ferea T L, Botstein D, Brown PO, Rosenzweig RF. Systemic changes in gene expression patterns following adaptive evolution in yeast. Proc Natl Acad Sci. 1999;96:9721–9726. doi: 10.1073/pnas.96.17.9721. [DOI] [PMC free article] [PubMed] [Google Scholar]
- Gasch A, Spellman P, Kao C, Carmel-Harel O, Eisen M, Storz G, Botstein D, Brown P. Genomic expression programs in the response of yeast cells to environmental changes. Mol Biol Cell. 2000;11:4241–4257. doi: 10.1091/mbc.11.12.4241. [DOI] [PMC free article] [PubMed] [Google Scholar]
- Gavin AC, Bosche M, Krause R, Grandi P, Marzioch M, Bauer A, Schultz J, Rick JM, Michon AM, Cruciat CM, et al. Functional organization of the yeast proteome by systematic analysis of protein complexes. Nature. 2002;415:141–147. doi: 10.1038/415141a. [DOI] [PubMed] [Google Scholar]
- Ge H, Liu Z, Church GM, Vidal M. Correlation between transcriptome and interactome mapping data from Saccharomyces cerevisiae. Nat Genet. 2001;29:482–486. doi: 10.1038/ng776. [DOI] [PubMed] [Google Scholar]
- Goffeau A, Barrell BG, Bussey H, Davis RW, Dujon B, Feldmann H, Galibert F, Hoheisel JD, Jacq C, Johnston M, et al. Life with 6000 genes. Science. 1996;274:546–567. doi: 10.1126/science.274.5287.546. [DOI] [PubMed] [Google Scholar]
- Hazbun TR, Fields S. Networking proteins in yeast. Proc Natl Acad Sci. 2001;98:4277–4278. doi: 10.1073/pnas.091096398. [DOI] [PMC free article] [PubMed] [Google Scholar]
- Hildebrand M, Dahlin K. Nitrate transporter genes from the diatom Cylindrotheca fusiformis (Bacillariophyceae): mRNA levels controlled by nitrogen source and by the cell cycle. J Phycol. 2000;36:702–713. doi: 10.1046/j.1529-8817.2000.99153.x. [DOI] [PubMed] [Google Scholar]
- Ideker T, Galitski T, Hood L. A new approach to decoding life: Systems biology. Annu Rev Genomics Hum Genet. 2001;2:343–372. doi: 10.1146/annurev.genom.2.1.343. [DOI] [PubMed] [Google Scholar]
- Ito T, Chiba T, Ozawa R, Yoshida M, Hattori M, Sakaki Y. A comprehensive two-hybrid analysis to explore the yeast protein interactome. Proc Natl Acad Sci. 2001;98:4569–4574. doi: 10.1073/pnas.061034498. [DOI] [PMC free article] [PubMed] [Google Scholar]
- Johnston GC, Pringle JR, Hartwell LH. Coordination of growth with cell division in the yeast Saccharomyces cerevisiae. Exp Cell Res. 1977;105:79–98. doi: 10.1016/0014-4827(77)90154-9. [DOI] [PubMed] [Google Scholar]
- Joshi US, Chen YQ, Kalemkerian GP, Adil MR, Kraut M, Sarkar FH. Inhibition of tumor cell growth by p21(WAF1) adenoviral gene transfer in lung cancer. Cancer Gene Ther. 1998;5:183–191. [PubMed] [Google Scholar]
- Lasharki DA, DeRisi JL, McCusker JH, Namath AF, Gentile C, Hwang SY, Brown PO, Davis RW. Yeast microarrays for genome wide parallel genetic and gene expression analysis. Proc Natl Acad Sci. 1997;94:13057–13062. doi: 10.1073/pnas.94.24.13057. [DOI] [PMC free article] [PubMed] [Google Scholar]
- Murray PJ. Defining the requirements for immunological control of mycobacterial infections. Trends Microbiol. 1999;7:366–372. doi: 10.1016/s0966-842x(99)01567-x. [DOI] [PubMed] [Google Scholar]
- Pajic A, Spitkovsky D, Christoph B, Kempkes B, Schuhmacher M, Staege MS, Brielmeier M, Ellwart J, Kohlhuber F, Bornkamm GW, et al. Cell cycle activation by c-myc in a Burkitt lymphoma model cell line. Int J Cancer. 2000;87:787–793. doi: 10.1002/1097-0215(20000915)87:6<787::aid-ijc4>3.0.co;2-6. [DOI] [PubMed] [Google Scholar]
- Schwikowski B, Uetz P, Fields S. A network of protein-protein interactions in yeast. Nat Biotechnol. 2000;18:1257–1261. doi: 10.1038/82360. [DOI] [PubMed] [Google Scholar]
- Spahn CMT, Beckmann R, Eswar N, Penczek PA, Sali A, Blobel G, Frank J. Structure of the 80S ribosome from Saccharomyces cerevisiae: tRNA-ribosome and subunit-subunit interactions. Cell. 2001;107:373–386. doi: 10.1016/s0092-8674(01)00539-6. [DOI] [PubMed] [Google Scholar]
- Spellman PT, Sherlock G, Zhang MQ, Iyer VR, Anders K, Eisen MB, Brown PO, Botstein D, Futcher B. Comprehensive identification of cell cycle–regulated genes of the yeast Saccharomyces cerevisiae by microarray hybridization. Mol Biol Cell. 1998;9:3273–3297. doi: 10.1091/mbc.9.12.3273. [DOI] [PMC free article] [PubMed] [Google Scholar]
- Tomee J FC, Hiemstra PS, Heinzel Wieland R, Kauffman HF. Antileukoprotease: An endogenous protein in the innate mucosal defense against fungi. J Infect Dis. 1997;176:740–747. doi: 10.1086/514098. [DOI] [PubMed] [Google Scholar]
- Werner-Washburne M, Braun E, Johnston GC, Singer RA. Stationary phase in the yeast Saccharomyces cerevisiae. Microbiol Rev. 1993;57:383–401. doi: 10.1128/mr.57.2.383-401.1993. [DOI] [PMC free article] [PubMed] [Google Scholar]
- Winzeler EA, Shoemaker DD, Astromoff A, Liang H, Anderson K, Andre B, Bangham R, Benito R, Boeke JD, Bussey H, et al. Functional characterization of the S. cerevisiae genome by gene deletion and parallel analysis. Science. 1999;285:901–906. doi: 10.1126/science.285.5429.901. [DOI] [PubMed] [Google Scholar]
- Zeise E, Kuhl N, Kunz J, Rensing L. Nuclear translocation of stress protein Hsc70 during S phase in rat C6 glioma cells. Cell Stress Chaperones. 1998;3:94–99. doi: 10.1379/1466-1268(1998)003<0094:ntosph>2.3.co;2. [DOI] [PMC free article] [PubMed] [Google Scholar]
- Zeitler H, Ko Y, Glodny B, Totzke G, Appenheimer M, Sachinidis A, Vetter H. Cell-cycle arrest in G0/G1 phase of growth factor–induced endothelial cell proliferation by various calcium channel blockers. Cancer Detect Prev. 1997;21:332–339. [PubMed] [Google Scholar]


