

Abstract
Neurotrophin nerve growth factor (NGF) has been suggested to be involved in age-related neurodegenerative diseases, but no transgenic model is currently available to study this concept. We have obtained transgenic mice expressing a neutralizing anti-NGF recombinant antibody, in which the levels of antibodies are three orders of magnitude higher in adult than in newborn mice [F.R., S. C., A.C., E. Di Daniel, J. Franzot, S. Gonfloni, G. Rossi, N. B. & A. C. (2000) J. Neurosci., 20, 2589–2601]. In this paper, we analyze the phenotype of aged anti-NGF transgenic mice and demonstrate that these mice acquire an age-dependent neurodegenerative pathology including amyloid plaques, insoluble and hyperphosphorylated τ, and neurofibrillary tangles in cortical and hippocampal neurons. Aged anti-NGF mice also display extensive neuronal loss throughout the cortex, cholinergic deficit in the basal forebrain, and behavioral deficits. The overall picture is strikingly reminiscent of human Alzheimer's disease. Aged anti-NGF mice represent, to our knowledge, the most comprehensive animal model for this severe neurodegenerative disease. Also, these results demonstrate that, in mice, a deficit in the signaling and/or transport of NGF leads to neurodegeneration.
Nerve growth factor (1) (NGF) is widely distributed in basal forebrain cholinergic neurons (BFCNs) (2, 3) and in regions of the central nervous system innervated by the magnocellular BFCNs (4). NGF promotes the differentiation of BFCNs (5), ameliorates lesion-induced abnormalities in these cells (6), and reverses atrophy of BFCNs (7) and spatial memory impairments in aged rats (8–10).
A decline in the integrity of the central cholinergic function in aged human brain has been postulated (11) to be responsible for the neuropathological changes leading to cognitive and mnemonic deficits. Consequently, there is widespread interest in NGF as a potential therapeutic agent in neurodegenerative disorders linked to aging, such as Alzheimer's disease (AD) (12).. No transgenic model is available to validate this concept, because mice in which the NGF gene was disrupted by homologous recombination have an early postnatal lethal phenotype (13).
In a previous paper, we used the neuroantibody technique (14–16) to produce transgenic mice (17) expressing a neutralizing mAb (mAb αD11) directed against NGF (18). Because the levels of transgenic anti-NGF antibodies are three orders of magnitude higher in adult than in newborn mice, effective inhibition of NGF actions occurs in adult animals only (17).
Indeed, the level of free NGF in the brain of 2-month-old anti-NGF transgenic mice is 53% less than that measured in control mice (17). For this reason, anti-NGF mice provide a unique opportunity to study the consequences of a chronic deprivation of NGF in aged animals.
In the present study, we report that aged anti-NGF mice display phenotypic changes, including neurofibrillary tangles, τ hyperphosphorylation, amyloid plaques, neuronal death, cholinergic deficits, and selective behavioral impairments, closely resembling those found in AD (19, 20)..
Materials and Methods
Generation of Anti-NGF Transgenic Mice.
For anti-NGF transgenic mouse production (17), the variable regions of light and heavy chains of the anti-NGF mAb αD11 were linked to human k and γ1 constant regions, yielding the chimeric human/rat antibody αD11, and placed under the transcriptional control of the human cytomegalovirus (CMV) early region promoter. Mice expressing functional anti-NGF antibodies (anti-NGF mice) were obtained by crossing mice expressing the light chain (CMV-VK αD11) with mice expressing the heavy chain (CMV-VH αD11) (17)..
All phenotypic analyses were performed on 15- to 17-month-old mice, on at least 6 (or more, where indicated) different mice from each experimental group (anti-NGF double transgenic and transgenic controls, expressing only the heavy chain). The immunohistochemical analysis of the mice was performed on the same animals that had previously undergone behavioral tests.
Immunohistochemistry and Western Analysis.
The antibodies used were: anti-choline acetyltransferase (ChAT) (1:500; Chemicon), anti-amyloid precursor protein (APP) (10 μg/ml; Roche Diagnostics), antinonphosphorylated τ (mAb 7.51, kindly provided by M. Novak (Slovak Academy of Sciences, Bratislava, Slovak Republic), recognizing all isoforms of τ and mAb Alz50, 10 μg/ml), antiphosphorylated τ (mAb PHF-1, kindly provided by P. Davis (Albert Einstein College of Medicine, Bronx, NY), and mAb AT8, Innogenetics (Zwijnaarde, Belgium), 10 μg/ml), antineurofibrillary tangles (mAb NFT200, Innogenetics), and antitubulin (mAb YOL-1, kindly provided by Cesar Milstein, MRC Laboratory of Molecular Biology, Cambridge, UK).
Brains from 15- to 17-month-old mice were processed for immunohistochemistry as described (21). Adjacent sections were pretreated with alkaline phosphatase (AP) (130 units/ml, Roche Diagnostics) for 2.5 h at 32°C in Tris⋅HCl (0.1 M, pH 8.00), 10 μg/ml leupeptin (Sigma), and 1 mM PMSF (Sigma).
The presence of apoptotic cells was revealed by using the In Situ Cell Death Detection kit (Roche Diagnostics). The volume of basal forebrain and the number of BFCNs were evaluated in nine anti-NGF transgenic mice and eight transgenic controls by using a stereological approach (17).
Cortical thickness was evaluated in one of every five coronal sections perpendicular to the brain surface, at the level of the secondary motor area (M2) along a plane tangent to the lateral wall of the lateral ventricles, between the white matter–cortical boundary and the pial surface (22). The rostral and caudal boundaries of M2 were chosen on the basis of a plane passing through the genu of the corpus callosum and the anterior commissure, respectively (22). The hippocampal surface was evaluated in one of every five coronal sections, starting from bregma −1.28 mm to bregma −2.12 mm (24).
The amyloid burden was quantified by image analysis on anti-APP-stained sections as described (23), by using the optimas 6.1 video image analysis system (Optimas Corporation, Bothell, WA) linked to a Zeiss Axiovert microscope through a charge-coupled device video camera.
Stereological neuronal counts were performed in the frontal cortex (M2, boundaries defined as above). The volume of M2 was calculated by the Cavalieri's method (25). The total number of neurons was estimated by the optical fractional method (24) with the imaging system described above. The analysis was performed on three animals for each experimental group. Statistical analysis was performed by using a two-tailed t test.
For Western analysis, brains (Janke & Kunkel, Hamburg, Germany) were homogenized with a polytron homogenizer (Janke & Kunkel) (3 times for 30 sec on ice) in 5 ml/g (wet weight) of ice-cold extraction buffer (Tris⋅HCl 50 mM, pH 7.5/EDTA 50 mM/spermidine 250 mM/PMSF 1 mM/iodoacetamide 1 mM/leupeptin 10 μg/ml/aprotinin 1 μg/ml/soybean trypsin inhibitor 4μg/ml/turkey egg white inhibitor 10μg/ml). Homogenates were centrifuged at 44,000 × g for 30 min at 4°C, and supernatants were analyzed by SDS/PAGE (10% and 15% polyacrylamide gels, as appropriate) and Western blot. Dephosphorylation of τ proteins was obtained by treating brain extracts with AP (2 h at 37°C, 30 units/ml). The insoluble fraction of brain homogenates (pellet of the homogenates) was extracted in formic acid, sonicated, and lyophilized before dissolving in SDS sample buffer (2 ml/g of pellet). The intensities of the immunoreactive bands were quantified and analyzed by using the National Institutes of Health (NIH) image analysis program (NIH image 4.2) after normalizing for protein content, evaluated by the intensity of the tubulin band with mAb YOL-1.
Behavioral Analysis.
For spatial learning, mice were tested in an eight-arm radial maze, as described (17). Trials were repeated twice a day for 14 days. The total number of errors was calculated, taking into account the entries in previously visited arms and first entries in unbaited arms. The retention and transfer experiments started 31 and 32 days after the end of the learning test. Previously unbaited arms were baited, and a new learning test was performed. A two-way repeated-measures ANOVA (RMANOVA) (treatment × time) and a t test were performed to assess differences in learning curves and in level of accuracy, respectively.
For the object recognition test, mice were allowed to explore two white cubes (12 cm wide) for 10 min. After 60 min, one of the two cubes was covered with black and white checkered cardboard, and mice were allowed to explore the cubes for a further 10 min. A t test was used to compare the discrimination index (N − F/N + F) in the two groups of animals, where N is the time spent exploring the new object, and F is that spent exploring the familiar object.
Results
Adult Anti-NGF Transgenic Mice Express High Levels of Neutralizing Antibodies.
We have recently produced (17) transgenic mice expressing neutralizing anti-NGF immunoglobulins (anti-NGF transgenic mice). Anti-NGF mice thrive to adulthood, with a very mild NGF-deprivation phenotype during the first month of age (17). After the second postnatal month, anti-NGF antibody levels increase by at least three orders of magnitude (up to 200 ng/ml), and classical neuronal NGF targets, including sympathetic, sensory, and BFCNs, as well as nonneuronal targets, become severely affected (17, 26).
In the present study, aged anti-NGF mice (15–18 months old) were analyzed in the search for phenotypic signs of neurodegeneration. The levels of residual free NGF in the brain of aged anti-NGF transgenic mice are at least 50% lower than those measured in control mice (data not shown). It should be noted that the assay used for this determination overestimates the amount of free NGF because of NGF dissociating from the antibodies during the extraction process and because of the intracellular pool of stored NGF.
Ventricle Dilation and Cortical and Hippocampal Atrophy in Aged Anti-NGF Mice.
The gross anatomical examination of brains of aged anti-NGF transgenic mice showed a marked dilation of the lateral ventricles (Fig. 1a) with respect to age-matched control VH transgenic mice (Fig. 1b), associated with notable atrophy of the cerebral cortex and hippocampus. Cortical thickness was significantly reduced in frontal areas (0.88 ± 0.03 mm in aged anti-NGF mice vs. 1.28 ± 0.06 mm in age-matched control mice, P < 0.05; n = 9 anti-NGF mice, and n = 9 transgenic control mice). The surface of the hippocampal was also decreased (1.94 ± 0.21 mm2 vs. 2.72 ± 0.10 mm2, P < 0.05, number of animals per group: n = 9).
Figure 1.

Dilation of lateral ventricles and cholinergic deficit in aged anti-NGF mice. Dilation of brain lateral ventricles in cresyl violet counterstained sections from anti-NGF transgenic mice (a) compared with age-matched controls (b). The communication between the two ventricles is because of mechanical rupture of the dorsal fornix, whose width is consistently reduced in all anti-NGF mice. (c and d) Staining for ChAT in the basal forebrain of anti-NGF transgenic mice (c) and control mice (d). Bar = 400 μm (a and b), 200 μm (c and d).
Cholinergic Deficit in the Basal Forebrain of Aged-Anti-NGF Mice.
In anti-NGF mice, the volume of the basal forebrain was equal to 5.7 109 ± 5.1 108 μm3, and it was not different from that measured in control mice (6.0 109 ± 5.8 108 μm3). The number of ChAT-positive BFCNs of aged anti-NGF mice (Fig. 1c) was dramatically decreased with respect to age-matched controls (Fig. 1d), in particular in the medial septum, where almost no ChAT-positive cells were detected. The stereological analysis revealed that the total number of BFCNs in anti-NGF mice was 2,538 ± 204, whereas in control mice, 6,400 ± 300 (P < 0.001), an overall reduction of 60%. In the medial septum, we observed a 93% decrease (260 ± 20 ChAT-positive neurons in anti-NGF mice vs. 4,266 ± 100 neurons in control mice).
Aged Anti-NGF Mice Show Amyloid Plaques.
The cortex, the neostriatum, and the hippocampus, as well as other areas of the brain of aged anti-NGF mice, contained a large number of APP-positive extracellular deposits (Fig. 2a), far more numerous than in transgenic controls (Fig. 2b). The amyloid deposits in anti-NGF mice had the typical fibrillary appearance of AD amyloid plaques (Fig. 2c). These plaques occupied a significant portion of the entorhinal cortex, with an amyloid burden equal to 21% of the total surface vs. a background value of 0.5% in control mice (n = 9 animals for each experimental group, P < 0.05). The plaque density was also significant, albeit lower, in other cortical areas (10% of total surface vs. 0.1% in control mice) and in the hippocampus (4%).
Figure 2.
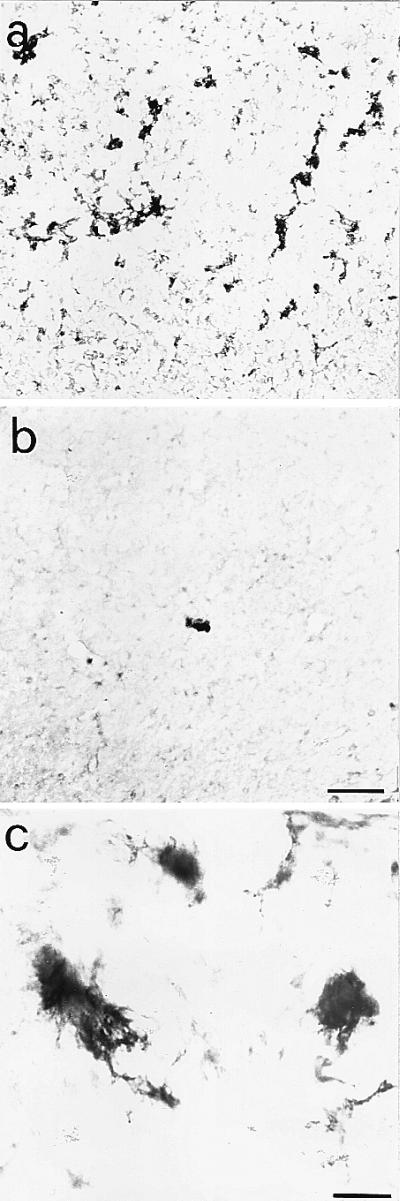
Amyloid deposits in the cortex of aged anti-NGF transgenic mice. Anti-APP immunoreactivity in cortical sections from anti-NGF (a) and control mice (b). The numerous extracellular amyloid deposits found in the cortex of anti-NGF transgenic mice show, at high magnification (c), a fibrillary nature. Bar = 75 μm (a and b), 25 μm (c).
Aged Anti-NGF Mice Show Hyperphosphorylated τ, Dystrophic Neurites, and Neurofibrillary Extracellular Depositions.
Immunostaining for the microtubule-associated protein τ with the phosphorylation-independent mAb ALZ50 (27) and the phosphorylation-dependent mAbs AT8 (28) and PHF-1 (29) demonstrated greatly increased labeling of neuronal and glial cells in the cortex and hippocampus of anti-NGF mice (Fig. 3 a, c, e) with respect to controls (Fig. 3 b and d). Neuronal labeling was mostly localized to the somatodendritic compartment of cortical and hippocampal neurons (Fig. 3 a, c, e). In aged anti-NGF mice, almost 90% of cortical neurons were strongly labeled by anti-τ antibodies directed against phosphorylation-dependent epitopes (Fig. 3c). Virtually no mAb AT8 labeling was observed in control mice (Fig. 3d). Many cortical cells appeared to contain AT8-positive intracellular tangles, entirely filling the cell cytoplasm (see arrow in Fig. 3e). In the cortex, mAb AT8 revealed also the presence of extracellular neurofibrillary deposits, neuropil threads, and dystrophic neurites (Fig. 3e). Phosphorylated τ was also expressed in a lower percentage of thalamic and hippocampal neurons. Treatment of tissue with AP before incubation with the AT-8 antibody drastically reduced the labeling (Fig. 3f), demonstrating that the staining by AT-8 was truly phosphorylation dependent.
Figure 3.

τ immunoreactivity in the brains of anti-NGF and control mice. (a) mAb Alz50 labels hippocampal interneurones (arrows) and glial cells (asterisk) in anti-NGF mice. (c) mAb AT8 labels cortical neurones in anti-NGF mice. No labeling is observed in control mice (b and d). (e) mAb AT8 labels tangle-like structures in neurones (arrow), neuropil threads (arrowhead), and extracellular neurofibrillary deposits (asterisk) in the cortex of anti-NGF mice. (f) Treatment of cortical slices from anti-NGF mice with AP abolishes the labeling by mAb AT8. (g and h) DNA fragmentation in cortical neurones of anti-NGF (g) and control mice (h). Bar = 25 μm (a, b, e, f), 75 μm (c, d, g, h).
DNA Fragmentation and Neuronal Loss in the Cortex of Anti-NGF Mice.
The terminal dUTP nicked endings labeling procedure demonstrated no sign of DNA fragmentation in the basal forebrain of anti-NGF transgenic mice (data not shown). DNA fragmentation, indicative of apoptosis, was found in a large number of cortical neurons from anti-NGF mice (Fig. 3g), but not from age-matched control mice (Fig. 3h). Indeed, neuronal counts in cresyl violet counterstained sections demonstrated a 34% reduction in the number of neurons in the frontal cortex of anti-NGF mice (2,972 ± 290 vs. 4,508 ± 392 in control mice, n = 3 mice for each experimental group).
Western Analysis of Aged Anti-NGF Mice Brains.
The increase in phosphorylated τ in the brain of transgenic mice was confirmed by Western blot analysis (Fig. 4). Brain extracts were normalized for total protein content with antitubulin antibodies (Fig. 4a). The total amount of τ revealed with mAb 7.51 (30) did not change in aged anti-NGF mice (Fig. 4b). Western blotting with the phosphorylation-dependent PHF-1 (Fig. 4c) and AT-8 (Fig. 4d) antibodies showed a marked increase in phosphorylated τ in anti-NGF mice, which is abolished by treatment of brain extracts with AP (Fig. 4c). The insoluble fraction of brain homogenates was treated with formic acid, a procedure known to release τ from insoluble fractions of AD brains (31). Western analysis revealed the increased presence of high molecular-weight τ immunoreactive species in anti-NGF transgenic mice (Fig. 4e).
Figure 4.

Western analysis of brain extracts from anti-NGF and control mice. Soluble brain extracts: blots were probed with mAbs YOL1 (a), 7.51 (b), PHF-1 (c Upper), PHF-1 after AP treatment (c Lower), AT8 (d), and anti-APP (f). (e) High molecular-weight PHF-1-immunoreactive τ in insoluble extracts from anti-NGF mice. In a and b and d–f, lanes 1–4 refer to controls and lanes 5–7 refer to anti-NGF mice. In c, lanes 1–2 refer to controls and lanes 3–5 to anti-NGF mice. Graphs report quantitative determinations of the intensities of relevant bands. In e, high molecular-weight immunoreactivity was included in the quantification. In f, two groups of bands were considered separately, around 120 kDa and around 25 kDa, respectively. Data represent the average of three experiments for each antibody. Mean ± SEM is shown (P < 0.05).
Western blot with anti-APP showed a differential processing of APP in aged anti-NGF mice, with an increase of the immunoreactive 120-kDa band and the appearance of a new 25 kDa band (Fig. 4f).
Tangle-Like Inclusions Are Observed in Aged Anti-NGF Mice.
Brain sections from anti-NGF mice were stained with mAb NFT200 (32, 33), a monoclonal antibody raised against human AD neurofibrillary tangles and recognizing the large neurofilament protein NT-H. This antibody labels neuropil threads, neurofibrillary tangles, and paired helical filaments in AD brains. mAb NFT200 revealed a widespread and intense labeling of many neurons throughout the brain of anti-NGF mice (Fig. 5 a, c, d), but not of control animals, (Fig. 5b). Flame-shaped neurofibrillary tangles in pyramidal neurons and dystrophic neurites were apparent.
Figure 5.

Immunostaining with the antitangle antibody mAb NFT200. (a–c) Sections through the parietal cortex (a, b) and the entorhinal cortex (c) of anti-NGF transgenic mice. The NFT200 antibody reveals the presence of tangles in pyramidal cells (arrows) and of dystrophic neurites (arrowheads). (d) No labeling is seen in sections from transgenic control mice. Bar = 25 μm.
Spatial Memory and Object Recognition Impairments in Aged Anti-NGF Mice.
The severe neuronal deficits observed in aged anti-NGF mice had behavioral correlates. The general motor activity of anti-NGF mice did not differ from that of control mice in the open field test (data not shown). For spatial learning, mice were tested in a radial maze (Fig. 6A). In aged anti-NGF mice, the initial learning curves did not differ significantly from those of control mice. However, when tested in the maze at day 44, i.e., 30 days after completion of the learning procedure, anti-NGF mice made a significantly higher number of errors than at day 14. In a subsequent transfer test (day 46 onwards), in which mice were exposed to a different disposition of the baits, anti-NGF mice showed a marked decrease in their ability to transfer their learning capacity to a new situation (Fig. 6A). Transgenic mice also showed a marked impairment in an object recognition test (Fig. 6B).
Figure 6.

Behavioral analysis. (A) Spatial learning curves for aged anti-NGF transgenic (n = 6, filled circles) and control mice (n = 6, open circles) mice in an eight-arm radial maze (four arms baited). Vertical bars are the standard errors. The number of arm entries necessary to find all four food pellets is reported as a function of time. Retention test 31 days after the end of the learning test. Transfer test started the day after the retention test. (B) Object recognition test revealing impairment in discrimination tasks. *, P < 0.03.
Neurodegeneration in Aged Anti-NGF Mice Is Progressive.
An initial study on the progression of the overall phenotype observed revealed that none of the phenotypic properties described was found in 1-month-old anti-NGF mice. Between the second and third months of age, concomitantly with a clear reduction of the number of ChAT-positive BFCNs (17), we observed the first appearance of neurons labeled with mAbs AT8 and PHF-1 in the entorhinal cortex, parietal cortex, and hippocampus, but not in other brain regions (Table 1). Although 2- to 3-month-old mice showed a behavioral impairment (17), possibly linked to an initial cholinergic deficit, amyloid plaques, DNA fragmentation, and neurofibrillary tangles were found only in aged anti-NGF mice (Table 1).
Table 1.
Progression of neurodegeneration in anti-NGF transgenic mice
| Phenotypic markers | Brain areas | Age, month
|
||
|---|---|---|---|---|
| 1 | 2–3 | 15 | ||
| ChAT reduction | − | + | ++ | |
| Hyperphosphorylated τ | Entorhinal cortex | − | + | ++ |
| Parietal cortex | − | − | ++ | |
| Occipital cortex | − | − | ++ | |
| Hippocampus | − | + | ++ | |
| Tangles | − | − | ++ | |
| Amyloid plaques | − | − | ++ | |
| Retention and transfer test | n.d. | +* | + | |
| DNA fragmentation | Cerebral cortex | − | − | ++ |
| Basal forebrain | − | − | − | |
The analysis was performed on six anti-NGF mice and six transgenic controls with the exception of 1-month-old mice, where the study was performed on three animals per experimental group. n.d., not done. + indicates a qualitative measure of each phenotypic marker.
The experiments were performed by using 4-month-old mice.
Discussion
AD is a progressive dementia that has a neuropathological background based on alterations in the processing and distribution of APP, an abnormal posttranslational processing of the microtubule-associated protein τ, and the formation of insoluble intracellular tangles. Neuronal loss and a selective vulnerability of BFCNs (34) constitute additional histopathological hallmarks of AD (35). Because NGF increases ChAT expression in BFCNs (36) and ameliorates spatial memory impairment in aged rats (8–10), recent studies proposed that NGF might be used as a potential therapeutic agent to prevent the degeneration of BFCNs in AD patients. However, to date no causal relationship between the development of AD and levels of NGF has been observed (12, 37), also because of the lack of a suitable experimental model.
In this paper, we have found that aged anti-NGF mice show massive and widespread neuronal loss, amyloid deposits, and extensive neurofibrillary pathology demonstrated with antitangle and antiphosphorylated τ antibodies. Moreover, these mice exhibited a severe cholinergic deficit in the basal forebrain and a behavioral impairment in retention and transfer of spatial memory tasks.
In Table 1, we show that the progression of neurodegeneration starts in 2-month-old mice with a decreased ChAT synthesis in BFCNs and an increased hyperphosphorylation of τ in the entorhinal cortex, one of the brain areas receiving projections from the basal forebrain. The absence of terminal deoxynucleotidyltransferase-mediated UTP end labeling staining in the basal forebrain does not allow a conclusion on the absence of BFCN loss, only on the absence of DNA fragmentation (and hence most likely of neuronal death by apoptosis) in those neurons.
Despite the lack of DNA fragmentation, the dramatic reduction of ChAT synthesis in BFCNs appears to be sufficient in initiating an altered processing of proteins in neurons of target brain areas, such as the entorhinal cortex.
On the whole, this phenotype has striking similarities to AD (19, 20, 34). Also the progression of the neurodegeneration observed in anti-NGF mice shows a correlation with the staging of AD, with the transentorhinal region showing the first signs of neurofibrillary lesions (38).
Current transgenic models for AD (39–41) are all based on the overexpression of wild-type or mutant forms of APP, τ, or presenilins, as suggested by mutations found in familial forms of AD and related diseases. Although different subsets of AD phenotypic traits are reproduced in these transgenic models, none of them recapitulate all features typical of AD. The anti-NGF mice described here represent a comprehensive transgenic model for AD, displaying a full complement of phenotypic hallmarks of the disease, including (26) an AD-linked muscular deficit defined as inclusion body myositis (IBM) (42). Previously described heterozygous NGF knockout mice (ngf +/−) showed a shrinkage of basal forebrain and hippocampal neurons and a 20% reduction of ChAT-positive BFCNs associated with behavioral deficits (43). However, the authors did not report any sign of AD-like neuropathology. This could be caused by (i) the more limited reduction of circulating NGF levels (25% of controls in ngf (+/−) (43) compared with >50% in anti-NGF mice) and/or (ii) the different developmental time course of the NGF reduction in the two transgenic models.
The connection between NGF deficits and AD neurodegeneration has been previously suggested on the basis of correlative observations (12). However, the lack of suitable animal models in which the activity of NGF is chronically blocked in the adult central nervous system has not allowed formal proof of whether a reduced level and/or efficacy of NGF signaling may play a role in the etiopathogenesis of AD. A prediction coming from our model is that one or more blocks down the NGF signaling cascade, or in the NGF transport system, could be present in AD.
Acknowledgments
We are grateful to Michal Novak for stimulating discussions and to Enrico Cherubini, Luciano Domenici, John Nicholls, and Andrea Nistri for critically reading the manuscript. The assistance of Massimo Righi with the preparation of figures is gratefully acknowledged. We thank Marco Stebel for the management of the colony. The initial part of this work was supported by a grant from the Human Frontier Science Program Organization (HFSPO RG 93/93).
Abbreviations
- NGF
nerve growth factor
- BFCN
basal forebrain cholinergic neurons
- AD
Alzheimer's disease
- AP
alkaline phosphatase
- ChAT
choline acetyltransferase
- APP
amyloid precursor protein
References
- 1.Levi-Montalcini R. Ann NY Acad Sci. 1952;55:330–343. doi: 10.1111/j.1749-6632.1952.tb26548.x. [DOI] [PubMed] [Google Scholar]
- 2.Lauterborn J C, Isackson P J, Gall C M. J Comp Neurol. 1991;306:439–446. doi: 10.1002/cne.903060308. [DOI] [PubMed] [Google Scholar]
- 3.Saporito M S, Carswell S. J Neurosci. 1995;15:2280–2286. doi: 10.1523/JNEUROSCI.15-03-02280.1995. [DOI] [PMC free article] [PubMed] [Google Scholar]
- 4.Korsching S, Auburger G, Heumann R, Scott J, Thoenen H. EMBO J. 1985;4:1389–1393. doi: 10.1002/j.1460-2075.1985.tb03791.x. [DOI] [PMC free article] [PubMed] [Google Scholar]
- 5.Mobley W C, Rutkowski J L, Tennekoon G I, Gemski J, Buchanan K, Johnston M V. Mol Brain Res. 1986;1:53–62. doi: 10.1016/0169-328x(86)90020-3. [DOI] [PubMed] [Google Scholar]
- 6.Hefti F. J Neurosci. 1986;6:2155–2162. doi: 10.1523/JNEUROSCI.06-08-02155.1986. [DOI] [PMC free article] [PubMed] [Google Scholar]
- 7.Smith D E, Roberts J, Gage F H, Tuszynski M H. Proc Natl Acad Sci USA. 1999;96:10893–10898. doi: 10.1073/pnas.96.19.10893. [DOI] [PMC free article] [PubMed] [Google Scholar]
- 8.Fischer W, Wictorin K, Björklund A, Williams L R, Varon S, Gage F H. Nature (London) 1987;329:65–68. doi: 10.1038/329065a0. [DOI] [PubMed] [Google Scholar]
- 9.Fischer W, Sirevaag A, Wiegand S J, Lindsay R, Björklund A. Proc Natl Acad Sci USA. 1994;91:8607–8611. doi: 10.1073/pnas.91.18.8607. [DOI] [PMC free article] [PubMed] [Google Scholar]
- 10.Markowska A L, Koliatsos V E, Breckler S J, Price D L, Olton D S. J Neurosci. 1994;14:4815–4824. doi: 10.1523/JNEUROSCI.14-08-04815.1994. [DOI] [PMC free article] [PubMed] [Google Scholar]
- 11.Bartus R T, Dean R L, III, Beer B, Lippa A S. Science. 1982;217:408–414. doi: 10.1126/science.7046051. [DOI] [PubMed] [Google Scholar]
- 12.Connor B, Dragunow M. Brain Res Rev. 1998;27:1–39. doi: 10.1016/s0165-0173(98)00004-6. [DOI] [PubMed] [Google Scholar]
- 13.Crowley C, Spencer S D, Nishimura M C, Chen K S, Pitts-Meek S, Armanini M P, Lanway H L, McMahon S B, Shelton D L, et al. Cell. 1994;76:1001–1011. doi: 10.1016/0092-8674(94)90378-6. [DOI] [PubMed] [Google Scholar]
- 14.Cattaneo A, Neuberger M S. EMBO J. 1987;6:2753–2758. doi: 10.1002/j.1460-2075.1987.tb02569.x. [DOI] [PMC free article] [PubMed] [Google Scholar]
- 15.Piccioli P, Ruberti F, Biocca S, Di Luzio A, Werge T M, Bradbury A, Cattaneo A. Proc Natl Acad Sci USA. 1991;88:5611–5615. doi: 10.1073/pnas.88.13.5611. [DOI] [PMC free article] [PubMed] [Google Scholar]
- 16.Piccioli P, Di Luzio A, Amann R, Schuligoi R, Azim Surani M, Donnerer J, Cattaneo A. Neuron. 1995;15:373–384. doi: 10.1016/0896-6273(95)90041-1. [DOI] [PubMed] [Google Scholar]
- 17.Ruberti F, Capsoni S, Comparini A, Di Daniel E, Franzot J, Gonfloni S, Rossi G, Berardi N, Cattaneo A. J Neurosci. 2000;20:2589–2601. doi: 10.1523/JNEUROSCI.20-07-02589.2000. [DOI] [PMC free article] [PubMed] [Google Scholar]
- 18.Cattaneo A, Rapposelli B, Calissano P. J Neurochem. 1988;50:1003–1010. doi: 10.1111/j.1471-4159.1988.tb10565.x. [DOI] [PubMed] [Google Scholar]
- 19.Selkoe D J. Neuron. 1991;6:487–498. doi: 10.1016/0896-6273(91)90052-2. [DOI] [PubMed] [Google Scholar]
- 20.Goedert M. Prog Brain Res. 1998;117:287–306. doi: 10.1016/s0079-6123(08)64022-4. [DOI] [PubMed] [Google Scholar]
- 21.Molnar M, Ruberti F, Cozzari C, Domenici L, Cattaneo A. Eur J Neurosci. 1998;10:3127–3140. doi: 10.1046/j.1460-9568.1998.00314.x. [DOI] [PubMed] [Google Scholar]
- 22.Franklin K, Paxinos G. The Mouse Brain in Stereotaxic Coordinates. San Diego: Academic; 1997. [Google Scholar]
- 23.Schenk D, Barbour R, Dunn W, Gordon G, Grajeda H, Guido T, Hu K, Huang J, Johnson-Wood K, Khan K, et al. Nature (London) 1999;400:173–177. doi: 10.1038/22124. [DOI] [PubMed] [Google Scholar]
- 24.Michel R P, Cruz-Orive L M. J Microsc. 1988;150:117–136. doi: 10.1111/j.1365-2818.1988.tb04603.x. [DOI] [PubMed] [Google Scholar]
- 25.West M J. Neurobiol Aging. 1993;14:275–285. doi: 10.1016/0197-4580(93)90112-o. [DOI] [PubMed] [Google Scholar]
- 26.Capsoni S, Ruberti F, Di Daniel E, Cattaneo A. J Neurosci Res. 2000;59:553–560. doi: 10.1002/(SICI)1097-4547(20000215)59:4<553::AID-JNR11>3.0.CO;2-4. [DOI] [PubMed] [Google Scholar]
- 27.Wolozin B L, Pruchnicki A, Dickson D W, Davies P. Science. 1986;232:648–650. doi: 10.1126/science.3083509. [DOI] [PubMed] [Google Scholar]
- 28.Biernat J, Mandelkow E M, Schroter C, Lichtenberg-Kraag B, Steiner B, Berling B, Meyer H, Mercken M, Vandermeeren A, Goedert M, et al. EMBO J. 1992;11:1593–1597. doi: 10.1002/j.1460-2075.1992.tb05204.x. [DOI] [PMC free article] [PubMed] [Google Scholar]
- 29.Lang E, Szendrei G I, Lee V H, Otvos L., Jr Biochem Biophys Res Commun. 1992;187:783–790. doi: 10.1016/0006-291x(92)91264-q. [DOI] [PubMed] [Google Scholar]
- 30.Novak M, Jakes R, Edwards P C, Milstein C, Wischik C M. Proc Natl Acad Sci USA. 1991;88:5837–5841. doi: 10.1073/pnas.88.13.5837. [DOI] [PMC free article] [PubMed] [Google Scholar]
- 31.Wischik C M, Novak M, Thogersen H C, Edwards P C, Runswick M J, Jakes R, Walker J E, Milstein C, Roth M, Klug A. Proc Natl Acad Sci USA. 1988;85:4506–4510. doi: 10.1073/pnas.85.12.4506. [DOI] [PMC free article] [PubMed] [Google Scholar]
- 32.Gheuens J, Cras P, Perry G, Boons J, Ceuterick-de Groote C, Lübke U, Mercken M, Tabaton M, Gambetti P L, Vandermeeren M, et al. Brain Res. 1991;558:43–52. doi: 10.1016/0006-8993(91)90712-5. [DOI] [PubMed] [Google Scholar]
- 33.Smith M A, Rudnicka-Nawrot M, Richey P L, Praprotnik D, Mulvihill P, Miller C A, Sayre L M, Perry G. J Neurochem. 1995;64:2660–2666. doi: 10.1046/j.1471-4159.1995.64062660.x. [DOI] [PubMed] [Google Scholar]
- 34.Whitehouse P J, Price D L, Struble R G, Clark A W, Coyle J T, Delon M R. Science. 1982;215:1237–1239. doi: 10.1126/science.7058341. [DOI] [PubMed] [Google Scholar]
- 35.Goedert M, Hasegawa M. Am J Pathol. 1999;154:1–6. doi: 10.1016/S0002-9440(10)65242-X. [DOI] [PMC free article] [PubMed] [Google Scholar]
- 36.Rylett R J, Goddard S, Schmidt B M, Williams L R. J Neurosci. 1993;13:3956–3963. doi: 10.1523/JNEUROSCI.13-09-03956.1993. [DOI] [PMC free article] [PubMed] [Google Scholar]
- 37.Hellweg R, Gericke C A, Jendroska K, Hartung H D, Cervos-Navarro J. Int J Dev Neurosci. 1998;16:787–794. doi: 10.1016/s0736-5748(98)00088-4. [DOI] [PubMed] [Google Scholar]
- 38.Braak H, Braak E. Acta Neuropathol (Berlin) 1991;82:239–259. doi: 10.1007/BF00308809. [DOI] [PubMed] [Google Scholar]
- 39.Sturchler-Pierrat C, Sommer B. Rev Neurosci. 1999;10:15–24. doi: 10.1515/revneuro.1999.10.1.15. [DOI] [PubMed] [Google Scholar]
- 40.Goedert M, Hasegawa M. Am J Pathol. 1999;154:1–6. doi: 10.1016/S0002-9440(10)65242-X. [DOI] [PMC free article] [PubMed] [Google Scholar]
- 41.Lee V M-Y, Trojanowski J Q. Neuron. 1999;24:507–510. doi: 10.1016/s0896-6273(00)81106-x. [DOI] [PubMed] [Google Scholar]
- 42.Vogel H. Adv Anat Pathol. 1998;5:164–169. doi: 10.1097/00125480-199805000-00003. [DOI] [PubMed] [Google Scholar]
- 43.Chen K S, Nishimura M C, Armanini M P, Crowley C, Spencer S D, Philipps H S. J Neurosci. 1997;17:7228–7296. doi: 10.1523/JNEUROSCI.17-19-07288.1997. [DOI] [PMC free article] [PubMed] [Google Scholar]