Abstract
Single bacterial spores were analyzed by using nonlinear Raman microspectroscopy based on coherent anti-Stokes Raman scattering (CARS). The Raman spectra were retrieved from CARS spectra and found to be in excellent agreement with conventionally collected Raman spectra. The phase retrieval method based on maximum entropy model revealed significant robustness to external noise. The direct comparison of signal amplitudes exhibited a factor of 100 stronger CARS signal, as compared with the Raman signal.
Keywords: microscopy, nonlinear optics, scattering stimulated, ultrafast optics
The real-time identification of bacterial endospores, e.g., anthrax, is a problem of current interest. In the present work, we report progress on the application of coherent anti-Stokes Raman scattering (CARS) to this problem.
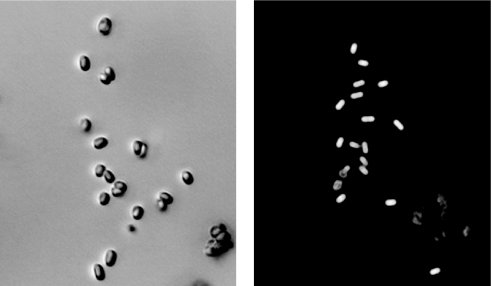
The choice of bacteria for our CARS experiments is mostly driven by the necessity of fast remote detection and recognition of anthrax (1–3). In particular, we study Bacillus subtilis endospores, which resemble anthrax endospores, and are, unlike anthrax, harmless. Fig. 1 shows microscopic images of B. subtilis endospores, obtained by regular and phase-contrast microscopy. As is well known, the calcium salt of 2,6-pyridinedicarboxylic acid [or dipicolinic acid (DPA)] is a major chemical component of bacterial endospores, accounting for >15% of its molecular weight (1). Recently, it was shown that the sensitivity of CARS spectroscopy is sufficient to allow discrimination of DPA against other similar molecules (4).
Fig. 1.
B. subtilis spores under the microscope. (Left) Regular optical microscopy. (Right) Phase-contrast microscopy. (Scale bar: 10 microns.)
The technological advances that enable us to make and interpret the measurements are of interest in and of themselves. CARS spectroscopy has provided a useful spectroscopic technique for the past 40 years, despite inherent difficulties as discussed below. However, recent years have witnessed renaissance of interest in CARS spectroscopy (5–13). This recent progress is driven mostly by technical developments in lasers, optics, electronics and computers, which facilitate the widespread use of this promising spectroscopic tool.
The conventional justification for the adoption of nonlinear Raman spectroscopy is based on two major arguments (14). The first is that the CARS signal is much stronger than the spontaneous Raman signal, and the second is that the CARS signal, being generated at the wavelength shorter than any of the pump wavelengths, is immune to fluorescent background, which is especially significant in biological samples. However, both of these arguments have to be seriously reconsidered, when implementing CARS microscopy for noninvasive imaging of biological objects. High-intensity laser pulses (1–10 kW of peak power is typically required to achieve significant level of CARS signals) can promote two-photon fluorescence and even lead to the cell's damage (15). At the same time, a high level of the CARS signal does not necessarily mean better signal-to-noise ratio because of the growing role of laser fluctuations and the presence of strong nonresonant background (14, 16). The detailed signal-to-noise analysis based on the state of the art of optical technologies in the late 1970s suggested that there was no particular advantage to nonlinear Raman spectroscopies for analytical detection of molecular species (14) at that time.
One of the most significant obstacles in the way of analytical applications of CARS spectroscopy was the nonresonant background, which modifies the spectral line shapes in the form of
 |
where Ar, ωr, and Γr are the amplitude, the transition frequency, and the line width, respectively of the rth Raman mode, and washes out the frequency-dependent signal caused by χR(3). The nonresonant susceptibility χNR(3) results from frequency-independent contributions to the optical mixing coefficients (14). The χNR(3) term in Eq. 1 dominates the resonant term for most of the practical situations outside of the diagnostics of gaseous species, which are characterized by narrow lines and, thus, strong resonances. A small fluctuation of a relatively large background is sufficient to obscure the meaningful signal.
To make CARS spectroscopy a user-friendly technique, one has to successfully address the above problems, while keeping an apparatus simple and inexpensive. We have recently developed a simple “one-laser” approach to CARS microspectroscopy, which uses a single-picosecond laser oscillator to generate a broadband continuum that is then mixed with the fundamental beam to generate a full CARS spectrum (15). The large number of already existing Ti:sapphire lasers facilitates the widespread implementation of this method (11, 12, 17).
Significant efforts have been devoted to unveiling the resonant contribution. Heterodyne (18) and polarization-sensitive detection schemes (19), and time-delayed methods (20), have been refined to a high degree of sophistication (8–11); however, most of those studies were limited to the characterization of molecular systems, which possess relatively simple vibrational spectrum and have rather large Raman cross-sections. In many recent applications, the retrieval of Raman spectrum required an additional scanning of the time delay between pump pulses, which extends the acquisition time and diminishes the advantages of CARS spectroscopy as the way for instant access to the molecular “fingerprint” spectral information. The alternative approach was first introduced by Vartiainen (21) and was recently applied by Mülle's group (22) to extract information about Raman lines of complex solutions without sacrificing the signal-to-noise ratio. In brief, the maximum entropy method, which is widely used for signal and image analysis of noisy data, is a noniterative method, which, instead of trying to fit Eq. 1 with a set of parameters Ar, ωr, and Γr, directly searches for the imaginary and real part of χR(3). The latter is possible if there exists a frequency for which the imaginary part of χR(3) is equal to 0 (21). We note that this method is ideally suitable for a broadband CARS microspectroscopy, because a typical CARS spectrum collected with our CARS microscopic set-up extends from 300 to 2,000 cm−1 (23), i.e., to the spectral region 1,800–2,000 cm−1 where there are no Raman transitions [Im(χ(3)) = 0]. This method also does not require any precise polarization setting, as it was used in our previous imaging studies of bacterial spores (2) and led to a rejection of a substantial fraction of the CARS signal.
In this study, we used two different color schemes to collect CARS spectra from individual bacterial endospores, sparsely spread on a glass slide. The spectra were retrieved by using the maximum entropy method (21, 22), and the results were compared with the Raman data for those endospores (2, 3).
Deriving the Ratio of CARS to Spontaneous Raman Signals
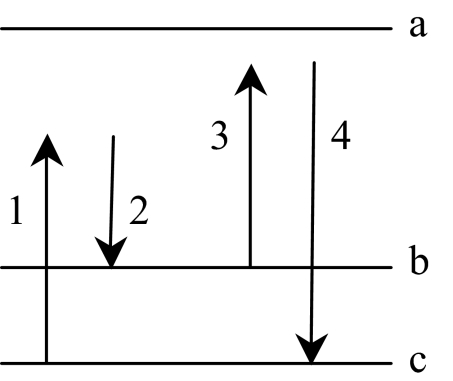
To quantify the difference between CARS and spontaneous Raman scattering, we calculate the number of detected photons for coherent (directional) CARS and incoherent (spherical) spontaneous Raman processes. We write the interaction Hamiltonian (in the notation of Fig. 2 for the CARS case) as
We proceed by using Eq. 2 to write the equation of motion for the annihilation operator â4 and integrating to obtain
 |
where Δω43 = v4 − v3 − ωbc + iγbc, and G34 represents molecular-photon coupling constant. The average of the CARS photon number operator is then given by 〈n̂4〉 = 〈ψ|â4†â4|ψ〉, where the atom-field state vector is |ψ〉 = |α3, 04〉Πj|φj〉, for the case in which the anti-Stokes field is originally in the vacuum state, the probe field is in the Glauber coherent state α̂3 and the jth atom is in the state |φj〉 = Cj|c〉j + Bj|b〉j.
Fig. 2.
Molecular energy level diagram in which fields 1 and 2 prepare the vibrational levels with a ground-state coherence ρbc. Field 3 then scatters off the coherence, generating the anti-Stoke field 4.
Finally, we note that the |b〉j state amplitude will go as ei(k⃗1−k⃗2)·r⃗j after preparation, and introduce the notation Bj = bjei(k⃗1−k⃗2)·r⃗j, Cj = cj. In view of the preceding, we find
 |
where ρbcj = bjc*j and n̄3 = α*3α3.
In the limit of a sufficiently large number of molecules in volume V
 |
where κ⃗ = k⃗3 + k⃗1 − k⃗2.
Now, we may write
where Ω4 is the “solid angle” unit vector pointing in the k⃗4 direction. Assuming all molecules are in the same state so that ρbc j = ρbc etc., and that k⃗4 corresponds to the phase-matched conditions, we have the ratio of the number of photons generated through coherent anti-Stokes (or Stokes) scattering to the number of spontaneously scattered (Stokes) Raman photons, equal to
where we have used the fact that
 |
in the phase-matched condition, where R is the sample radius. The spontaneous Raman signal is integrated over all directions. The coherence ρbc is produced by preparation laser pulses and quantifies the extent to which all molecules of the sample are made to oscillate in unison (in the CARS scheme). The numerical aperture of the collection optics (for the spherically emitted spontaneous Raman photons) will enter the denominator of Eq. 7.
Eq. 7 provides an intuitive means for comparing the efficiencies of coherent vs. incoherent processes. Its physical interpretation is very clear: at maximal coherence (ρbc = 1/2) the ratio of those efficiencies roughly equals to the total number of molecules (counted through the sample thickness) per λ2 area (where λ is the wavelength of scattered light). This makes sense, because fields produced by coherent emitters add up in amplitude, such that the intensity grows as the number of coherent emitters squared, while the intensity of incoherent emission is simply proportional to the number of emitters.
Experimental Results
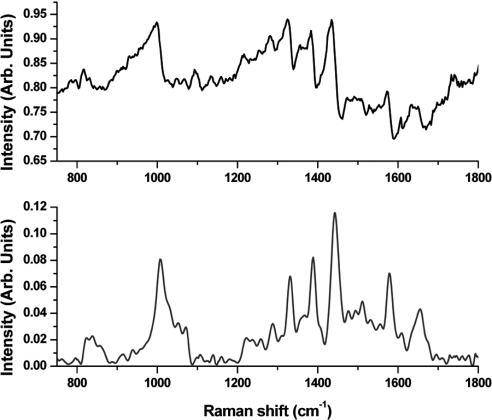
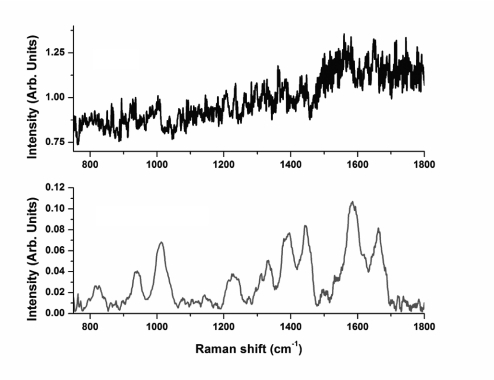
The CARS spectra collected in the visible (532/1064/continuum, or “three-color” geometry) and in the near-IR (1064/1064/continuum, or “two-color” geometry) spectral ranges are shown in Figs. 3 and 4, respectively. The retrieved Raman spectra were passed through the Fourier filter and further smoothened to remove fast oscillating components and slow-varying envelopes. These retrieved spectra are shown in Figs. 3 Lower and 4 Lower. While Raman modes for both experimental conditions were excited by using the same laser frequencies, the broadband continuum for two-color geometry was derived from a photonic crystal fiber. It has the advantages over the GeO2 fiber of a larger core diameter, which simplifies fiber alignment, an ability to generate without photo-degradation larger Stokes shifts, which allow CARS measurements in the spectral region of 2,700–3,000 cm−1, and a low dispersion, which minimizes the temporal spreading of the broadband continuum on the output of the fiber. However, the GeO2 fiber leads to the broadband continuum with a higher spectral brightness and much smoother and less noisy spectrum (23). The later is reflected in the noise level of the CARS spectra. The additional noise of the CARS spectra in the near-IR region (Fig. 4), as compared with the CARS spectra in the visible region (Fig. 3), is caused by the intrinsic noise of the CCD detector. The deep-depletion CCD has a larger read-out noise, and thermoelectrical cooling results in a significantly larger thermal noise. However, despite of the noise of the CARS signal in the near-IR spectral region, the retrieved Raman spectrum shows, the same way as the retrieved Raman spectrum from the CARS signal in the visible region, all of the spectral characteristic features of B. subtilis spores: 822 cm−1 (calcium dipicolinate, CaDPA), 1,001–1,013 cm−1 (phenylalanine ring-breathing mode, CaDPA), 1,245 cm−1 (amide III), 1,395 cm−1 (CaDPA), 1,445 cm−1 (CaDPA and the protein C–H deformation), 1,572 cm−1 (CaDPA), and 1,650 cm−1 (amide I) (3). These retrieved Raman spectra are also in the excellent agreement with our own Raman data recorded with the 633-nm excitation wavelength (2). The line ≈930 cm−1, which appears in the retrieved Raman spectrum from the two-color CARS signal, is attributed to the residual background signal from a glass substrate, which has a weak Raman line in this region. Because the interaction length for the two-color CARS geometry is estimated to be slightly larger than 1 μm, which is approximately equal to the single spore diameter, we believe that this line is not related to the actual bacterial spores. The above argument is supported by the Raman spectrum retrieved from the three-color CARS signal, for which the interaction length is estimated to be at least a factor of two smaller and for which this line is not pronounced.
Fig. 3.
CARS (Upper) and retrieved Raman (Lower) spectra of a single bacteria spore. Shown is three-color geometry (532 nm, 1,064 nm, and broadband continuum).
Fig. 4.
CARS (Upper) and retrieved Raman (Lower) spectra of a single bacteria spore. Shown is two-color geometry (1,064 nm and broadband continuum).
By comparing the retrieved Raman spectra in Figs. 3 and 4, one notices not only similarities but also significant differences both in the shape and the relative amplitudes of Raman lines. The later can be explained by a significant difference in the excitation wavelengths and the vicinity of electronic transitions near the excitation wavelength of 532 nm, which is, in part, manifested by the increased fluorescence signal excited by 532-nm excitation, as compared with 633-nm excitation.
Experimental Set-Up and Methods
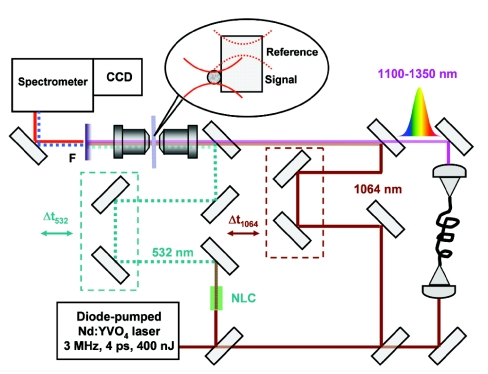
The endospores were deposited on a glass substrate and placed in the focal plane of the microscopic optical set-up similar to the one used in our previous studies (2, 23). The present set-up is schematically shown in Fig. 5 and has several important advantages over the previous apparatus. We added an additional pump beam channel by doubling the fundamental frequency of an oscillator to generate ω3 [to produce CARS signal at ω4 = ω3 + (ω1 − ω2), where ω1 refers to the fundamental wavelength centered at 1,064 nm and ω2 refers to the broadband continuum generated in either GeO2 fiber or photonics crystal fiber (2, 23, 24)]. This modification gives an additional flexibility to the experimental set-up, while providing a direct way of comparing amplitudes of the CARS and Raman signals. The other improvements are on the detection end of the system. We have improved the spectral resolution from ≈10–15 cm−1 to <5 cm−1 by replacing the input spectrometer fiber with the one with a smaller core diameter. We have added an additional CCD detector (DU401A-BRDD; Andor Technology, Inc., South Windsor, CT), whose efficiency is optimized for the near-IR (≈900 nm) spectral region. It results in the signal level capable of saturating the detector within 50 ms when measuring CARS spectra from nonabsorbing polymer films.
Fig. 5.
A schematic diagram of the experimental CARS set-up. F indicates a set of filters rejecting all pump beams, but transmitting CARS signal. NLC indicates a 4-mm-long LBO crystal. Two delay lines are used to ensure the temporal overlap of all beams on the sample.
For all of the CARS measurements, we take a reference CARS spectrum from a transparent glass substrate, which does not have any significant Raman lines >1,000 cm−1, and use it for normalization of the CARS spectrum taken from an object of interest. This way most of the spectral modulations, which are caused by spectral power variations of the broadband continuum, spectral transmission of filters and spectrometer, and imperfections of the spatial overlap of different frequency components in the focal plane of a microscope objective, disappear, and the residual spectrum is a rather smooth function of frequency with the noise predominantly originating from the read-out, thermal, and shot noise of a CCD and from the intensity modulations of the broadband continuum. The latter are especially pronounced if a photonic crystal fiber (SC-5.0–1040; ThorLabs, Inc., Newton, NJ) is used instead of a GeO2-doped fiber (23).
We note that our experimental set-up also allows simultaneous measurements of the Raman spectra. To do so, we just have to block the broadband continuum and change the filter setting to allow the Raman signal to pass through. Because we are using the Si detectors, no Raman measurements are possible with the 1,064-nm excitation beam. With the 532-nm excitation beam and holographic notch filter in the detection arm, we are able to observe simultaneously both the blue-shifted CARS signal and the red-shifted Raman signal. Therefore, the amplitude of the Raman signal can be directly compared with variations of the non-normalized CARS signal near a certain Raman line. We used amide I band (at ≈1,650 cm−1), for which we found the amplitude of the CARS signal variation to be somewhat ≈100 times stronger than the corresponding amplitude of the Raman signal. For these measurements we collected both CARS and Raman signal with a microscope objective with numerical aperture of 0.55 and, to excite CARS signal, used near-IR beams with the peak power of ≈1 kW. Because the nonresonant contribution dominates the CARS signal, the above-measured amplitude modulation of the CARS signal is proportional to χR(3), i.e., to both the concentration of molecular species and their Raman cross-sections. Thus, the ratio of the above-defined strength of the CARS signal to the strength of the Raman signal will be determined only by the collection optics and the incident power of the near-IR beams, which coherently excite the Raman transition (Eq. 7).
To analyze the CARS signal and retrieve the Raman spectra, we used the approach described in detail by Vartianen et al. (21, 22). All spectra were collected in transmission geometry with the best-available spectral resolution and with the maximum number of data points recorded (typically, 2,048 for the visible and 4,096 for the near-IR CARS spectra). For the CARS spectra recorded in the visible spectral range, we used the back-illuminated liquid-nitrogen-cooled CCD (Jobin-Yvon, Inc., Longjumeau, France), and for the CARS spectra recorded in the near-IR region the deep-depletion thermoelectrically cooled CCD (Andor Technology, Inc.) was used.
Conclusion
In summary, we have unambiguously compared the analytical capabilities of CARS and Raman microspectroscopy to detect chemical and biological species. It has been demonstrated that the retrieval of CARS spectra leads to high-quality Raman spectra even in the presence of significant noise. The CARS spectroscopy is found to be at least two orders of magnitude more efficient than spectroscopy of spontaneous Raman scattering and, thus, can lead to a 100 times faster remote sensing and detection of biohazards. Using Eq. 7, and assuming 109 DPA molecules in the single endospore, we estimate the prepared molecular coherence to be |ρbc| = 10−4.
Acknowledgments
We thank Peter Setlow of the University of Connecticut Health Center (Farmington, CT) for supplying endospore samples and the Texas A&M University Microscopy and Imaging Center for help with obtaining the microscopic images shown in Fig. 2. This work was supported by National Science Foundation Awards ECS-9984225 and PHY-0354897, National Institutes of Health Grant RR14257, the Office of Naval Research, the Defense Advanced Research Projects Agency, an Award from the Research Corporation, and Robert A. Welch Foundation Grants A1261 and 1547.
Abbreviations
- CARS
coherent anti-Stokes Raman scattering
- DPA
dipicolinic acid
- CaDPA
calcium dipicolinate.
Footnotes
The authors declare no conflict of interest.
References
- 1.Scully MO, Kattawar GW, Lucht RP, Opatrny T, Pilloff H, Rebane A, Sokolov AV, Zubairy MS. Proc Natl Acad Sci USA. 2002;99:10994–11001. doi: 10.1073/pnas.172290899. [DOI] [PMC free article] [PubMed] [Google Scholar]
- 2.Petrov GI, Yakovlev VV, Sokolov A, Scully M. Opt Express. 2005;13:9537–9542. doi: 10.1364/opex.13.009537. [DOI] [PubMed] [Google Scholar]
- 3.Esposito AP, Talley CE, Huser T, Hollars CW, Schaldach CM, Lane SM. Appl Spectrosc. 2003;57:868–871. doi: 10.1366/000370203322102979. [DOI] [PubMed] [Google Scholar]
- 4.Dogariu A, Huang Y, Avitzour Y, Murawski RK, Scully MO. Opt Lett. 2006;31:3176–3178. doi: 10.1364/ol.31.003176. [DOI] [PubMed] [Google Scholar]
- 5.Potma EO, de Boeij WP, van Haastert PJM, Wiersma DA. Proc Natl Acad Sci USA. 2001;98:1577–1582. doi: 10.1073/pnas.031575698. [DOI] [PMC free article] [PubMed] [Google Scholar]
- 6.Evans CL, Potma EO, Puoris'haag M, Cote D, Lin CP, Xie XS. Proc Natl Acad Sci USA. 2005;102:16807–16812. doi: 10.1073/pnas.0508282102. [DOI] [PMC free article] [PubMed] [Google Scholar]
- 7.Wurpel GWH, Schins JM, Müller M. Opt Lett. 2002;27:1093–1095. doi: 10.1364/ol.27.001093. [DOI] [PubMed] [Google Scholar]
- 8.Marks DL, Boppart SA. Phys Rev Lett. 2004;92:123905. doi: 10.1103/PhysRevLett.92.123905. [DOI] [PubMed] [Google Scholar]
- 9.Dudovich N, Oron D, Silberberg Y. Nature. 2002;418:512–514. doi: 10.1038/nature00933. [DOI] [PubMed] [Google Scholar]
- 10.Volkmer A. J Phys D. 2005;38:R59–R81. [Google Scholar]
- 11.Kee TW, Zhao HX, Cicerone MT. Opt Express. 2006;14:3631–3640. doi: 10.1364/oe.14.003631. [DOI] [PMC free article] [PubMed] [Google Scholar]
- 12.Kano H, Hamaguchi H. Opt Express. 2006;14:2798–2804. doi: 10.1364/oe.14.002798. [DOI] [PubMed] [Google Scholar]
- 13.Rodriguez LG, Lockett SJ, Holtom GR. Cytometry. 2006;69:779–791. doi: 10.1002/cyto.a.20299. [DOI] [PubMed] [Google Scholar]
- 14.Levenson MD, editor. Introduction to Nonlinear Laser Spectroscopy. New York: Academic; 1982. pp. 115–160. [Google Scholar]
- 15.Yakovlev VV. J Raman Spectrosc. 2003;34:957–964. [Google Scholar]
- 16.Tolles WM, Turner RD. Appl Spectrosc. 1977;31:96–103. [Google Scholar]
- 17.Sidorov-Biryukov DA, Serebryannikov EE, Zheltikov AM. Opt Lett. 2006;31:2323–2325. doi: 10.1364/ol.31.002323. [DOI] [PubMed] [Google Scholar]
- 18.Song JJ, Eesley GL, Levenson MD. Appl Phys Lett. 1976;29:567–569. [Google Scholar]
- 19.Oudar JL, Smith RW, Shen YR. Appl Phys Lett. 1979;34:758–760. [Google Scholar]
- 20.Laubereau A, Kaise W. Rev Mod Phys. 1978;50:607–665. [Google Scholar]
- 21.Vartianinen EM. J Opt Soc Am B. 1992;9:1209–1214. [Google Scholar]
- 22.Vartianen EM, Rinia HA, Mülle M, Bonn M. Opt Express. 2006;14:3622–3630. doi: 10.1364/oe.14.003622. [DOI] [PubMed] [Google Scholar]
- 23.Petrov GI, Yakovlev VV. Opt Express. 2005;13:1299–1306. doi: 10.1364/opex.13.001299. [DOI] [PubMed] [Google Scholar]
- 24.Petrov GI, Yakovlev VV, Minkovski NI. Opt Commun. 2004;229:441–445. [Google Scholar]


