

Abstract
Although there are indications of growth in the size and myelination of the rat corpus callosum during adulthood, it is not known how long this growth continues. In addition, the potential for age-related changes in these measures to affect the sex differences seen in adulthood has not been examined. Here the size of callosal subregions and area occupied by myelin were examined in the genu and splenium of male and female rats in adulthood, middle-age, and old age. Our findings revealed increases both in size and in the area composed of myelin between adulthood and middle-age that were maintained into old age, with no indications of age-related loss in either the genu or splenium of the rat.
Keywords: aging, sex differences, genu, splenium, myelination
1. Introduction
There is recent evidence that the process of myelination in the rat corpus callosum continues into adulthood, and this may underlie continuing increases in callosal size. Previous work from our laboratory indicates that increases in size and myelination in the rat splenium continue at least beyond 120 days of age (Nunez et al., 2000), and others have found increases in callosal area after 12 months of age (Sullivan et al., 2006). Evidence for continued myelination in the adult corpus callosum has also been found in the cat (Looney & Elberger, 1986) and mouse (Sturrock, 1980), and continued increases in white matter volume have also been reported in humans until middle-age (Bartzokis et al., 2001; Courchesne et al., 2000). How long myelination continues in the rat corpus callosum is unknown.
Sex differences have also been found in the size of the rat corpus callosum, including the splenium (posterior 20% of the corpus callosum) (Nunez & Juraska, 1998), with males having a larger callosal area compared to females (Berrebi et al., 1988; Bimonte et al, 2000; Bimonte, Fitch, & Denenberg, 2000; Fitch et al., 1991). Differences in callosal area reflect differences in the underlying axonal composition of the corpus callosum. Males have a higher number of myelinated axons in the splenium (Kim & Juraska, 1997) and a higher myelinated to unmyelinated axon ratio in the genu (Mack et al, 1995) which results in a larger area of the corpus callosum in males due to the substantially larger size of myelinated axons (Kim & Juraska, 1997). Males and females differ in the timing of splenial axon development between days 15 and 60 (Kim & Juraska, 1997), but possible sex differences in the course of aging in the rat corpus callosum have not been investigated. Continued growth or age-related loss in the corpus callosum could alter the sex differences present in adulthood. For example, losses associated with aging may eliminate sex differences as in other regions of the rat brain (Markham et al., 2005; Markham & Juraska, 2002). The present study investigated possible age-related changes and the influence of sex on the size and on the area occupied by myelin in the genu and splenium of the corpus callosum in adulthood, middle-age, and old age.
2. Results
Analyses of variance were run for brain weight, callosal size, area occupied by and proportion of myelin and of other material using Systat (Version 11, 2004). The factors were age (adult, middle-age, and old), sex (male, female), and region (genu, splenium). The infrequent occurrence of glial cell bodies (mean= 38/1100 counts in the genu and 29/1320 counts in the splenium) and blood vessels (mean= 17/1100 counts in the genu and 3/1320 counts in the splenium) resulted in counts that were insufficient for analysis. Estrous phase and estropausal state showed no significant effect on any variable, so that at each age, all females were combined. Due to the large age range in the old group, comparisons of old (18–21 months) and oldest old (22–26 months) animals were made. However, no significant differences were found between the old and oldest old groups. For example, the area of the genu was 0.62 in old animals compared to 0.64 in the oldest animals and in the splenium the area for old animals was 0.77 compared to 0.78 in the oldest animals. As a result, data from these ages were combined.
Brain weights showed significant effects of sex (p=.001) and age (p=.001). Males had larger brains compared to females at all ages, and brain weights increased with age (4% from adulthood to middle age; 5% from middle to old age).
For area, there were significant effects of sex (p=.001; male>female), age (p=.001; older>younger), and region (p=.001; splenium>genu) (Fig. 1). Post-hoc analysis of the age effect showed significant increases in area between adult and middle-age animals (p=.029) and between adult and old animals (p=.005) but not between middle and old age (p<.80). Neither sex nor age interacted with region, indicating that similar patterns were occurring in both the genu and splenium. There was also a strong trend for a sex by age interaction (p=.052), resulting from two different patterns of change. One was an increase in size between adulthood and middle-age for females (p=.001) but not males. In addition, sex differences (male>female) were also found in both adult (p=.002) and old age animals (p=.001), but not in middle-age. Thus, both sex and aged-related differences in these subregions of the corpus callosum did not completely parallel the differences in overall brain weight.
Figure 1.
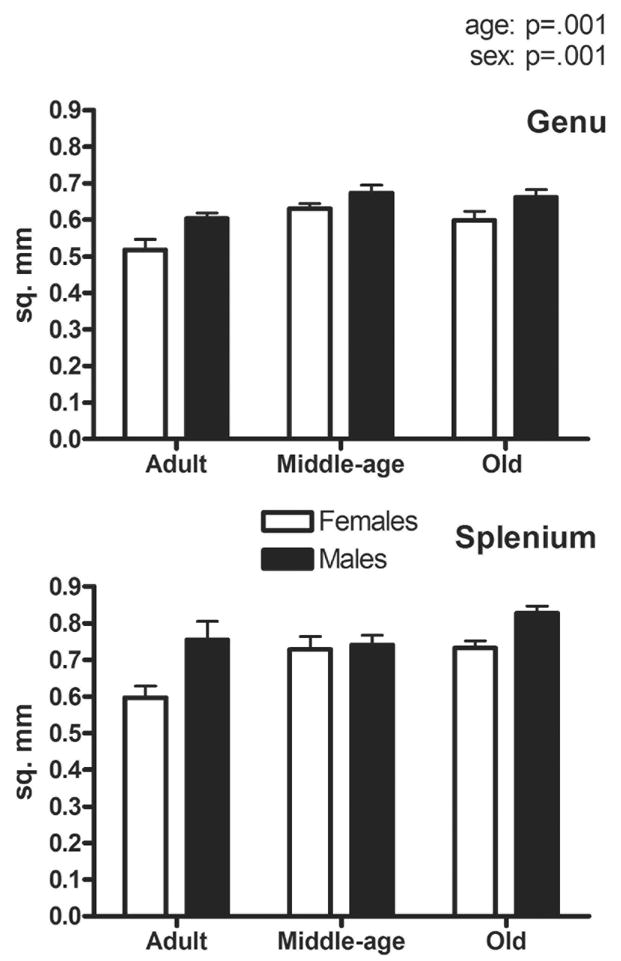
Overall area (mm2) of the genu (A) and splenium (B). Significant effects of age (p=.001), sex (p=.001), region (p=.001), and a trend for a sex by age interaction (p=.052) were found.
The area occupied by myelin (proportion multiplied by area) showed a significant effect of sex (p=.002; male > female), but no effect of region or age (Fig. 2). A similar pattern was found for both regions. Post-hoc analyses showed a trend for an increase in area occupied by myelin between adulthood and middle-age (p=.077). In addition, the proportion of grid intersections occupied by myelinated axons showed no significant effect of age or sex. In all, this indicates that myelination was maintained into old age.
Figure 2.
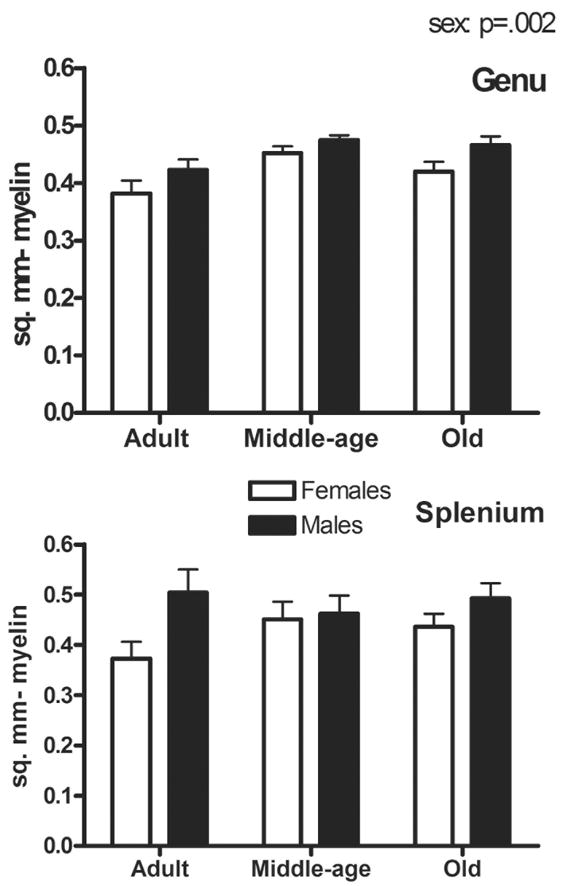
Area occupied by myelin (mm2) in the genu (A) and splenium (B). A significant effect of sex (p=.002) but not age was found.
The area occupied by other material (glial processes and unmyelinated axons, which are not resolvable using the light microscope) showed an effect of age (p=.014; older>younger) and region (p=.001; splenium>genu) but only a trend for an effect of sex (p=.068; male>female) (Fig. 3). The effect of age is seen in post-hoc analysis as a trend towards an increase between adult and old age animals (p=.074). The proportion of grid intersections overlapping other material did not reveal differences due to age or sex.
Figure 3.
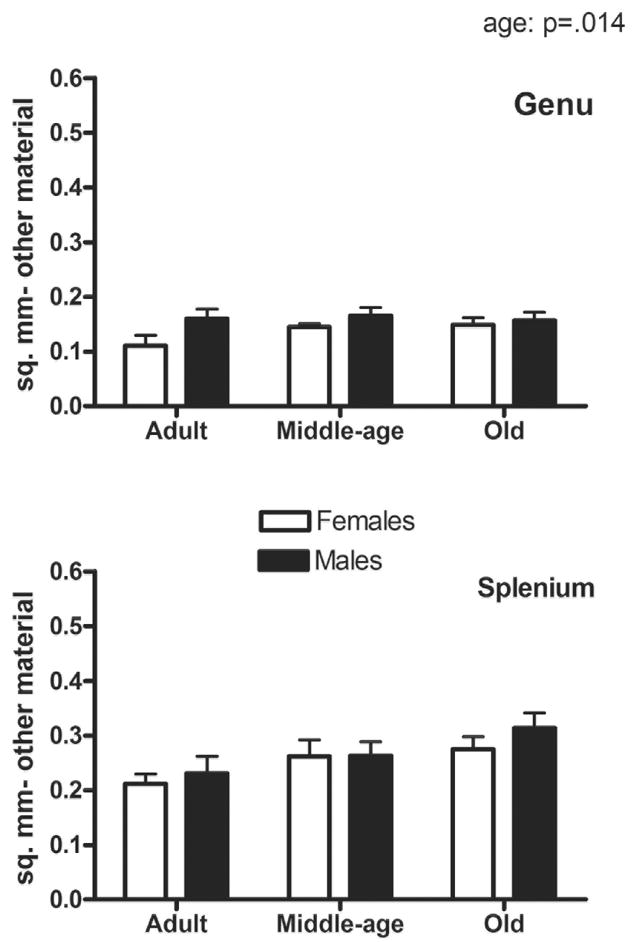
Area occupied by other material (mm2) in the genu (A) and splenium (B). Effects of age (p=.014) and region (p=.001) were found, as well as a trend for an effect of sex (p=.068).
3. Discussion
Increases in size and myelination occurred between adulthood and middle-age in the splenium and genu of the rat corpus callosum and were stable into old age. These changes fit with previous reports of callosal growth and continued myelination in adult rats and humans (Sullivan et al., 2006; Nunez et al., 2000; Bartzokis et al., 2001; Courschesne et al., 2000; Steen et al., 1997), as well as continued myelination in adult cats and mice (Looney & Elberger, 1986; Sturrock, 1980). Reports of increases in corpus callosum size are partially the result of continuing myelination, due to the large size of myelinated axons (0.35μm diameter for myelinated axons, not including the myelin sheath compared to 0.16μm diameter of unmyelinated axons; Kim & Juraska, 1997). Increases in other material (glial processes and unmyelinated axons) also contribute to the growth in size but to a lesser degree because of the lower proportion of area occupied by other material. Glial processes may increase with age, resulting in a larger area occupied by other material. Such age-related changes in glia have been reported in parietal cortex of the rat, where increases in density and area of astrocytes have been found between adulthood and old age (Björklund et al., 1985; Peinado et al., 1998).
Consistent with previous work in our laboratory, we found a sex difference in size and myelination in the splenium (Kim, Ellman, & Juraska, 1996; Nunez & Juraska, 1998). We also found similar sex differences in size and myelination in the genu. Interestingly, we found that only females showed increases in callosal size between adulthood and middle-age. This is similar to a study in humans in which females continued to show an increase in callosal area into middle-age while males did not (Cowell et al., 1992). In the present study, sex differences were still present in old age, due to the absence of any age related losses in the size of the genu and splenium as well as in total brain weight. This is in contrast to the age-related elimination of sex differences in the dendritic tree in other regions of the rat brain, such as the anterior cingulate cortex and hippocampus (Markham et al., 2005; Markham & Juraska, 2002). In these regions, greater age-related deterioration in males eliminated the sex differences in the dendritic tree. Possible reasons for some areas remaining protected from deterioration during aging remain unclear.
Even though remyelination is slower in aging rats (Shields et al., 1999; Sim et al., 2002), the continuing ability of the adult rat brain to produce myelin may help to improve chances of remyelination in cases of injury or in response to demyelinating diseases. Remyelination progresses faster in aging female rats compared to males however (Li et al., 2006), possibly reflecting the greater oligodendrocyte proliferation and turnover in females (Cerghet et al., 2006).
In the current study, we report increases between adulthood and middle age in size and myelination in the genu and splenium, which is similar to work in humans showing continued increases in white matter into middle-age (Bartzokis et al., 2001; Courchesne et al, 2000). However, our data also show that these measures are maintained in old age which is in contrast to the loss of white matter volume and corpus callosum size found in aging humans (Sullivan et al., 2002; Resnick et al., 2003; Fotenos et al., 2005; Walhovd et al., 2005; Bartzokis et al., 2001; Allen et al., 2005; Jernigan et al., 2001; Sowell et al., 2003; Courchesne et al., 2000). While frontal regions sometimes show greater susceptibility to age-related deterioration in humans (Resnick et al., 2003; Raz et al., 1997), we saw no loss in either the genu or splenium. Evidence of myelin loss with age in humans is further supported by diffusion tensor imaging studies which show decreases in fractional anisotropy and increased diffusivity in white matter (including the corpus callosum), which reflects a breakdown of the underlying axon structure (O’Sullivan et al., 2001; Ota et al., 2006; Sullivan, Adalsteinsson, & Pfefferbaum 2006). Similar to the volumetric data, diffusion tensor imaging studies show evidence of greater age-related deterioration in anterior regions of white matter and the corpus callosum (O’Sullivan et al., 2001; Ota et al., 2006; Sullivan, Adalsteinsson, & Pfefferbaum 2006; Abe et al., 2002; Sullivan et al., 2001; Salat et al., 2005).
In aging humans, smaller corpus callosum size (Ryberg et al., 2006) and reductions in fractional anisotropy (Sullivan, Adalsteinsson, & Pfefferbaum 2006) have been related to poorer cognitive performance. While the aging rat does experience cognitive decline on hippocampal based tasks such as the spatial version of the Morris water maze, the eight-arm radial maze, and the Barnes circular platform task (reviewed by Rosenzweig & Barnes, 2003), and an attentional set-shifting task that requires the medial prefrontal cortex (Barense et al., 2002), the possible implications of corpus callosum size on cognitive performance in rats have not been examined. Sex differences in aged rats are largely unexplored. These data imply that any task that did depend on the integrity of the corpus callosum would probably continue to show sex differences into old age. However at this point, it is clear that the known age-related cognitive declines in rats are not the result of obvious callosal deterioration.
The absence of any age-related loss in size or myelination of the genu and splenium suggests that the rat corpus callosum is preserved from substantial age-related loss. It does not however eliminate the possibility of more subtle changes occurring at an underlying level, such as alterations in the paranodal junction of myelinated fibers that occur with age in the rat (Sugiyama et al, 2002). Nevertheless, the rat does not show the gross changes in white matter that humans undergo with age. On a speculative note, it is possible that the controlled experiences of laboratory rats have eliminated two critical factors that have been shown to impact aging: stress and immune challenges across the lifespan (Lupien et al, 1998; Brunson et al, 2005; Sandi & Touyarot, 2006; Montaron et al., 2006; Godbout & Johnson, 2006). Why the corpus callosum of the laboratory rat does not age as readily as the human may be worth exploring to better understand the course of human aging.
4. Experimental procedure
Subjects were Long-Evans hooded rats in three age groups. Adult animals were 4 months old, middle-age animals were 12–13 months old (mean=12.8 months), and old age animals were 18–26 months of age (mean=21.4). Age groups were chosen based on changes in sexual maturity and consideration of mortality rates. Puberty begins around 35 days of age, with sexual maturity reached by 2 months, so that 4 months is considered young adulthood. Twelve months is considered middle-age because females begin to show irregular estrous cycles and reduced fertility by this time. Rats are generally considered aged by 18 months of age (discussed by Coleman, 2004). At this time females no longer show estrous cycles and are in estropause, there is also an increase in tumor incidence, and deficits in cognitive behavior have been noted (reviewed by Rosenzweig & Barnes, 2003).
Tissue was collected from both the splenium and genu in a largely overlapping group of subjects. All procedures were approved by the IACUC at the University of Illinois. In the genu, tissue was used from adult animals (7 females, 6 males), middle-age animals (11 females, 7 males), and old animals (9 females, 7 males). In the splenium, tissue was available from animals in adulthood (7 females, 7 males), middle-age (8 females, 8 males) and old age (10 females, 8 males). Middle and old age animals had served as breeders until being retired at 10–12 months of age. Animals were double or triple housed with same sex cagemates with the exception of breeding and lactation periods. Both adult animals and retired breeders were handled weekly. Prior to sacrifice, females underwent daily vaginal lavage in order to determine their estrous or estropausal status (as described in Markham & Juraska, 2002). Unlike menopausal women, estropausal rats continue to secrete moderate levels of ovarian hormones in one of two estropausal states (Dudley, 1982; Markham & Juraska, 2002). The middle and old age females had to remain in their estropausal state for 10 days to determine their classification. Males received daily handling during this time to control for the difference in treatment.
Animals were deeply anesthetized with sodium pentobarbital and perfused intracardially with Ringer’s solution followed by 1% gluteraldehyde/4% paraformaldehyde. Brains were removed and placed in the 1% gluteraldehyde/4% paraformaldehyde fixative overnight. The day after perfusions, brains were weighed and blocks containing the anterior and posterior 1/3 of the corpus callosum were taken from the right hemisphere and stained with 2% osmium tetroxide. The tissue was then dehydrated in increasing concentrations of acetone before being embedded in Eponate 12 resin (Ted Pella, Redding, CA). One week after perfusions, a photo was taken of the midsagital surface of the left hemisphere along with a calibration ruler to be used for determining the length and boundaries of the genu and splenium. The splenium was defined as the posterior 20% of the total corpus callosum length, which was established as the boundary between axons from the visual and parietal cortices in rats (Kim et al, 1996; Kim and Juraska, 1997). The genu was defined as the anterior 15%, as others have done (Mack et al., 1995). Fiber tracking indicates that axons from frontal regions cross through the genu (Xue et al., 1999).
Embedded tissue blocks were trimmed and 1–2 micron thick sections were taken using an ultramicrotome. Sections were mounted and stained with Toluidine blue before being coverslipped. An outline of the subregion (genu or splenium) contained in each section was traced under a camera lucida at a magnification of 40X. The drawings were scanned into the computer and ImageJ software (Version 1.28, 2002) was used to quantify area.
Axonal composition was quantified using a stereological point counting technique (Weibel, 1979). This involved categorizing the composition of tissue under oil immersion at 1000X while simultaneously viewing a grid with a fixed number of intersections through a camera lucida. The composition at each intersection was classified into one of four categories: myelinated axons, glial cell bodies, blood vessels and other material (glial processes and unmyelinated axons, which are not resolvable using the light microscope). Using a counting grid with 110 intersections, samples were taken throughout the entire extent of each subregion. For the genu, 10 sampling sites were used for a total of 1100 points while for the splenium 12 sites were used for 1320 total points due to its larger size. The proportion of points for each category, the area fraction, was calculated and then multiplied by the area of the subregion to get the area occupied by each type of material.
Acknowledgments
We would like to thank Dana Bowles for her assistance in data collection. This work was supported by NIA grants AG 18046 and AG 022499.
Footnotes
Publisher's Disclaimer: This is a PDF file of an unedited manuscript that has been accepted for publication. As a service to our customers we are providing this early version of the manuscript. The manuscript will undergo copyediting, typesetting, and review of the resulting proof before it is published in its final citable form. Please note that during the production process errors may be discovered which could affect the content, and all legal disclaimers that apply to the journal pertain.
References
- Abe O, Aoki S, Hayashi N, Yamada H, Kunimatsu A, Mori H, Yoshikawa T, Okubo T, Ohtomo K. Normal aging in the central nervous system: Quantitative MR diffusion-tensor analysis. Neurobiol Aging. 2002;23:433–441. doi: 10.1016/s0197-4580(01)00318-9. [DOI] [PubMed] [Google Scholar]
- Allen JS, Bruss J, Brown CK, Damasio H. Normal neuroanatomical variation due to age: The major lobes and a parcellation of the temporal region. Neurobiol Aging. 2005;26:1245–60; discussion 1279–82. doi: 10.1016/j.neurobiolaging.2005.05.023. [DOI] [PubMed] [Google Scholar]
- Barense MD, Fox MT, Baxter MG. Aged rats are impaired on an attentional set-shifting task sensitive to medial frontal cortex damage in young rats. Learn Mem. 2002;9:191–201. doi: 10.1101/lm.48602. [DOI] [PMC free article] [PubMed] [Google Scholar]
- Bartzokis G, Beckson M, Lu PH, Nuechterlein KH, Edwards N, Mintz J. Age-related changes in frontal and temporal lobe volumes in men: A magnetic resonance imaging study. Arch Gen Psychiatry. 2001;58:461–465. doi: 10.1001/archpsyc.58.5.461. [DOI] [PubMed] [Google Scholar]
- Berrebi AS, Fitch RH, Ralphe DL, Denenberg JO, Friedrich VL, Jr, Denenberg VH. Corpus callosum: Region-specific effects of sex, early experience and age. Brain Res. 1988;438:216–224. doi: 10.1016/0006-8993(88)91340-6. [DOI] [PubMed] [Google Scholar]
- Bimonte HA, Fitch RH, Denenberg VH. Neonatal estrogen blockade prevents normal callosal responsiveness to estradiol in adulthood. Brain Res Dev Brain Res. 2000;122:149–155. doi: 10.1016/s0165-3806(00)00067-5. [DOI] [PubMed] [Google Scholar]
- Bimonte HA, Mack CM, Stavnezer AJ, Denenberg VH. Ovarian hormones can organize the rat corpus callosum in adulthood. Brain Res Dev Brain Res. 2000;121:169–177. doi: 10.1016/s0165-3806(00)00043-2. [DOI] [PubMed] [Google Scholar]
- Bjorklund H, Eriksdotter-Nilsson M, Dahl D, Rose G, Hoffer B, Olson L. Image analysis of GFA-positive astrocytes from adolescence to senescence. Exp Brain Res. 1985;58:163–170. doi: 10.1007/BF00238964. [DOI] [PubMed] [Google Scholar]
- Brunson KL, Kramar E, Lin B, Chen Y, Colgin LL, Yanagihara TK, Lynch G, Baram TZ. Mechanisms of late-onset cognitive decline after early-life stress. J Neurosci. 2005;25:9328–9338. doi: 10.1523/JNEUROSCI.2281-05.2005. [DOI] [PMC free article] [PubMed] [Google Scholar]
- Cerghet M, Skoff RP, Bessert D, Zhang Z, Mullins C, Ghandour MS. Proliferation and death of oligodendrocytes and myelin proteins are differentially regulated in male and female rodents. J Neurosci. 2006;26:1439–1447. doi: 10.1523/JNEUROSCI.2219-05.2006. [DOI] [PMC free article] [PubMed] [Google Scholar]
- Coleman PD. How old is old? Neurobiol Aging. 2004;25:1. doi: 10.1016/j.neurobiolaging.2003.10.002. [DOI] [PubMed] [Google Scholar]
- Courchesne E, Chisum HJ, Townsend J, Cowles A, Covington J, Egaas B, Harwood M, Hinds S, Press GA. Normal brain development and aging: Quantitative analysis at in vivo MR imaging in healthy volunteers. Radiology. 2000;216:672–682. doi: 10.1148/radiology.216.3.r00au37672. [DOI] [PubMed] [Google Scholar]
- Cowell PE, Allen LS, Zalatimo NS, Denenberg VH. A developmental study of sex and age interactions in the human corpus callosum. Dev Brain Res. 1992;66:187–192. doi: 10.1016/0165-3806(92)90079-c. [DOI] [PubMed] [Google Scholar]
- Dudley SD. Responsiveness to estradiol in central nervous system of aging female rats. Neurosci Biobehav Rev. 1982;6:39–45. doi: 10.1016/0149-7634(82)90005-7. [DOI] [PubMed] [Google Scholar]
- Fitch RH, Cowell PE, Schrott LM, Denenberg VH. Corpus callosum: Demasculinization via perinatal anti-androgen. Int J Dev Neurosci. 1991;9:35–38. doi: 10.1016/0736-5748(91)90070-3. [DOI] [PubMed] [Google Scholar]
- Fotenos AF, Snyder AZ, Girton LE, Morris JC, Buckner RL. Normative estimates of cross-sectional and longitudinal brain volume decline in aging and AD. Neurology. 2005;64:1032–1039. doi: 10.1212/01.WNL.0000154530.72969.11. [DOI] [PubMed] [Google Scholar]
- Godbout JP, Johnson RW. Age and neuroinflammation: A lifetime of psychoneuroimmune consequences. Neurol Clin. 2006;24:521–538. doi: 10.1016/j.ncl.2006.03.010. [DOI] [PubMed] [Google Scholar]
- Jernigan TL, Archibald SL, Fennema-Notestine C, Gamst AC, Stout JC, Bonner J, Hesselink JR. Effects of age on tissues and regions of the cerebrum and cerebellum. Neurobiol Aging. 2001;22:581–594. doi: 10.1016/s0197-4580(01)00217-2. [DOI] [PubMed] [Google Scholar]
- Kim JH, Ellman A, Juraska JM. A re-examination of sex differences in axon density and number in the splenium of the rat corpus callosum. Brain Res. 1996;740:47–56. doi: 10.1016/s0006-8993(96)00637-3. [DOI] [PubMed] [Google Scholar]
- Kim JH, Juraska JM. Sex differences in the development of axon number in the splenium of the rat corpus callosum from postnatal day 15 through 60. Brain Res Dev Brain Res. 1997;102:77–85. doi: 10.1016/s0165-3806(97)00080-1. [DOI] [PubMed] [Google Scholar]
- Li WW, Penderis J, Zhao C, Schumacher M, Franklin RJ. Females remyelinate more efficiently than males following demyelination in the aged but not young adult CNS. Exp Neurol. 2006;202:250–254. doi: 10.1016/j.expneurol.2006.05.012. [DOI] [PubMed] [Google Scholar]
- Looney GA, Elberger AJ. Myelination of the corpus callosum in the cat: Time course, topography, and functional implications. J Comp Neurol. 1986;248:336–347. doi: 10.1002/cne.902480304. [DOI] [PubMed] [Google Scholar]
- Lupien SJ, de Leon M, de Santi S, Convit A, Tarshish C, Nair NP, Thakur M, McEwen BS, Hauger RL, Meaney MJ. Cortisol levels during human aging predict hippocampal atrophy and memory deficits. Nat Neurosci. 1998;1:69–73. doi: 10.1038/271. [DOI] [PubMed] [Google Scholar]
- Mack CM, Boehm GW, Berrebi AS, Denenberg VH. Sex differences in the distribution of axon types within the genu of the rat corpus callosum. Brain Res. 1995;697:152–160. doi: 10.1016/0006-8993(95)00804-y. [DOI] [PubMed] [Google Scholar]
- Markham JA, McKian KP, Stroup TS, Juraska JM. Sexually dimorphic aging of dendritic morphology in CA1 of hippocampus. Hippocampus. 2005;15:97–103. doi: 10.1002/hipo.20034. [DOI] [PubMed] [Google Scholar]
- Markham JA, Juraska JM. Aging and sex influence the anatomy of the rat anterior cingulate cortex. Neurobiol Aging. 2002;23:579–588. doi: 10.1016/s0197-4580(02)00004-0. [DOI] [PubMed] [Google Scholar]
- Montaron MF, Drapeau E, Dupret D, Kitchener P, Aurousseau C, Le Moal M, Piazza PV, Abrous DN. Lifelong corticosterone level determines age-related decline in neurogenesis and memory. Neurobiol Aging. 2006;27:645–654. doi: 10.1016/j.neurobiolaging.2005.02.014. [DOI] [PubMed] [Google Scholar]
- Nunez JL, Nelson J, Pych JC, Kim JH, Juraska JM. Myelination in the splenium of the corpus callosum in adult male and female rats. Brain Res Dev Brain Res. 2000;120:87–90. doi: 10.1016/s0165-3806(99)00193-5. [DOI] [PubMed] [Google Scholar]
- Nunez JL, Juraska JM. The size of the splenium of the rat corpus callosum: Influence of hormones, sex ratio, and neonatal cryoanesthesia. Dev Psychobiol. 1998;33:295–303. doi: 10.1002/(sici)1098-2302(199812)33:4<295::aid-dev1>3.0.co;2-l. [DOI] [PubMed] [Google Scholar]
- O’Sullivan M, Jones DK, Summers PE, Morris RG, Williams SC, Markus HS. Evidence for cortical “disconnection” as a mechanism of age-related cognitive decline. Neurology. 2001;57:632–638. doi: 10.1212/wnl.57.4.632. [DOI] [PubMed] [Google Scholar]
- Ota M, Obata T, Akine Y, Ito H, Ikehira H, Asada T, Suhara T. Age-related degeneration of corpus callosum measured with diffusion tensor imaging. Neuroimage. 2006;31:1445–1452. doi: 10.1016/j.neuroimage.2006.02.008. [DOI] [PubMed] [Google Scholar]
- Peinado MA, Quesada A, Pedrosa JA, Torres MI, Martinez M, Esteban FJ, Del Moral ML, Hernandez R, Rodrigo J, Peinado JM. Quantitative and ultrastructural changes in glia and pericytes in the parietal cortex of the aging rat. Microsc Res Tech. 1998;43:34–42. doi: 10.1002/(SICI)1097-0029(19981001)43:1<34::AID-JEMT6>3.0.CO;2-G. [DOI] [PubMed] [Google Scholar]
- Raz N, Gunning FM, Head D, Dupuis JH, McQuain J, Briggs SD, Loken WJ, Thornton AE, Acker JD. Selective aging of the human cerebral cortex observed in vivo: Differential vulnerability of the prefrontal gray matter. Cereb Cortex. 1997;7:268–282. doi: 10.1093/cercor/7.3.268. [DOI] [PubMed] [Google Scholar]
- Resnick SM, Pham DL, Kraut MA, Zonderman AB, Davatzikos C. Longitudinal magnetic resonance imaging studies of older adults: A shrinking brain. J Neurosci. 2003;23:3295–3301. doi: 10.1523/JNEUROSCI.23-08-03295.2003. [DOI] [PMC free article] [PubMed] [Google Scholar]
- Rosenzweig ES, Barnes CA. Impact of aging on hippocampal function: Plasticity, network dynamics, and cognition. Prog Neurobiol. 2003;69:143–179. doi: 10.1016/s0301-0082(02)00126-0. [DOI] [PubMed] [Google Scholar]
- Ryberg C, Rostrup E, Stegmann MB, Barkhof F, Scheltens P, van Straaten EC, Fazekas F, Schmidt R, Ferro JM, Baezner H, Erkinjuntti T, Jokinen H, Wahlund LO, O’brien J, Basile AM, Pantoni L, Inzitari D, Waldemar G on behalf of the LADIS study group. Clinical significance of corpus callosum atrophy in a mixed elderly population. Neurobiol Aging. 2006 doi: 10.1016/j.neurobiolaging.2006.04.008. in press [Epub] [DOI] [PubMed] [Google Scholar]
- Salat DH, Tuch DS, Greve DN, van der Kouwe AJ, Hevelone ND, Zaleta AK, Rosen BR, Fischl B, Corkin S, Rosas HD, Dale AM. Age-related alterations in white matter microstructure measured by diffusion tensor imaging. Neurobiol Aging. 2005;26:1215–1227. doi: 10.1016/j.neurobiolaging.2004.09.017. [DOI] [PubMed] [Google Scholar]
- Sandi C, Touyarot K. Mid-life stress and cognitive deficits during early aging in rats: Individual differences and hippocampal correlates. Neurobiol Aging. 2006;27:128–140. doi: 10.1016/j.neurobiolaging.2005.01.006. [DOI] [PubMed] [Google Scholar]
- Shields SA, Gilson JM, Blakemore WF, Franklin RJ. Remyelination occurs as extensively but more slowly in old rats compared to young rats following gliotoxin-induced CNS demyelination. Glia. 1999;28:77–83. doi: 10.1002/(sici)1098-1136(199910)28:1<77::aid-glia9>3.0.co;2-f. [DOI] [PubMed] [Google Scholar]
- Sim FJ, Zhao C, Penderis J, Franklin RJ. The age-related decrease in CNS remyelination efficiency is attributable to an impairment of both oligodendrocyte progenitor recruitment and differentiation. J Neurosci. 2002;22:2451–2459. doi: 10.1523/JNEUROSCI.22-07-02451.2002. [DOI] [PMC free article] [PubMed] [Google Scholar]
- Sowell ER, Peterson BS, Thompson PM, Welcome SE, Henkenius AL, Toga AW. Mapping cortical change across the human life span. Nat Neurosci. 2003;6:309–315. doi: 10.1038/nn1008. [DOI] [PubMed] [Google Scholar]
- Steen RG, Ogg RJ, Reddick WE, Kingsley PB. Age-related changes in the pediatric brain: Quantitative MR evidence of maturational changes during adolescence. Am J Neuroradiol. 1997;18:819–828. [PMC free article] [PubMed] [Google Scholar]
- Sturrock RR. Myelination of the mouse corpus callosum. Neuropathol Appl Neurobiol. 1980;6:415–420. doi: 10.1111/j.1365-2990.1980.tb00219.x. [DOI] [PubMed] [Google Scholar]
- Sugiyama I, Tanaka K, Akita M, Yoshida K, Kawase T, Asou H. Ultrastructural analysis of the paranodal junction of myelinated fibers in 31-month-old-rats. J Neurosci Res. 2002;70:309–317. doi: 10.1002/jnr.10386. [DOI] [PubMed] [Google Scholar]
- Sullivan EV, Adalsteinsson E, Pfefferbaum A. Selective age-related degradation of anterior callosal fiber bundles quantified in vivo with fiber tracking. Cereb Cortex. 2006;16:1030–1039. doi: 10.1093/cercor/bhj045. [DOI] [PubMed] [Google Scholar]
- Sullivan EV, Adalsteinsson E, Sood R, Mayer D, Bell R, McBride W, Li TK, Pfefferbaum A. Longitudinal brain magnetic resonance imaging study of the alcohol-preferring rat. part I: Adult brain growth. Alcohol Clin Exp Res. 2006;30:1234–1247. doi: 10.1111/j.1530-0277.2006.00145.x. [DOI] [PubMed] [Google Scholar]
- Sullivan EV, Pfefferbaum A, Adalsteinsson E, Swan GE, Carmelli D. Differential rates of regional brain change in callosal and ventricular size: A 4-year longitudinal MRI study of elderly men. Cereb Cortex. 2002;12:438–445. doi: 10.1093/cercor/12.4.438. [DOI] [PubMed] [Google Scholar]
- Sullivan EV, Adalsteinsson E, Hedehus M, Ju C, Moseley M, Lim KO, Pfefferbaum A. Equivalent disruption of regional white matter microstructure in ageing healthy men and women. Neuroreport. 2001;12:99–104. doi: 10.1097/00001756-200101220-00027. [DOI] [PubMed] [Google Scholar]
- Walhovd KB, Fjell AM, Reinvang I, Lundervold A, Dale AM, Eilertsen DE, Quinn BT, Salat D, Makris N, Fischl B. Effects of age on volumes of cortex, white matter and subcortical structures. Neurobiol Aging. 2005;26:1261–70; discussion 1275–8. doi: 10.1016/j.neurobiolaging.2005.05.020. [DOI] [PubMed] [Google Scholar]
- Weibel ER. Stereological Methods for Biological Morphometry. Vol. 1. Academic Press; London: 1979. [Google Scholar]
- Xue R, van Zijl PCM, Crain BJ, Solaiyappan M, Mori S. In vivo three-dimensional reconstruction of rat brain axonal projections by diffusion tensor imaging. Magn Reson Med. 1999;42:1123–1127. doi: 10.1002/(sici)1522-2594(199912)42:6<1123::aid-mrm17>3.0.co;2-h. [DOI] [PubMed] [Google Scholar]