

Abstract
The ε subunit of Escherichia coli DNA polymerase III possesses 3′-exonucleolytic proofreading activity. Within the Pol III core, ε is tightly bound between the α subunit (DNA polymerase) and θ subunit. Here, we present the crystal structure of ε in complex with HOT, the bacteriophage P1-encoded homolog of θ, at 2.1 Å resolution. The ε-HOT interface is defined by two areas of contact: an interaction of the previously unstructured N terminus of HOT with an edge of the ε central β-sheet as well as interactions between HOT and the catalytically important helix α1-loop-helix α2 motif of ε. This structure provides insight into how HOT and, by implication, θ may stabilize the ε subunit, thus promoting efficient proofreading during chromosomal replication.
The precise mechanisms by which cells are able to duplicate their DNA with both high accuracy (<1 error/1010 bases replicated) and speed (up to 1000 nucleotides/s) are of major interest. Chromosomal replication is performed by multisubunit replicases that conduct the simultaneous, coordinated replication of the leading and lagging strands. Among the model systems currently being investigated, the best understood is that of the bacterium Escherichia coli (1, 2). In this organism, chromosomal replication is performed by DNA polymerase III holoenzyme (HE)2, a dimeric complex containing 10 distinct subunits (17 total). Within the HE complex (αεθ)2β4τ2(γδδ′χψ), there are two polymerase core assemblies ((αεθ), one for each strand, which are the primary determinants of replication fidelity. Each core consists of the αsubunit (the polymerase, (Mr = 135,000)), the ε subunit (a 3′ → 5′ exonuclease that acts as a proofreader for polymerase misinsertion errors, (Mr = 28,500)), and the θ subunit (Mr = 8,000), connected in the linear order α- ε-θ.
The ε subunit, encoded by the dnaQ gene, plays a critical role within the Pol III core, both catalytically and structurally. Many dnaQ mutants exhibit strong mutator phenotypes, whereas a fully catalytically deficient mutation causes lethality due to excessively high mutation rates (error catastrophe) (3). Deletion mutants of dnaQ have been generated, but they also proved to be nonviable unless accompanied by a suppressing mutation in the polymerase (4). Based on these studies, ε is thought to have at least two functions: a fidelity function and a structural function, due to its tight and presumably stabilizing interaction with the polymerase. Recently, a potential second proofreading activity has been discovered residing in the N-terminal PHP domain of the α subunit (5, 6), which also contains the binding site for ε. Interaction between ε and α is dependent on the C-terminal domain of ε (residues 187–243) (7, 8). In contrast, the N-terminal domain of ε (residues 1–186) contains the exonuclease active site and retains binding affinity for the θ subunit.
The θ subunit does not have any known enzymatic function; its role within the Pol III core is presumed to be structural, through its interaction with the ε subunit. Strains lacking θ (ΔholE mutants), although viable, are modest mutators (9), suggesting that θ plays a role in the fidelity of the Pol III core. E. coli strains carrying certain mutant ε subunits (dnaQ mutants) demonstrate a dramatic sensitivity to the presence of the θ subunit. An increase of 1000-fold in the mutability of a dnaQ49 (V96G) strain was observed in the absence of θ (9). The θ subunit also stimulates the exonuclease activity of the ε double mutant I170T/V215A when present in the Pol III core complex (10). This observation supports a role for θ in coordinating the α-ε polymerase-exonuclease interaction (10).
Structural information is critical to understanding the mechanism by which θ modulates exonuclease activity of the Pol III core. Both NMR (11) and crystallographic (12) structures of ε186 (residues 1–186), the catalytic domain of ε that binds θ, have been obtained previously, as has the NMR solution structure of θ (13, 14). As part of these ongoing studies, we have also investigated the bacteriophage P1 HOT protein, a functional homolog of θ (15, 16). The precise role of HOT is unclear, but it may assist in phage replication, which relies on the E. coli replication machinery (15). Genetic experiments show that HOT protein can readily substitute for θ. For example, HOT can fully reduce the extreme mutability of the dnaQ49 mutant (16). As the NMR solution structures of θ and HOT are essentially identical (13, 17), and as the HOT protein has shown greater stability in vitro than θ, we have chosen to study the HOT-ε186 complex.
Based on the crystal structure presented here, HOT does not contribute residues to the active site of ε but rather appears to stabilize the enzyme through interactions clustered around two regions. In particular, the N terminus of HOT becomes ordered upon binding ε186, forming interactions with backbone atoms of an exposed β-strand of the central β-sheet. The structure of this inter-species complex provides insight into the basis for the accurate replication of the bacteriophage genome in E. coli and also serves as a model for the ε-θ complex in the native Pol III holoenzyme.
EXPERIMENTAL PROCEDURES
HOT and ε186 were expressed and purified as previously described (7, 17). The complex of ε186 and HOT was prepared by mixing 2 volumes of a 3.8 mg/ml solution of ε186 with 1 volume of 3 M Tris·HCl, pH 7.0, and then adding 0.028 volumes of 62 mg/ml HOT, yielding a ratio of HOT: ε186 of 1.03:1. As noted previously, ε186 is stabilized in the presence of high Tris concentrations (11).
The mixture was concentrated to ~30 mg/ml using a Centriprep YM-3 filter unit (Millipore), and the HOT-ε186 complex was separated from the excess HOT by gel filtration chromatography using a 2.6 × 60-cm Superdex 75 column (Amersham Biosciences) that was eluted at 0.4 ml/min with 25 mM Tris·HCl buffer at pH 7.5, containing 100 mM NaCl. Fractions containing the complex were concentrated to 24 mg/ml using a Centriprep YM-3 filter unit. Protein concentrations were determined spectrophotometrically using extinction coefficients at 280 nm of 11544 M−1 cm−1 for HOT, 7292 M−1 cm−1 for ε186, and 18836 M−1 cm−1 for the ε186-HOT complex.
Crystals of the ε186-HOT complex were obtained at 4 °C by mixing, in a sitting drop tray, 1 μl of a 24 mg/ml complex in 25 mM Tris, pH 7.5, 100 mM NaCl, 5 mM MnSO4, and 5 mM TMP with 1 μl of the reservoir solution consisting of 0.1 M Tris·HCl, pH 8.0, and 22% polyethylene glycol 6000. Diffraction quality crystals were obtained by streak seeding. After 10 days, crystals reached their maximum size of ~0.2 × 0.2 × 0.2 mm. Crystals were harvested and transferred to a stabilization solution consisting of 0.1 M Tris, pH 7.5, 23% polyethylene glycol 6000, 100mM NaCl, 5 mM MnSO4, and 5 mM TMP. Crystals were thentransferred in four steps from the stabilization solution to the cryosolution consisting of 0.1 M Tris, pH 7.5, 25% polyethylene glycol 6000, 15% ethylene glycol, 200 mM NaCl, 5 mM MnSO4, and 5 mM TMP. Crystals were mounted in a loop, flash frozen in liquid nitrogen, and placed on the goniometer in a stream of nitrogen gas cooled to 93 K. Data were collected using a Rigaku 007HF Micromax generator equipped with VariMax HF mirrors and a Saturn 92 CCD detector. Diffraction data were collected at 2.1 Å resolution and processed using HKL2000 (18). To obtain phases, the ε186 model (Protein Data Bank accession code 1J53) was used for the molecular replacement using Mol-Rep (19) in the CCP4i package (20). Two molecules of ε186 were found in the asymmetric unit. The two main helices of HOT from the Protein Data Bank coordinates 1SE7 were placed separately into the electron density manually using the program O (21). This model was refined in CNS (22). The rest of the HOT molecule was built to the electron density through iterative cycles of model building in O and refinement in CNS. The final model consists of two complexes, each containing one molecule of ε186, one molecule of HOT, one TMP molecule, and two Mn2+ ions. Residues present in complex 1 are: molecule A (ε186) 6–159, 161–180 and molecule B (HOT) 2–76. Residues present in complex 2 are: molecule C (ε186) 6–180 and molecule D (HOT) 1–76. The final structure has been deposited in the Protein Data Bank with accession number 2IDO.
Structural alignments and r.m.s. deviations were done using Pymol (23). Figures were made using Pymol (23) or using Molscript (24) and Raster3D (25).
RESULTS AND DISCUSSION
To better understand the role of θ in stabilizing the ε proofreading subunit, we have determined the crystal structure of the ε186-HOT complex in the presence of TMP, a product and competitive inhibitor of the exonuclease, and MnSO4 (Table 1). These crystals contain two ε186-HOT dimers in the asymmetric unit and diffract to a resolution of 2.1 Å. Each individual complex contains one molecule of ε186 and one molecule of HOT, in addition to one TMP molecule and two Mn2+ ions in the ε exonuclease active site. In the complex, ε186 adopts the familiar α/β structure of proofreading domains with the five-stranded twisted β-sheet surrounded by seven α-helices (Fig. 1A) (12). HOT in the complex is characterized by a three-helix bundle, as in solution (17), with an extensive hydrophobic core defined by residues on the three α-helices (Fig. 1A). The two ε186-HOT complexes in the unit cell are very similar; the 156 α-carbon atoms of the two ε186 molecules (listed as molecules A and C) superimpose with a r.m.s.d. of 0.4 Å, and 73 α-carbons of the two HOT molecules (listed as molecules B and D) superimpose with a r.m.s.d. of 0.4 Å as well. However, one area of discrepancy arises for the ε186 loop immediately preceding α7ε, a region of considerable interest because it includes the catalytically important H162ε residue (12). In one molecule (molecule C), this loop is located away from the ε active site as residues Lys158-Leu161 form lattice contacts with residues Glu153-Asp155 from the other ε186 molecule (molecule A). Residues Lys158-Thr160 of molecule A are mostly disordered. This is demonstrated in Fig. 2, which shows the superposition of the crystal structures of the two molecules of ε186 in the asymmetric unit of the ε186-HOT complex (Fig. 2A).
TABLE 1.
| Crystallographic data statistics | |
|---|---|
| Data set | ε/HOT complex |
| Unit cell | a = b = 77.29 c = 212.99 α = β γ = 90° |
| Space group | P4(3)2(1)2 |
| Resolution (Å) | 50-2.1 |
| No. of observations | 409,290 |
| Unique reflections | 37,506 |
| Rsym (%) (last shell)a | 8.1 (32.8) |
| I/σI (last shell) | 17.5 (2.2) |
| Mosaicity | 0.56 |
| Completeness (%) (last shell) | 97.3 (76.6) |
|
Refinement statistics
Rcryst (%)b Rfree (%)c No. of waters Mean B value (Å) |
20.6 24.5 429 31.9 |
|
R.m.s. deviation from ideal values
Bond length (Å) Bond angle (°) Dihedral angle (°) Improper angle (°) |
0.005 1.2 21.1 0.68 |
|
Ramachandran statisticsd
Residues in: Favored (98%) regions (%) Allowed (>99.8%) regions (%) |
97.95 100 |
Rsym = ∑ (|Ii − 〈I〉)/∑(Ii) where Ii is the intensity of the ith observation and 〈I〉 is the mean intensity of the reflection.
Rcryst = ∑||Fo| − |Fc||/∑|Fo|calculated from working data set.
Rfree was calculated from 5% of data randomly chosen not to be included in refinement.
Ramachandran results were determined by MolProbity (33).
FIGURE 1. Structures of the ε186-HOT complex.

A, stereo view of the ε186-HOT complex corresponding to molecules A (ε186) and B (HOT). B and C, detailed view of two areas of specific ε-HOT interaction. Residues of ε186 are indicated in blue; residues of HOT are in orange. B, interactions of N-terminal HOT residues with ε186 residues of strand β3 at the edge of the central β-sheet. C, interactions of the HOT helix α1 and C-terminal residues with the ε186 α1-loop-α2 region. Hydrogen bond interactions are indicated by a yellow dotted line.
FIGURE 2. Variation in ε186 crystallographic structures.

A, superposition of the crystal structures of the two molecules of ε186 in the asymmetric unit of the ε186-HOT complex, molecule A (blue) and molecule C (red). B, superposition of the previously determined ε186 (green) (Protein Data Bank code 1J54) with ε186 molecule C (red) of the ε186-HOT complex.
Intersubunit contacts occur in two separate areas of the complex, as shown in some detail in Fig. 1, B and C. First, a series of N-terminal HOT residues interact with ε186 strand β3 at the edge of the central β-sheet (Fig. 1B). These interactions include (i) hydrogen bonds from the backbone amides of W4HOT and N5HOT to the carboxylate group of E85ε; (ii) a pair of hydrogen bonds connecting the N5HOT amide side chain with the N47ε carbonyl oxygen and the H49ε backbone amide; (iii) the hydrogen bond from the backbone amide of I6HOT to the backbone carbonyl of H49ε and (iv) a hydrophobic interaction of W4HOT with P77ε. There are also extensive water-mediated interactions between HOT residues of the C-terminal portion of helix α1, as well as the surrounding residues, with residues from the helix α1-loop-helix α2 region of ε186 (Fig. 1C). Additionally, there are hydrogen bonds between the R31HOT, D70ε, and E71ε, side chains, and a stacking interaction of Y28HOT with F63ε. This latter interaction is facilitated by the insertion of the F63ε phenyl ring into a “notch” (26) in HOT helix α1 created by the lack of a side chain at G25HOT. Fig. 3 illustrates this stacking interaction with a stereo view of electron density in the region.
FIGURE 3. Stereo view of the electron density at the complex interface.
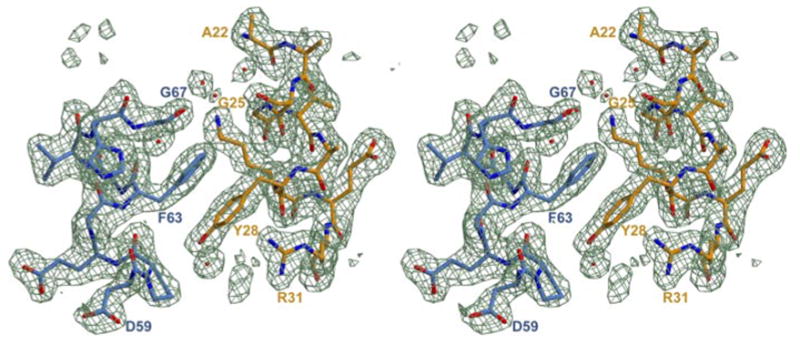
Residue F63ε is seen in a ring-stacking arrangement with Y28HOT and occupies a “notch” in helix α1 of HOT left by the lack of a side chain from G25HOT. ε is shown in blue, and HOT is shown in orange. Electron density map shown is a simulated annealing Fo − Fc omit map contoured at 3 σ.
The overall structure of ε186 in the complex is very similar to the previously determined structure of the TMP-complexed proofreading catalytic domain (12) obtained in the absence of θ or HOT as shown in Fig. 2B. The α-carbon atoms of ε186 molecule C superimpose with the reported structures (Protein Data Bank codes 1J53, 1J54) with a r.m.s.d. of 0.4 Å for 162 atoms and 0.4 Å for 161 atoms, respectively. In ε186 molecule A from the ε186-HOT complex, the proposed general base His162 and other atoms in the active site superimpose well with the ε186 structures in complex with TMP only. While one ε186 molecule (molecule A) in our structure appears to be in a catalytically relevant structure based on the position of His162, the other (molecule C) does not. Although the conformation of the loop in molecule C is stabilized by lattice contacts and a possible hydrogen bond to N18HOT, the inherent flexibility of this loop may be related to DNA substrate binding or regulation of catalysis.
The central core three-helical bundle in HOT (residues 11–62) is structurally similar to that of the solution NMR structure (r.m.s.d. = 3.2 Å over 52 α-carbon atoms; Fig. 4A). The two HOT structures superpose fairly well along the two long α-helices (α1 and α3) but not in the N- and C-terminal regions and in the area of helix α2 (Asn33 to Gln45) and the loop preceding α2. Importantly, a novel additional helical structure is seen at the N terminus of HOT in the complex that was not observed in solution (17). The extensive contacts in this region between HOT and ε186 indicate that this structure is probably strongly stabilized, if not induced, by the interaction between the two proteins (Fig. 1, B and C; Table 2). The published NMR structure of uncomplexed θ (13) was also aligned with the HOT crystal structure (Fig. 4B), and again the termini deviate somewhat but the region of α2 aligns considerably better than that of HOT (r.m.s.d. of 1.3 Å for 49 α-carbon atoms in the region of residues 11–62 of HOT). Interestingly, reevaluation of the solution structure of HOT using the original nuclear Overhauser effect data and the program CYANA, version 2.1 (27, 28), resulted in significantly better agreement with the crystal structure and suggests a dimeric structure for HOT at the concentration used in the NMR study.
FIGURE 4. Comparison of NMR solution structures of HOT and θ to crystal structure of HOT in complex with ε186.

A, superposition of NMR solution structure of HOT (green) with HOT (orange) complexed with ε186 (blue). B, superposition of NMR solution structure of θ (magenta) with HOT (orange) complexed with ε 186 (blue).
TABLE 2. The ε186-HOT interface, H-bonded atoms within 3.4 Å.
The secondary structure element α0 refers to the three-residue helix involving residues 6–8, which appears to form upon binding to ε186. The complex containing molecules A (ε186) and B (HOT) was used for this table.
| ε186
|
HOT
|
|||||
|---|---|---|---|---|---|---|
| Residue | Atom | Secondary | Residue | Atom | Secondary | Distance |
| Å | ||||||
| Asn47 | O | β3 | Asn5 | ND2 | 2.82 | |
| His49 | N | β3 | Asn5 | OD1 | 2.97 | |
| His49 | O | β3 | Ile6 | N | α0 | 2.71 |
| Asp70 | OD2 | α2 | Arg31 | NH2 | α1 | 2.89 |
| Glu71 | OE2 | α2 | Arg31 | NE | α1 | 2.78 |
| Glu71 | OE2 | α2 | Ser64 | OG | α3 | 2.82 |
| Phe72 | CB | α2 | Ser24 | OG | α1 | 3.25 |
| Glu85 | OE1 | α3 | Trp4 | N | 2.76 | |
| Glu85 | OE2 | α3 | Asn5 | N | 3.01 | |
A recent NMR structure of θ in complex with ε186 was determined by labeling θ and not ε186. This work predicted the relative orientation and position of θ with respect to ε186 based on the observations of shift perturbations resulting from lanthanide ions bound to the active site of ε186 (14). Because of the nature of the NMR experiment, however, the structure lacked data on the ε residues of the ε186-θ interface as well as detailed structural information for the C-terminal and N-terminal residues, which in the ε186-HOT complex appear to be critical for stable dimer formation. The published NMR structure of θ in complex with ε186 (14) was aligned with the HOT crystal structure from the ε186-HOT complex (Fig. 5B), resulting in a r.m.s.d. of 1.7 Å for 48 α-carbon atoms of HOT (residues 11–62). Information as to how θ interacts with ε can be gained from the crystal structure of the ε186-HOT complex presented here. HOT and θ share 52% sequence identity and 61% similarity (Fig. 5A). Sequence alignments reveal that all the potential hydrogen bonding interactions between HOT and ε186 listed in Table 2 are likely to be conserved in the ε-θ complex with the exception of that formed by S64HOT. In particular, structural and sequence alignment of N5HOT with N4θ (Fig. 5A) allows preservation of the set of hydrogen bonding interactions shown in Fig. 1B. Additionally, hydrophobic interactions in the complex are also likely to be conserved, such as Y28HOT (F27θ) stacking with F63ε as well as the aliphatic side chain of K3θ substituting for the hydrophobic interaction of W4HOT with P77ε. The similarities in these important areas suggest that the ε186-HOT complex is a good model for the ε-θ complex.
FIGURE 5. Sequence and structural comparisons of θ with HOT.
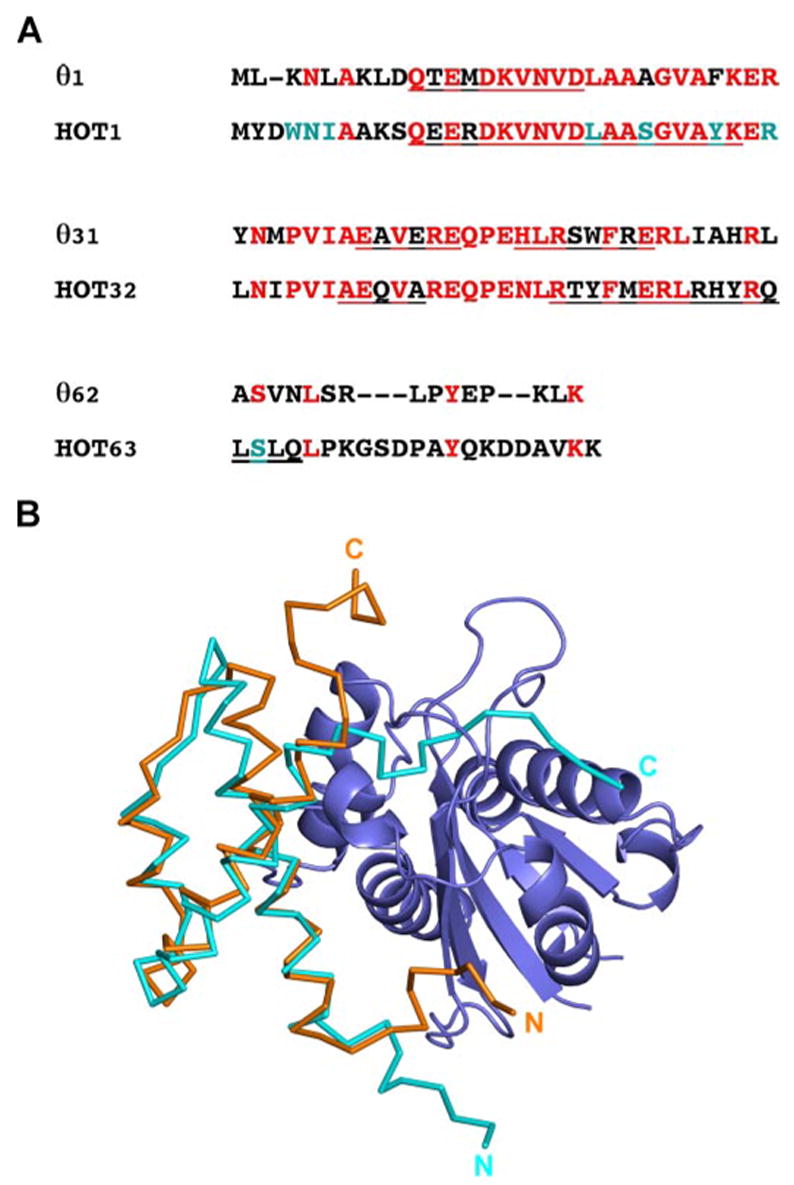
A, sequence alignment of HOT with θ showing conserved residues (red) and HOT residues involved in direct interactions with ε186 (cyan). Among the eight interacting residues, W4HOT and S24HOT represent non-conservative substitutions. B, superposition of NMR structure of θ (cyan) determined in complex with ε186 (14) and crystal structure of HOT (orange) complexed with ε186 (blue).
The structure of the ε186-HOT complex provides significant insight into the stabilizing role of HOT/θ on ε. First, formation of the HOT-ε186 complex removes 11% of the (mostly hydrophobic) ε186 surface area from solvent exposure. As εis an intrinsically unstable protein, subject to proteolysis in vivo (29) and aggregation and precipitation in vitro (11, 30), diminution of its hydrophobic surface is likely to be highly beneficial. Second, the interaction of the N-terminal HOT residues with ε186 strand β3 at the edge of the β-sheet must be considered a major stabilization factor, as unprotected edges of β-sheets generally represent adventitious interaction sites (31). As one example, the TREX2 nuclease, structurally very similar to ε186 (32), overcomes the negative effects of the corresponding β-sheet edge by using this edge as a dimerization interface. Third, the interaction with HOT likely leads to specific stabilization of the ε186 (α1–α2) helix-loop-helix. This region is particularly important because it contains pertinent residues, e.g. His66, which line the substrate binding pocket (11, 12); the dnaQ923 mutant (H66Y) is a proofreading-impaired mutant whose mutator phenotype is greatly exacerbated by the lack of θ or HOT (9, 16).
The present structure may provide a rationalization for several other dnaQ mutants with impaired proofreading capacity whose activity is negatively affected by the lack of θ or HOT (9, 16). Many of the mutants (Fig. 6) involve residues located on the ε central β-sheet (Thr, Arg, Val96) or residues that interact directly with this sheet (Leu171). It is likely that destabilization of the central sheet presents a situation where stabilization of the outside edge by θ or HOT becomes increasingly critical. In addition, destabilization of ε by mutations of residues on helix α1 (His66) or of residues that interact with α1 (Gly17, Arg56) is also reversed/limited in the presence of θ/HOT, consistent with the proposed stabilization of this region by HOT.
FIGURE 6. Stereo view of mutator residues.

Amino acids of ε that lead to a mutator phenotype when specifically substituted are shown in red on the structure of the ε186-HOT complex. HOT is in orange, and ε186 is in blue. Known mutator residues are Asp12 (a), Glu14 (b), Thr15 (c), Thr16 (d), Gly17 (e), Arg56 (f), His66 (g), Val96 (h), Asp103 (i), His162 (j), Ala161 (k), Asp167 (m), Leu171 (n), and Gly180 (o).
Finally, a notable aspect of the current structure is that it presents an example of a naturally occurring interspecies complex; as far as we know, it is the first such complex reported for a DNA replication assembly. Obviously, one interesting question is why bacteriophage P1 carries a homolog of θ while depending otherwise completely on the host replication machinery, as it carries no homolog for any other HE subunit (15). Data from our laboratory have shown that the HOT gene product is expressed from the phage genome during both lytic and lysogenic stages and that HOT and θ compete for incorporation into the HE.3 In view of the intrinsic instability of ε, it is possible that the amount of cellular θ is rate-limiting for incorporation of ε (or εθ) into the core. Thus, increased expression of the θ homolog from the phage may assure sufficient HE for phage replication.
Acknowledgments
We thank Drs. W. Beard and M. Garcia-Diaz for critical reading of the manuscript.
The abbreviations used are
- HE
E. coli DNA polymerase III holoenzyme
- Pol
DNA Polymerase
- HOT
bacteriophage P1 homolog of θ
- ε186
amino acid residues 1–186 of ε
- r.m.s.d
root mean square deviation
Footnotes
This work was supported by the Intramural Research Program of the National Institutes of Health, by NIEHS, and by National Institutes of Health Grant GM069962 (to F. W. P.).
R. M. Schaaper and A. Chikova, unpublished results.
The atomic coordinates and structure factors (code 2IDO) have been deposited in the Protein Data Bank, Research Collaboratory for Structural Bioinformatics, Rutgers University, New Brunswick, NJ (http://www.rcsb.org/).
Addendum—After submission of this study, crystallographic structures have been reported for the DNA Polymerase III α subunits from E. coli (Lamers, M. H., Georgescu, R. E., Lee, S. G., O’Donnell, M., and Kurivan, J. (2006) Cell 126, 881–892, and T. aquaticus (Bailey, S., Wing, R. A., and Steitz, T. A. (2006) Cell 126, 893–904).
References
- 1.O’Donnell M. J Biol Chem. 2006;281:10653–10656. doi: 10.1074/jbc.R500028200. [DOI] [PubMed] [Google Scholar]
- 2.McHenry CS. Mol Microbiol. 2003;49:1157–1165. doi: 10.1046/j.1365-2958.2003.03645.x. [DOI] [PubMed] [Google Scholar]
- 3.Fijalkowska IJ, Schaaper RM. Proc Natl Acad Sci U S A. 1996;93:2856–2861. doi: 10.1073/pnas.93.7.2856. [DOI] [PMC free article] [PubMed] [Google Scholar]
- 4.Lancy ED, Lifsics MR, Kehres DG, Maurer R. J Bacteriol. 1989;171:5572–5580. doi: 10.1128/jb.171.10.5572-5580.1989. [DOI] [PMC free article] [PubMed] [Google Scholar]
- 5.Stano NM, Chen J, McHenry CS. Nat Struct Mol Biol. 2006;13:458–459. doi: 10.1038/nsmb1078. [DOI] [PubMed] [Google Scholar]
- 6.Wieczorek A, McHenry CS. J Biol Chem. 2006;281:12561–12566. doi: 10.1074/jbc.M513844200. [DOI] [PubMed] [Google Scholar]
- 7.Perrino FW, Harvey S, McNeill SM. Biochemistry. 1999;38:16001–16009. doi: 10.1021/bi991429+. [DOI] [PubMed] [Google Scholar]
- 8.Taft-Benz SA, Schaaper RM. J Bacteriol. 1999;181:2963–2965. doi: 10.1128/jb.181.9.2963-2965.1999. [DOI] [PMC free article] [PubMed] [Google Scholar]
- 9.Taft-Benz SA, Schaaper RM. J Bacteriol. 2004;186:2774–2780. doi: 10.1128/JB.186.9.2774-2780.2004. [DOI] [PMC free article] [PubMed] [Google Scholar]
- 10.Lehtinen DA, Perrino FW. Biochem J. 2004;384:337–348. doi: 10.1042/BJ20040660. [DOI] [PMC free article] [PubMed] [Google Scholar]
- 11.DeRose EF, Li DW, Darden T, Harvey S, Perrino FW, Schaaper RM, London RE. Biochemistry. 2002;41:94–110. doi: 10.1021/bi0114170. [DOI] [PubMed] [Google Scholar]
- 12.Hamdan S, Carr PD, Brown SE, Ollis DL, Dixon NE. Structure. 2002;10:535–546. doi: 10.1016/s0969-2126(02)00738-4. [DOI] [PubMed] [Google Scholar]
- 13.Mueller GA, Kirby TW, DeRose EF, Li DW, Schaaper RM, London RE. J Bacteriol. 2005;187:7081–7089. doi: 10.1128/JB.187.20.7081-7089.2005. [DOI] [PMC free article] [PubMed] [Google Scholar]
- 14.Keniry MA, Park AY, Owen EA, Hamdan SM, Pintacuda G, Otting G, Dixon NE. J Bacteriol. 2006;188:4464–4473. doi: 10.1128/JB.01992-05. [DOI] [PMC free article] [PubMed] [Google Scholar]
- 15.Lobocka MB, Rose DJ, Plunkett G, Rusin M, Samojedny A, Lehnherr H, Yarmolinsky MB, Blattner FR. J Bacteriol. 2004;186:7032–7068. doi: 10.1128/JB.186.21.7032-7068.2004. [DOI] [PMC free article] [PubMed] [Google Scholar]
- 16.Chikova AK, Schaaper RM. J Bacteriol. 2005;187:5528–5536. doi: 10.1128/JB.187.16.5528-5536.2005. [DOI] [PMC free article] [PubMed] [Google Scholar]
- 17.DeRose EF, Kirby TW, Mueller GA, Chikova AK, Schaaper RM, London RE. Structure. 2004;12:2221–2231. doi: 10.1016/j.str.2004.09.019. [DOI] [PubMed] [Google Scholar]
- 18.Minor W, Cymborowski M, Otwinowski Z. Acta Physiol Pol A. 2002;101:613–619. [Google Scholar]
- 19.Vagin A, Teplyakov A. J Appl Crystallogr. 1997;30:1022–1025. [Google Scholar]
- 20.Bailey S. Acta Crystallogr Sect D Biol Crystallogr. 1994;50:760–763. doi: 10.1107/S0907444994003112. [DOI] [PubMed] [Google Scholar]
- 21.Jones TA, Zou JY, Cowan SW, Kjeldgaard M. Acta Crystallogr Sect A. 1991;47:110–119. doi: 10.1107/s0108767390010224. [DOI] [PubMed] [Google Scholar]
- 22.Brünger AT, Adams PD, Clore GM, DeLano WL, Gros P, Grosse-Kunstleve RW, Jiang JS, Kuszewski J, Nilges M, Pannu NS, Read RJ, Rice LM, Simonson T, Warren GL. Acta Crystallogr Sect D Biol Crystallogr. 1998;54:905–921. doi: 10.1107/s0907444998003254. [DOI] [PubMed] [Google Scholar]
- 23.DeLano WL. The PyMOL Molecular Graphics System. DeLano Scientific; San Carlos, CA: 2002. [Google Scholar]
- 24.Kraulis PJ. J Appl Crystallogr. 1991;24:946–950. [Google Scholar]
- 25.Merritt EA, Murphy MEP. Acta Crystallogr Sect D Biol Crystallogr. 1994;50:869–873. doi: 10.1107/S0907444994006396. [DOI] [PubMed] [Google Scholar]
- 26.Liu W, Eilers M, Patel AB, Smith SO. J Mol Biol. 2004;337:713–729. doi: 10.1016/j.jmb.2004.02.001. [DOI] [PubMed] [Google Scholar]
- 27.Güntert P, Mumenthaler C, Wüthrich K. J Mol Biol. 1997;273:283–298. doi: 10.1006/jmbi.1997.1284. [DOI] [PubMed] [Google Scholar]
- 28.Herrmann T, Güntert P, Wüthrich K. J Mol Biol. 2002;319:209–227. doi: 10.1016/s0022-2836(02)00241-3. [DOI] [PubMed] [Google Scholar]
- 29.Foster PL, Marinus MG. J Bacteriol. 1992;174:7509–7516. doi: 10.1128/jb.174.23.7509-7516.1992. [DOI] [PMC free article] [PubMed] [Google Scholar]
- 30.Hamdan S, Brown SE, Thompson PR, Yang JY, Carr PD, Ollis DL, Otting G, Dixon NE. J Struct Biol. 2000;131:164–169. doi: 10.1006/jsbi.2000.4291. [DOI] [PubMed] [Google Scholar]
- 31.Richardson JS, Richardson DC. Proc Natl Acad Sci U S A. 2002;99:2754–2759. doi: 10.1073/pnas.052706099. [DOI] [PMC free article] [PubMed] [Google Scholar]
- 32.Perrino FW, Harvey S, McMillin S, Hollis T. J Biol Chem. 2005;280:15212–15218. doi: 10.1074/jbc.M500108200. [DOI] [PubMed] [Google Scholar]
- 33.Lovell SC, Davis IW, Arendall WB, de Bakker PI, Word JM, Prisant MG, Richardson JS, Richardson DC. Proteins. 2003;50:437–450. doi: 10.1002/prot.10286. [DOI] [PubMed] [Google Scholar]