

1. Introduction
Current studies have consistently shown that the prefrontal cortex (PFC) GABAergic interneurons of psychotic patients [schizophrenia (SZ), and bipolar disorder with psychosis (BDP)] express a downregulation of glutamic acid decarboxylase (GAD)67 (one of the two decarboxylases that synthesize GABA) and reelin (an extracellular matrix protein that is preferentially synthesized and secreted by GABAergic interneurons) (Benes et al., 1992, Akbarian et al., 1995, Impagnatiello et al., 1998, Guidotti et al., 2000, Fatemi et al., 2000, Eastwood et al., 2003, Woo et al., 2004, Lewis et al., 2005). Upon secretion into the extracellular matrix, reelin adheres to the dendritic shafts and surrounds dendritic spines of cortical pyramidal neurons. This protein perhaps by impinging on synaptically located integrin receptors, modulates event-related protein synthesis and may influence the dendritic spine expression density (Costa et al., 2001, Liu et al., 2001, Dong et al., 2003), markedly changing LTP and cognitive function expression (Larson et al., 2003, Carboni et al., 2004, Bufferet et al., 2005, Qiu et al., 2006).
Reelin and GAD67 promoters are embedded in large CpG islands and express methylation consensuses (Grayson et al., 2005). In the PFC of SZ patients, a decrease of reelin expression was found to be associated with cytosine hypermethylation in the promoter region of the gene encoding for this protein (Grayson et al., 2005, Abdolmaleky et al., 2005). The regulatory role played by promoter CpG island methylation in the expression level of reelin can be inferred by the increase by up to 80 fold occuring the human reelin promoter following hypomethylation (Chen et al., 2002).
In the PFC of SZ and BDP patients, we have also quantified the expression of DNA methyltrasferase 1 (DNMT1), which catalyzes the methylation of the carbon atom in position 5 of cytosines in CpG dinucleotides of various gene promoter regions of GABAergic neurons. We found that in these PFC neurons DNMT1 is highly expressed whereas this enzyme cannot be detected in pyramidal neurons (Veldic et al., 2004, Ruzicka et al., 2006). Moreover, DNMT1 expression is increased in a subset of cortical GABAergic interneurons in SZ and BDP patients. For example, it is increased in cortical layers I, II, and IV GABAergic neurons but not in GABAergic neurons of layers III, V and VI (Veldic et al., 2005, Ruzicka et al., 2006). In PFC GABAergic neurons of SZ and BDP, the extent of the DNMT1 increase was accompanied by related decrease of reelin and GAD67 expression (Veldic et al., 2004, 2005). Hence, these studies suggest that the downregulation of GAD67 and reelin, or that of other genes expressed in cortical GABAergic neurons of psychotic patients, may be mediated by a 5-cytosine hypermethylation of the promoter CpG dinucleotides elicited by the increased expression of DNMT1 (Grayson et al., 2006).
Postmortem studies of human brain suggest that SZ may be associated with a GABAergic neuron downregulation detected not only in the cortex but also in the striatum (Impagnatiello et al., 1998). High affinity binding studies with [3H]muscimol show an increase in the number of GABAA recognition sites in the caudate nucleus (CN) of SZ patients (Hanada et al., 1987). In addition the expression levels of reelin mRNA are decreased by more than 70% in the CN of SZ patients compared to matched nonpsychiatric subjects (NPS) (Impagnatiello et al., 1998). In previous studies, we have shown that CN GABAergic neurons of SZ patients overexpress DNMT1 whereas reelin expression is downregulated (Veldic et al., 2004).
The goal of the present study is to replicate in the McLean 66 Cohort (Harvard Brain Tissue Resource Center, McLean Hospital, Belmont, MA) earlier findings of a DNMT1 mRNA increase in GABAergic neurons in Brodmann’s area (BA) 9 and BA10 (Veldic et al. 2004, 2005, Ruzicka et al., 2006) and verify whether there is an overexpression of DNMT1 and a parallel downregulation of reelin and GAD67 in CN and putamen (PT) medium spiny GABAergic neurons, in SZ and BDP patients.
2. Experimental/materials and methods
2.1. Tissue Collection
Tissue samples isolated from CN, PT, and BA9 of NPS, SZ or BDP patients were obtained from the Harvard Brain Tissue Resource Center, McLean Hospital, Belmont, MA (Table 1). All specimens were fixed in 4% formaldehyde. RNA quality was established by the Harvard Brain Tissue Resource Center, McLean Hospital, Belmont, MA (http://www.brainbank.mclean.org/) (Table 2). The brain was cut rostro-caudally in 0.5-cm-thick slices along the coronal axis, starting from the frontal pole. We received section 6 for the CN and PT and section 3 for BA9.
Table 1.
Demographic characteristics of brain samplesa, b obtained from the Harvard Brain Tissue Resource Center, McLean Hospital, Belmont, MA (The McLean 66).
| PATIENT COHORT | |||
|---|---|---|---|
| NPS (n=27) | SZP (n=20) | BP (n=14) | |
| Male/female | 19/8 | 13/7 | 7/7 |
| Hemisphere (L/R) | 15/12 | 12/8 | 9/5 |
| Age/years | 58 ± 18 | 56 ± 18 | 64 ± 16 |
| Postmortem interval/hrs | 21 ± 5.8 | 21 ± 5.5 | 21 ± 9.5 |
| Fixation days × 103 | 1.8 ± 0.6 | 2.2 ± 0.4 | 2.0 ± 0.6 |
| Brain pH | 6.4 ± 0.3 | 6.4 ± 0.3 | 6.4 ± 0.2 |
| 3′/5′ G3PDH ratio | 1.5 ± 0.4 | 1.6 ± 0.6 | 1.6 ± 0.8 |
| 3′/5′ β-actin ratio | 2.3 ± 0.9 | 2.4 ± 0.8 | 2.7 ± 1.3 |
| RNA 28S/18S ratio | 1.1 ± 0.3 | 1.1 ± 0.5 | 1.0 ± 0.3 |
| % present call | 46 ± 4.0 | 46 ± 4.1 | 44 ± 7.1 |
| Age of illness onset/years | - | 23 ± 9.9 | 38 ±17 |
| Duration of illness/years | - | 34 ± 18 | 28 ±18 |
| % Suicide | 0 | 16 | 21 |
| % Abuse or dependence | 0 | 47 | 43 |
| % CNS medications | |||
| Atypical antipsychotics | 0 | 32 | 43 |
| Typical antipsychotics | 0 | 37 | 29 |
| Typical and atypical | 0 | 5 | 0 |
| Valproate | 0 | 16 | 71 |
Formaldehyde fixed BA9; The values are mean ± SD; L = left; R = right; NPS = nonpsychiatric subjects; SZP = schizophrenia patients; BP = bipolar disorder.
The psychiatric diagnoses were established by two senior psychiatrists based on clinical and family histories and according to Feighner et al (1972) for SZ and The Diagnostic and Statistical Manual of Mental Disorders IV criteria for BP
Table 2.
Detailed demographic characteristics of the Harvard Brain Tissue Resource Center Study Group
| Nonpsychiatric subjects | |||||||||||
|---|---|---|---|---|---|---|---|---|---|---|---|
| a | b | c | d | e | f | g | h | i | j | k | l |
| M | 66 | 19 | 6.8 | 1.1 | 1.4 | 1.5 | 44 | - | 1 | - | - |
| M | 40 | 28 | 6.5 | 1.7 | 3.4 | 0.5 | 46 | - | 3 | - | - |
| M | 69 | 15 | 6.9 | 1.3 | 2.8 | 1.5 | 44 | - | 1 | - | - |
| F | 78 | 14 | 6.2 | 1.6 | 2.5 | 1.3 | 42 | - | 1 | - | - |
| M | 36 | 24 | 6.3 | 1.5 | 2.3 | 1.1 | 44 | - | 1 | - | - |
| M | 37 | 19 | 6.7 | 1.2 | 1.4 | 1.3 | 49 | - | 3 | - | - |
| M | 49 | 25 | 6.8 | 1.0 | 1.5 | 1.4 | 45 | - | 1 | - | - |
| M | 29 | 18 | 7.1 | 1.2 | 1.8 | 1.3 | 44 | - | 5 | - | - |
| F | 53 | 24 | 5.8 | 2.3 | 3.6 | 0.6 | 44 | - | 2 | - | - |
| M | 40 | 17 | 6.2 | 1.2 | 2.0 | 1.2 | 48 | - | 1 | - | - |
| F | 74 | 12 | 6.3 | 1.5 | 2.3 | 0.8 | 45 | - | 5 | - | - |
| M | 54 | 24 | 6.6 | 1.0 | 1.5 | 1.3 | 53 | - | 1 | - | - |
| M | 36 | 20 | 6.0 | 1.6 | 2.3 | 0.9 | 48 | - | 1 | - | - |
| F | 70 | 22 | 6.3 | 2.3 | 3.7 | 0.4 | 37 | - | 2 | - | - |
| M | 67 | 22 | 6.4 | 1.1 | 1.7 | 1.4 | 48 | - | 1 | - | - |
| M | 42 | 18 | 6.8 | 1.0 | 1.4 | 1.1 | 54 | - | 1 | - | - |
| M | 79 | 21 | 6.7 | 1.5 | 2.8 | 0.6 | 49 | - | 2 | - | - |
| F | 78 | 24 | 6.7 | 1.4 | 2.3 | 0.9 | 48 | - | 2 | - | - |
| M | 38 | 29 | 6.5 | 1.1 | 1.5 | 1.5 | 49 | - | 1 | - | - |
| F | 65 | 24 | 6.4 | 1.1 | 1.8 | 1.3 | 52 | - | 5 | - | - |
| F | 66 | 7 | 6.0 | 1.5 | 2.5 | 0.6 | 47 | - | 2 | - | - |
| M | 89 | 7 | 6.4 | 1.5 | 2.4 | 1 | 47 | - | 2 | - | - |
| M | 35 | 26 | 6.3 | 1.2 | 1.4 | 1.4 | 40 | - | 5 | - | - |
| M | 50 | 24 | 6.0 | 2.1 | 3.1 | 1.1 | 42 | - | 5 | - | - |
| M | 84 | 29 | 6.4 | 2.2 | 5.0 | 0.5 | 44 | - | 1 | - | - |
| M | 73 | 20 | 6.0 | 1.5 | 2.5 | 1 | 40 | - | 5 | - | - |
| Schizophrenia patients | |||||||||||
| a | b | c | d | e | f | g | h | i | j | k | l |
| M | 66 | 22 | 6.4 | 1.0 | 1.4 | 1.8 | 48 | 20 | 1 | H | Y |
| F | 83 | 23 | 5.9 | 2.0 | 3.5 | 0.2 | 42 | 55 | 3 | H | Y |
| M | 44 | 19 | 6.0 | 3.0 | 4.0 | 0.9 | 34 | 20 | 1 | Cz | N |
| M | 35 | 28 | 6.2 | 1.6 | 2.1 | 1 | 46 | 31 | 1 | UN | N |
| M | 46 | 18 | 6.3 | 3.2 | 2.6 | 1 | 45 | 19 | 3 | V, O | Y |
| M | 26 | 16 | 6.7 | 1.3 | 2.6 | 1.6 | 50 | 23 | 4 | F | Y |
| M | 42 | 27 | 6.6 | 1.0 | 2.0 | 1.2 | 45 | 16 | 2 | NT | Y |
| M | 47 | 19 | 6.6 | 2.0 | 4.0 | 1.9 | 47 | 17 | 2 | NT | N |
| M | 31 | 15 | 6.5 | 1.2 | 2.0 | 1.1 | 49 | 19 | 5 | R, O, Bp | Y |
| M | 80 | 11 | 6.4 | 1.4 | 1.8 | 0.5 | 41 | 17 | 1 | Th, Mr | N |
| M | 49 | 19 | 6.6 | 1.0 | 1.2 | 1.8 | 50 | 19 | 4 | H | Y |
| M | 61 | 20 | 6.7 | 1.5 | 2.2 | 1.5 | 46 | 25 | 3 | H | N |
| F | 73 | 24 | 6.1 | 1.6 | 3.0 | 0.5 | 47 | 23 | 2 | R, Fx | N |
| M | 63 | 22 | 6.5 | 1.1 | 2.8 | 1.3 | 50 | 7 | 1 | Cz, Ta, H | N |
| F | 72 | 22 | 6.6 | 1.2 | 2.0 | 0.7 | 50 | 24 | 2 | R, Pa | N |
| F | 84 | 26 | 6.1 | 1.7 | 2.8 | 0.5 | 40 | 34 | 1 | V | N |
| M | 42 | 18 | 6.3 | 1.3 | 2.1 | 1 | 46 | 27 | 4 | Ta | Y |
| F | 78 | 13 | 6.8 | 1.5 | 2.3 | 1.2 | 46 | 16 | 3 | L, H | N |
| F | 48 | 34 | 6.6 | 1.2 | 1.5 | 1.3 | 47 | 17 | 1 | V, R | Y |
| Bipolar patients with psychosis | |||||||||||
| a | b | c | d | e | f | g | h | i | j | k | l |
| F | 64 | 11 | 6.7 | 1.0 | 1.7 | 1.3 | 51 | 20 | 1 | V, Cr, T, D | N |
| M | 38 | 41 | 6.5 | 1.0 | 1.2 | 1.4 | 43 | 37 | 4 | Se, L, V | N |
| F | 80 | 12 | 6.5 | 3.0 | 4 | 1 | 27 | 38 | 3 | Pe, V | N |
| F | 42 | 16 | 6.3 | 1.1 | 1.7 | 1.3 | 52 | 20 | 4 | V, L, Pe | Y |
| M | 78 | 30 | 6.3 | 1.9 | 4.2 | 0.7 | 42 | 49 | 1 | Ch, F, V, L | N |
| F | 76 | 23 | 6.6 | 1.9 | 3.8 | 0.5 | 42 | 67 | 1 | L | Y |
| M | 74 | 25 | 6.5 | 1.4 | 3.4 | 0.8 | 47 | 50 | 1 | V, Q | Y |
| M | 74 | 7 | 6.7 | 2.9 | 4.1 | 1.3 | 33 | 72 | 1 | O | N |
| F | 55 | 18 | 6.5 | - | - | 0.7 | 47 | 40 | 2 | V | Y |
| F | 73 | 21 | 6.3 | 1 | 1.6 | 1.2 | 51 | 25 | 3 | R | N |
| M | 74 | 14 | 6.3 | 1.9 | 2.7 | 0.5 | 38 | 18 | 1 | O, L, V | N |
| F | 73 | 17 | 6.4 | 2.0 | 3.5 | 0.5 | 42 | 25 | 3 | V, R, Se | N |
| M | 40 | 31 | 6.0 | 1.3 | 2.4 | 0.6 | 48 | 25 | 4 | R, Nf, Z | Y |
| M | 83 | 17 | 6.6 | 1.6 | 3 | 1.3 | 47 | 43 | 1 | V, Pa | Y |
a = Gender; b = Age (years); c = Postmortem interval - interval between death and brain fixation in formaldehyde (hr); d = Brain pH; e = 3′/5′ G3PDH ratio; f = 3′/5′ β-actin ratio; g = 28s/18s RNA ratio; h = percent probe sets present; i = Age of onset of illness (years); j = Cause of death: 1 – cardiopulmonary failure; 2 – cancer; 3 – other; 4 – suicide; 5 – unknown. k = Medication: Bp – buproprion; Cr – carbamazepine; Ch – chlorpromazine; Cz – clozapine; D – doxepin; Fx – fluoxetine; F – fluphenazine; H – haloperidol; L – lithium; Mr – mirtazapine; Nf – nefazodone; O – olanzapine; Q – quetiapine; Pa - paroxetine; Pe - perphenazine; P – phenelzine; R – risperidone; Se – sertraline; Th – thioridazine; Ta – trazodone; T – trifluoperazine; V – valproic acid; Z – ziprasidone. UN = never treated; NT = not treated six months or more before death; UK = unknown; l = Abuse or dependency history: Y - yes; N - no.
2.2. In situ hybridization and immunocytochemistry
Free-floating 40-μm sections were incubated for 48 hrs with a mixture of 50 pmol/ml of antisense oligonucleotides (Rodriguez et al., 2002, and Veldic et al., 2004) using probes complementary to bases a) 1627–1650 and 4801–4824 of the human DNMT1 cDNA (GenBank accession no. NM001379); b) 1729–1752, 5505–5528, and 10102–10125 of the human reelin cDNA (GenBank accession no. NM005045); c) 885–908 and 1661–1684 of the human GAD65 cDNA (GenBank accession no. NM00818); and d) 1063–1086 and 2674–2697 of the human GAD67 cDNA (GenBank accession no. NM00817).
These nucleotides failed to match either DNMT3a or DNMT3b sequences or any other known mRNA sequence and were selected according to the criteria reported by Veldic et al (2004).
Neuron-specific nuclear protein (NeuN) immunolabeling was studied in 40μm floating sections incubated with a mouse anti-NeuN monoclonal antiserum (Chemicon, Temecula, CA) diluted 1:500 as previously described (Veldic et al., 2004).
2.3. Confocal fluorescence microscopy
After DNMT1 mRNA in situ hybridization was completed, sections were processed for immunohistochemistry with antibodies directed against GAD65/67 (Chemicon, Temecula, CA, 1:2000) (Veldic et al., 2004).
Cy-5-conjugated goat anti-rabbit IgG (Amersham Biosciences, Piscataway, NJ, 1:1000) were used to label the antibodies that reacted with GAD65/67. Cy2-conjugated streptavidin (1:1000) was used to label DNMT1 mRNA. After washing, the sections were incubated in 10mM CuSO4 and 50mM CH3COONH4 for 30 min to eliminate interference by lipofuscin-mediated autofluorescence (Veldic et al., 2004).
2.4. Three-dimensional counts
The cell counts were performed as described by Veldic et al. (2004). The reproducibility and reliability of our in situ histochemical procedures was established as reported by Veldic et al. (2005).
In BA9, the definition of the border separating layer III from layer IV may not always be distinct because this layer contains large pyramidal cells intermixed with small granular cells (Rajkowska et al., 1995). To avoid confusion regarding layer III boundaries and to optimize our counting reproducibility, we adopted the procedure described by Volk et al. (2000) in which the borders of the lower part of layers III and IV were designated as layers III–IV.
To count strongly stained cells and exclude weakly stained cells or non-specifically-labeled cells from the analysis, the threshold intensity of staining was established at 3X the background (measured by Leica Confocal Software).
2.5. Statistical analyses
Statistical analyses were performed using univariate or repeated measures analysis of variance (ANOVA) or covariance (ANCOVA) with Bonferroni corrections and the identification of diagnostic groups (controls versus patients, schizophrenics versus bipolars) using logistic regression on the SPSS and SAS statistical packages. Since we were examining DNMT1, GAD67, and reelin mRNAs we used a Bonferroni procedure to correct for type I error and therefore for all t tests we accepted as significance P<0.013 (i.e., .05÷3).
3. Results
3.1. Medium spiny neurons of CN and PT
3.1.1. CN
Fig 1 (A,B,C) shows that in the CN of the NPS group several but not all GAD65/67-containing neurons express detectable amounts of DNMT1 mRNA. In contrast, in the CN of SZ patients (Fig 1 D, E, F), almost every GAD65/67-positive neuron is DNMT1 mRNA-positive.
Figure 1. Colocalization of DNMT1mRNA and GAD65/67 immunoreactivity in CN of NPS and SZ patients.
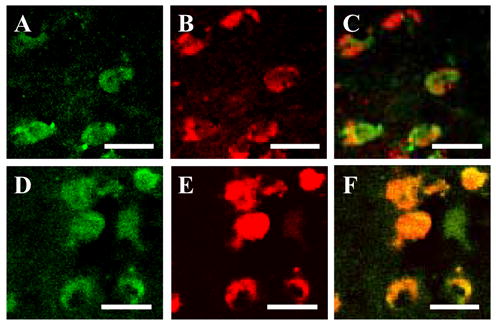
(A) DNMT1 mRNA-positive neurons in CN of NPS, color-coded in green (scale bar, 20 μm). (B) GAD65/67 immunoreactivity in CN of NPS, color-coded in red (scale bar, 20 μm). (C) Merge of A and B (scale bar, 20 μm). (D) DNMT1 mRNA-positive neurons in CN of SZ patient, color-coded in green (scale bar, 20 μm) (E) GAD65/67 immunoreactivity in CN of SZ patient, color-coded in red (scale bar, 20 μm). (F) Merge of A and B (scale bar, 20 μm).
The three-dimensional counting established that the average number of DNMT1 mRNA-positive neurons is increased in the SZ group by ~40% compared to the corresponding number of DNMT1-positive neurons in NPS (Fig 2a). In contrast in subjects with BDP, statistical analyses fail to demonstrate a significant increase in the number of DNMT1 mRNA positive neurons (Fig 2a). The number of NeuN positive neurons is virtually identical in SZ, BDP, and NPS (Fig 2a).
Figure 2. Density of DNMT1, reelin, GAD67 mRNAs, and NeuN protein immunoreactive neurons in CN and PT from NPS and psychiatric patients.
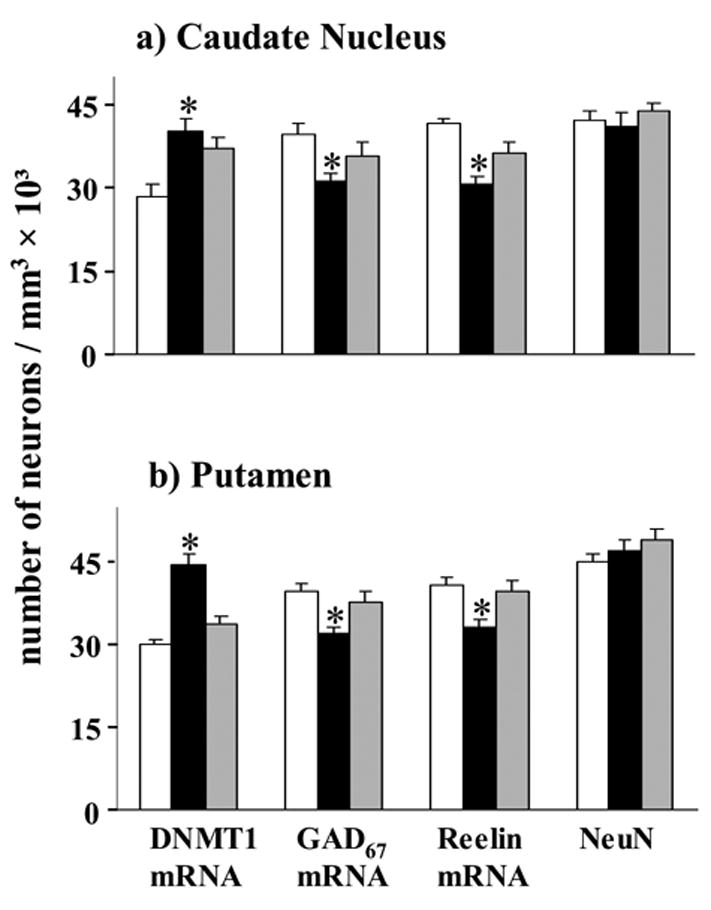
□ NPS; ■ SZ;
 BDP.
BDP.
a) Caudate nucleus (CN). Each bar represents the mean ± SE of 27† NPS, 20 SZ and 14† BP disorder patients. The difference between SZ and BDP patients versus NPS was calculated by ANOVA and P values were evaluated by Bonferroni multiple comparisons (t test).
*, asterisk indicates a statistically significant difference at P ≤ 0.013 vs. NPS.
DNMT1 mRNA positive neurons: ANOVA (F2,56=9.1, P<0.001); Bonferroni post hoc analysis (P<0.001 of NPS vs. SZP and P=NS of NPS vs. BP); reelin mRNA positive neurons: ANOVA (F2,54=20.1, P<0.001); Bonferroni post hoc analysis (P<0.001 of NPS vs. SZP and P=NS of NPS vs. BP); GAD67 mRNA positive neurons: ANOVA (F2,55=4.8, P=0.012); Bonferroni post hoc analysis (P=0.009 of NPS vs. SZP and P=NS of NPS vs. BP); NeuN: P=NS.
†On closer inspection of the data, it was noticed that the density of the reelin mRNA-expressing neurons in one NPS and one BDP patient was 3 SD above the mean density, GAD67 mRNA-expressing cells in one NPS was also 3 SD above the mean density. These cases were therefore excluded from the numerical density comparisons reported herein.
b) Putamen (PT). Each bar represents the mean ± SE of 27 NPS, 20 SZ and 14 BDP‡ patients. The difference between SZP and BDP patients with psychosis versus NPS was calculated by ANOVA and p values were evaluated by Bonferroni multiple comparisons (t test).
*, asterisk indicates a statistically significant difference at p ≤ 0.013 vs. NPS.
DNMT1 mRNA positive neurons: ANOVA (F2,55=34.0, P<0.001); Bonferroni post hoc analysis (P<0.001 of NPS vs. SZP and P=NS of NPS vs. BP); reelin mRNA positive neurons: ANOVA (F2,56=7.4, P=0.001;, Bonferroni post hoc analysis (P=0.002 of NPS vs. SZP and P=NS of NPS vs. BP); GAD67 mRNA positive neurons: ANOVA (F2,56=7.1, P=0.002); Bonferroni post hoc analysis (P=0.001 of NPS vs. SZP and P=NS of NPS vs. BP); NeuN: P=NS.
†On closer inspection of the data, it was noticed that the numerical density of the DNMT1 mRNA-expressing cells in one BP patient was 3 SD above the mean density. This case was therefore excluded from the average numerical density comparisons reported herein.
In the CN of NPS, more than 90% of the NeuN-positive neurons express reelin and GAD67 mRNAs (Fig 2a). The number of reelin mRNA positive neurons decreases by 26% in SZP but virtually does not change when BDP counts are compared to NPS (Fig. 2a). The number of GAD67 mRNA-positive neurons is also significantly decreased in SZ (21%), but not in BDP disorder (Fig. 2a).
3.1.2. PT
Fig. 2b shows that in the PT, the number of DNMT1 mRNA-positive neurons is increased (~ 49%) and the number of neurons expressing reelin and GAD67 mRNAs is decreased in the SZ group. In contrast, the number of DNMT1, reelin and GAD67 mRNA positive neurons fails to change in the BDP patient group (Fig. 2b).
In SZ and BDP patients, there is no difference between groups in the number of NeuN positive neurons (Fig 2b). We also compared the number of DNMT1, GAD67, and reelin mRNA-positive neurons in SZ versus the BDP group. The increase in DNMT1 and the decrease of reelin and GAD67 mRNA comparing SZP and BDP were statistically different; DNMT1 (p<0.001), GAD67 (p=0.01), and reelin (p=0.01) (Student’s t-test).
3.2. Prefrontal cortex BA9
As shown in Fig. 3 changes in DNMT1, GAD67, and reelin expression in BA9 are cortical layer- and disease-specific: a) the number of DNMT1 mRNA-positive neurons is increased in layers I and II of SZ and BDP patients compared to NPS, b) in layer III–IV, the increase in DNMT1 mRNA-positive neurons is smaller than in layers I and II and occurs in SZ but not in BDP, c) a difference in the number of DNMT1 mRNA-positive neurons failed to be detected in the layers V and VI of both SZ or BDP compared to NPS.
Figure 3. DNMT1 upregulation is associated with reelin and GAD67 downregulation in BA9 neurons of SZ and BDP patients.
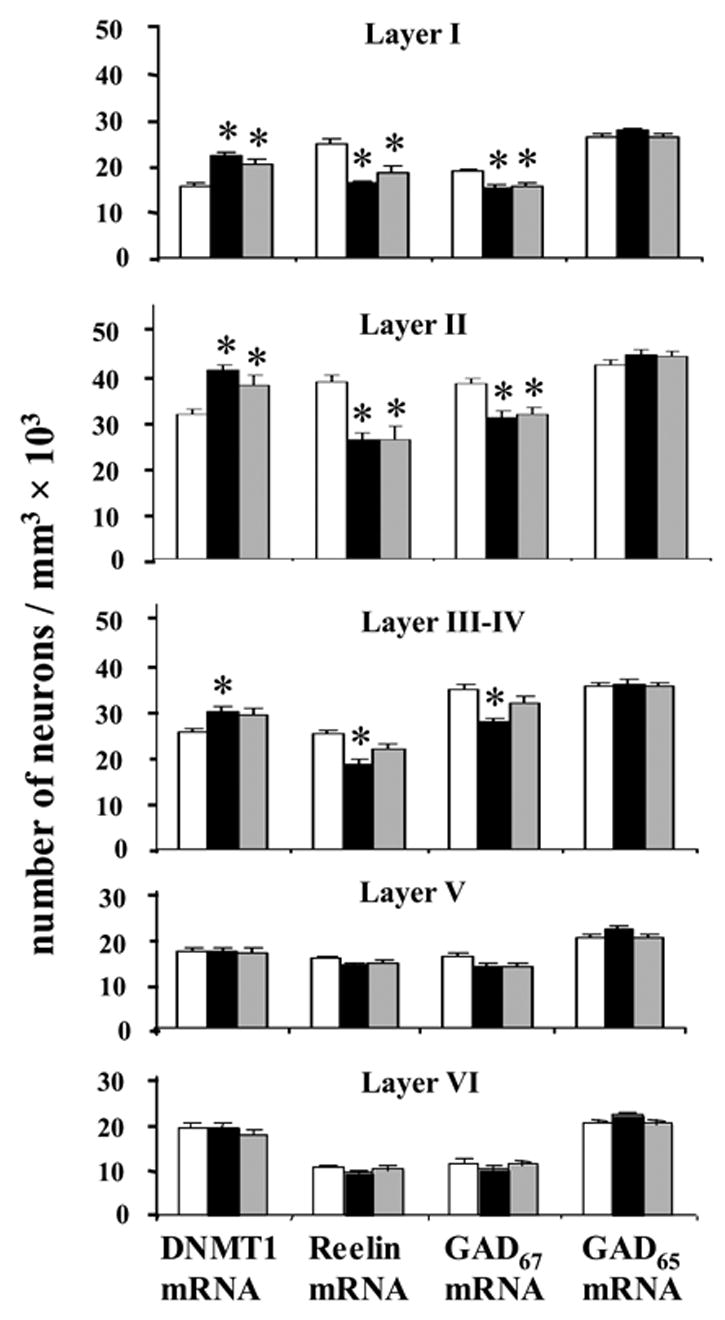
□ NPS; ■ SZ;
 BDP.
BDP.
*, asterisk indicates a statistically significant difference at P ≤ 0.013 vs. NPS.
Each bar represents the mean ± SE of three-dimensional counts of DNMT1, reelin, GAD67, and GAD65 mRNA-positive neurons in various layers of BA9 from NPS (N=26), SZ (N=19), and bipolar BDP (N=14) patients. Differences were calculated by ANOVA, and p values were compared with Bonferroni t test. *Denotes a statistically significant difference when SZ or BDP disorder groups are compared with NPS.
DNMT1 mRNA positive neurons: Layer I [ANOVA (F2,56=17.4; P<0.001); Bonferroni post hoc analysis (P<0.001 of NPS vs. SZP and P=0.001 of NPS vs. BP)]; Layer II [ANOVA (F2,56=12.2; P<0.001)); Bonferroni post hoc analysis (P<0.001 of NPS vs. SZP and P=0.010 of NPS vs. BP)]; Layer III–IV [ANOVA (F2,56=6.4; P=0.003); Bonferroni post hoc analysis (P=0.004 of NPS vs. SZP and P=NS of NPS vs. BP)]; Layer V (NS); Layer VI (NS). None of the conclusions derived from ANOVA were affected by including confounding variables in the analysis.
Reelin mRNA positive neurons: Layer I [ANOVA (F2,56=24.1; P<0.001); Bonferroni post hoc analysis (P<0.001 of NPS vs. SZP and P<0.001 of NPS vs. BP)]; Layer II [ANOVA (F2,56=15.0; P<0.001)); Bonferroni post hoc analysis (P<0.001 of NPS vs. SZP and P<0.001 of NPS vs. BP)]; Layer III–IV [ANOVA (F2,56=12.5; P<0.001); Bonferroni post hoc analysis (P<0.001 of NPS vs. SZP and P=NS of NPS vs. BP)]; Layer V (NS); Layer VI (NS).
GAD67 mRNA positive neurons: Layer I [ANOVA (F2,56=10.4; P<0.001); Bonferroni post hoc analysis (P<0.001 of NPS vs. SZP and P=0.003 of NPS vs. BP)]; Layer II [ ANOVA (F2,56=16.3; P<0.001)); Bonferroni post hoc analysis (P<0.001 of NPS vs. SZP and P<0.001 of NPS vs. BP)]; Layer III–IV [ANOVA (F2,56=10.6; P<0.001)); Bonferroni post hoc analysis (P<0.001 of NPS vs. SZP and P=NS of NPS vs. BP)]; Layer V [ANOVA (F2,56=3.7; P=0.031); NS when confounding variables were taken into account]; Layer VI (NS). GAD65 mRNA positive neurons:Layer I (NS); Layer II (NS); Layer IIIs (NS); Layer III–IV (NS); Layer V (NS); Layer VI (NS).
Fig. 3 also shows that the counts of reelin and GAD67 mRNA-positive neurons are lower in layers I and II of SZ or BDP compared to NPS.
The number of reelin and GAD67 mRNA positive neurons is decreased in layers III–IV of SZ but not in BDP compared to NPS. Moreover in layers III–IV, the decrease of reelin and GAD67 mRNAs in SZ patients was significantly different from BDP using the Student’s t-test (reeling mRNA: p=0.047; GAD67 mRNA: p=0.01).
Importantly, in cortical layer I, which virtually express only GABAergic neurons (Gabbott and Somogyi 1986) and where the changes of DNMT1, reelin and GAD67 expression are more pronounced than in other layers, there is a negative correlation between the densities of DNMT1 and that of GAD67 mRNA-positive neurons or reelin mRNA-positive neurons. (Fig 4). In contrast, there is a positive correlation between the densities of reelin and GAD67 mRNAs positive neurons (Fig 5).
Figure 4. Pearson correlation between counts of DNMT1 mRNA and reelin mRNA (A) or GAD67 mRNA (B) positive neurons in layer I BA9 of SZ, BDP, and NPS.
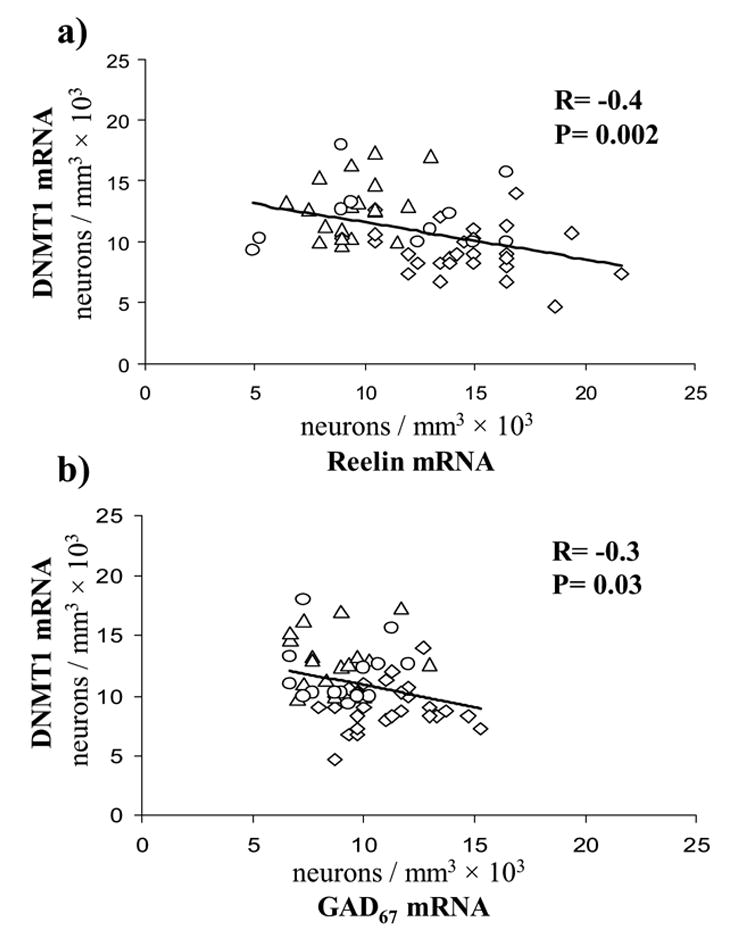
◇ NPS, △ SZ, ○ BDP
Figure 5. Pearson correlation between counts of reelin mRNA and GAD67 mRNA positive neurons in layer I BA9 of SZ, BDP, and NPS.
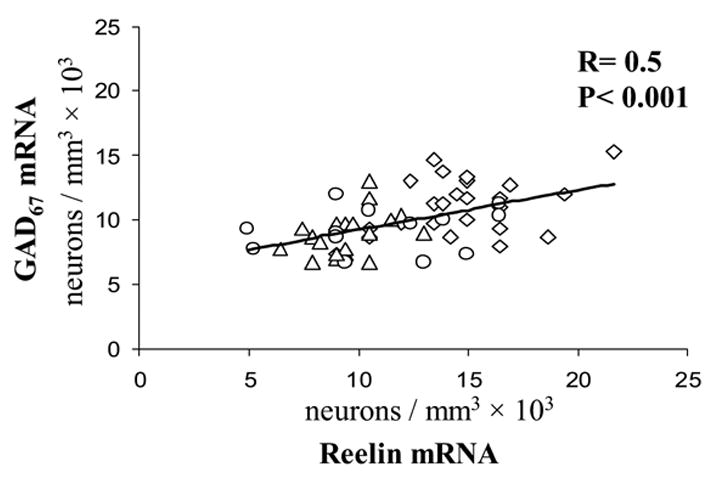
◇ NPS, △ SZ, ○ BDP
No differences between the patient and NPS groups were detected in the number of GAD65 mRNA-positive neurons (Fig. 3) or in the number of NeuN-immunopositive neurons in every cortical layer of BA9 (not shown).
3.3. Confounding variables
We tested whether background variables or other possible confounding variables may have influenced the results: 1) Average values for the confounding variables listed in Table 1 were similar in all three groups. 2) Repeated measure ANCOVAs of various cortical layers, CN, and PT with confounding variables as covariates or factors (gender, hemisphere) failed to show any significant direct differences between the three groups of the four outcome variables. However there was an exception, the counts of GAD67 mRNA-expressing neurons were weakly associated with PMI in most areas. However, when examined individually by linear regression, none of these correlations were significant. Most likely this occurred by chance alone due to the large number of confounding variables considered. Furthermore, the measures of RNA quality did not alter the results. 3) More importantly, we failed to find that any of the confounding variables differentially affected the difference between the diagnostic groups on any of tested variables.
In our cohort, several patients had a current history of alcohol or other substance abuse. The neuronal counts of DNMT1, reelin, GAD65, GAD67 mRNAs, or NeuN were virtually identical whether the subjects with a history of substances of abuse were included or excluded from the analysis, neither did our ANCOVA find any significant change for this variable.
Increases in DNMT1 and decreases in reelin and GAD67 mRNA-positive neurons in SZ and BDP patients also failed to correlate with antipsychotic drug dosage or type of the antipsychotic treatment.
4. Discussion
4.1. DNMT1 is overexpressed in GABAergic neurons of caudate/putamen from SZ but not from BDP patients
From the study of DNMT1 mRNA expression in the CN, PT, and BA9 of the entire McLean 66 cohort, it was found that in the telencephalon: a) DNMT1 was exclusively expressed in GABAergic neurons, b) in SZ patients, the number of GABAergic neurons expressing DNMT1 mRNA was increased not only in BA9 layers I, II, III–IV, but also in CN and PT, and that c) in BDP, the number of DNMT1 mRNA-positive neurons was increased in layers I and II of BA9, but not in GABAergic neurons of CN, PT, or layers III–IV in BA9.
Thus although in PFC (BA9), both SZ and BDP may have an epigenetically-mediated neuropathology of GABAergic neurons as a common denominator, in the basal ganglia, GABAergic neurons appear to overexpress DNMT1 and underexpress reelin and GAD67 only in SZ patients.
These differences between SZ and BDP are consistent with previous reports suggesting that GABAergic neurons located in the upper layers of the PFC may exhibit a similar neuropathology in SZ and BDP, whereas in the GABAergic neurons of the lower layers, this neuropathology is specific to SZ (Volk et al., 2000, Lewis et al., 2005) but not to BDP (Woo et al., 2004).
Because of the findings presented here, one must question why the changes in DNMT1 expression in SZ and BDP are selective in specific subsets of GABAergic neurons.
To relate neurochemical changes occurring in selected populations of GABAergic neurons to the psychopathology in SZ and in BDP disorder, it is important to consider the characteristic network in which different populations of GABAergic neurons operate. In the PFC, cortical GABAergic neurons of layers I and II receive excitatory afferent inputs primarily from amygdala and in part from the mediodorsal nucleus of the thalamus (Barbas and De Olmos 1990, Woo et al., 2004) whereas GABAergic interneurons of layers III–IV, V, and VI receive their excitatory inputs mostly from the mediodorsal thalamic cortical afferents (Rotaru et al., 2005). Several lines of evidence suggest that neuropathologies in the thalamus (Popken et al., 2000) and amygdala (Aleman and Kahn 2005) contribute to SZ morbidity. Hence, abnormal function of the amygdala afferents in the cortex could be responsible for the overexpression of DNMT1 and the downregulation in the expression of GAD67 and reelin in layer I and II GABAergic neurons in SZ and BDP.
GABAergic medium spiny neurons represent at least 95% of the total neuronal population in the CN and PT (Tisch et al., 2004). In primates, the CN receives cortical afferents primarily from PFC association areas (BA9, BA10, BA46), whereas somatosensory cortical areas encompassing BA 1–3 and motor cortical areas (BA 4–6) send projections primarily to the PT (Kemp and Powel 1970, Kunzle 1975, Selemon and Goldman Rakic 1985, Parent and Hazrati 1995).
Cortical afferents in the CN and PT may play a critical role in integrating diverse types of information derived from prefrontal associative or sensory motor cortices. Hence, disturbances in information processing at cortico-CN and cortico-PT neuronal circuits might contribute to the differences in the expression of DNMT1 observed in the basal ganglia of SZ versus BDP.
A recent study (Benes et al., 2006) reported that the expression of preapoptotic genes is increased in bipolar disorder but not in SZ postmortem brains. These and other related data support the view that fundamental differences must exist in the pathogenetic alterations underlying SZ and BDP. Thus, the differences between SZ and BDP in DNMT1, reelin, and GAD67 expression in the GABAergic neurons of various cortical layers and basal ganglia might not be the consequence of a continuum of disease severity but rather a characteristic feature of the differential pathogenetic mechanisms associated with the neuropathology and symptomatology of BDP as distinguished from SZ.
4.2. Is DNMT1 overexpression in telencephalic GABAergic neurons of SZ and BDP causing an epigenetic downregulation of GAD67 and reelin expression?
Our study shows that in GABAergic neurons of the CN, PT, and BA9, when DNMT1 mRNA expression is increased there is a corresponding decrease of reelin and GAD67-expression (Fig 2, Fig 3, Fig 4). However, in the CN and PT of BDP, the number of GABAergic neurons expressing DNMT1 mRNA failed to change significantly and the expression of reelin and GAD67 also failed to change.
The hypothesis that the relationship between DNMT1 overexpression and GAD67 and reelin downregulation in GABAergic neurons is cause-related is suggested by the existence of a statistically significant inverse correlation between the increase of DNMT1 and the decrease of reelin or GAD67 mRNA positive neurons demonstrated in layer I of SZ, BDP, and NPS (Fig 4). This hypothesis is further supported by studies of Tremolizzo et al. (2002, 2005) and Dong et al. (2005) in an epigenetic mouse model of SZ, and by studies of Chen et al. (2002), Mitchell et al. (2005), and Noh et al. (2005), in primary and clonal neuronal cell lines in vitro. These studies show that when the level of DNMT1 is increased and presumably hypermethylation occurs in GAD67 and reelin promoter CpG islands, GAD67 and reelin genes are transcriptionally repressed. In contrast, when the action of DNMT1 is abated, for example by administration of DNMT1 antisense RNA, GAD67 and reelin promoter CpG islands are hypomethylated and GAD67 and reelin are transcriptionally upregulated [for a review Grayson et al (2006)]. Furthermore, studies in SZ patients suggest that reelin promoter hypermethylation is restricted to a subset of cytosine residues in a specific promoter region important for the binding of the complex assembly of transcription factors and the RNA polymerase II (Grayson et al., 2005). Thus, it is likely that the increase of DNMT1 expression in telencephalic GABAergic neurons of SZ and BDP patients represents the molecular mechanism for GAD67 and reelin promoter hypermethylation and the consequent GAD67 and reelin transcription downregulation.
4.3. The ove rexpression of DNMT1 in BA 9 and basal ganglia GABAergic neurons of SZ or BDP does not bring about an indiscriminate downregulation of all the genes expressed in these neurons
Although in addition to GAD67 and reelin, other genes such as NR2A (Woo et al., 2004) and GAT1 (Lewis et al., 2005), are downregulated in GABAergic neurons of SZ patients, GAD65 mRNA and protein levels are not altered in the BA 9, CN, and PT of SZ or BDP (Fig 3) . Interestingly, the GAD65 promoter is embedded in CpG islands (Costa et al., 2002) and therefore, an increased expression of DNMT1 in GABAergic neurons would predict GAD65 promoter hypermethylation and GAD65 mRNA and protein expression downregulation. Based on this possibility, we can speculate that the unexpected lack of GAD65 downregulation in the same neurons in which epigenetic promoter hypermethylation likely induces reelin and GAD67 expression downregulation: a) the GAD65 promoter, unlike RELN and GAD67 promoters, is already hypermethylated in NPS and therefore in SZ and BDP patients its expression cannot be further downregulated by DNMT1 overexpression; and b) DNMT1 fails to target GAD65 promoters due to the inhibitory role of specific/local chromatin factors, such as histone modifying enzymes, chromatin remodeling proteins, and the protein complexes, including the repressor MeCP2 proteins, which alter the affinity of DNMT1 for S-adenosylmethionine and CpG island promoters (Jenuwein and Allis 2001, Robertson et al., 2004, Hong et al., 2005). This consideration suggests study of whether the expression of other gene promoters rich in CpG islands is also downregulated in GABAergic neurons showing elevated levels of DNMT1.
4.4. Conclusions
It is well established that telencephalic (PFC, CN and PT) GABAergic neurotransmission is involved in various aspects of normal psychomotor behavior and if altered, the change in GABAergic transmission may contribute to the severity of the clinical morbidity in SZ and BDP (Hanada et al., 1987, Impagnatiello et al., 1998, Benes et al., 2001, Tekin and Cummings 2002, Guidotti et al., 2005, Lewis et al., 2005). The data presented here support the view that the dysfunction of GABAergic neurotransmission (including the downregulation of reelin and GAD67) in BA9, CN, and PT of SZ is brought about by the hypermethylation of gene promoters in GABAergic neurons elicited by the overexpression of DNMT1. Since it is evident that the extent of the DNMT1 increase and of the reelin or GAD67 expression decrease in SZ and BDP is cortical layer- and brain region-selective, it is suggested that a study of the alterations of the afferent inputs (glutamatergic, cholinergic, or dopaminergic) to telencephalic GABAergic neurons may help to clarify the pathogenetic mechanisms that differentiate the epigenetic nature of the dysfunction operative in SZ and BDP and perhaps lead to specific models in which drug efficacy in SZ and BDP could be tested.
Epigenetic mechanisms involve marking of DNA (promoter hypermethylation) and of its associated chromatin remodeling processes (i.e., covalent histone tail acetylation or methylation). Drugs currently being evaluated for their ability to reduce DNMT1 activity in cancer therapy, such as procainamide or zebularine (Brueckner and Lyko 2004), should be also tested in appropriate protocols to evaluate SZ and BDP treatment efficacy. Such drugs may be associated with valproate or other histone deacetylase inhibitors that may induce the activity of a brain demethylase and thereby decrease the untoward effects caused by DNMT1 induction (Costa et al., 2003 a,b, Detich et al., 2003, Tremolizzo et al., 2005, Mitchell et al., 2005, Simonini et al., 2006).
Induction of a brain DNA demethylase may be facilitated by valproate (Detich et al., 2003), hence an issue that requires attention is the understanding of pharmacological protocols capable of inducing brain demethylase to detect whether the efficacy of the presently unsatisfactory armamentarium for the treatment of psychosis can be improved.
Footnotes
This work was supported un part by National Institute of Mental Health Grants RO1MH71667 (to E.C.) and RO1MH70855 (to A.G.).
Publisher's Disclaimer: This is a PDF file of an unedited manuscript that has been accepted for publication. As a service to our customers we are providing this early version of the manuscript. The manuscript will undergo copyediting, typesetting, and review of the resulting proof before it is published in its final citable form. Please note that during the production process errors may be discovered which could affect the content, and all legal disclaimers that apply to the journal pertain.
Contributor Information
Marin Veldic, Email: mveldic@psych.uic.edu.
Bashkim Kadriu, Email: bkadriu@psych.uic.edu.
Ekrem Maloku, Email: emaloku@psych.uic.edu.
Roberto C. Agis-Balboa, Email: rcarlos@psych.uic.edu.
Alessandro Guidotti, Email: aguidotti@psych.uic.edu.
John M. Davis, Email: jdavis@psych.uic.edu.
Erminio Costa, Email: costa@psych.uic.edu.
References
- Abdolmaleky HM, Cheng KH, Russo A, Smith CL, Faraone SV, Wilcox M, Shafa R, Glatt SJ, Nguyen G, Ponte JF, Thiagalingam S, Tsuang MT. Hypermethylation of the reelin (RELN) promoter in the brain of schizophrenic patients: a preliminary report. Am J Med Genet B Neuropsychiatr Genet. 2005;134 (1):60–66. doi: 10.1002/ajmg.b.30140. [DOI] [PubMed] [Google Scholar]
- Akbarian S, Kim JJ, Potkin SG, Hagman JO, Tafazzoli A, Bunney WE, Jr, Jones EG. Gene expression for glutamic acid decarboxylase is reduced without loss of neurons in prefrontal cortex of schizophrenics. Arch Gen Psychiatry. 1995;52 (4):258–266. doi: 10.1001/archpsyc.1995.03950160008002. [DOI] [PubMed] [Google Scholar]
- Aleman A, Kahn RS. Strange feelings: Do amygdala abnormalities dysregulate the emotional brain in schizophrenia? Prog Neurobiol. 2005;77 (5):283–298. doi: 10.1016/j.pneurobio.2005.11.005. [DOI] [PubMed] [Google Scholar]
- American Psychiatric Association. Diagnostic and Statistical Manual of Mental Disorders. 4. American Psychiatric Association; Washington, DC: 1994. [Google Scholar]
- Barbas H, De Olmos J. Projections from the amygdala to basoventral and mediodorsal prefrontal regions in the rhesus monkey. J Comp Neurol. 1990;300 (4):549–571. doi: 10.1002/cne.903000409. [DOI] [PubMed] [Google Scholar]
- Beffert U, Weeber EJ, Durudas A, Qiu S, Masiulis I, Sweatt JD, Li WP, Adelmann G, Frotscher M, Hammer RE, Herz J. Modulation of synaptic plasticity and memory by Reelin involves differential splicing of the lipoprotein receptor Apoer2. Neuron. 2005;47 (4):567–79. doi: 10.1016/j.neuron.2005.07.007. [DOI] [PubMed] [Google Scholar]
- Benes FM, Vincent SL, Alsterberg G, Bird ED, SanGiovanni JP. Increased GABAA receptor binding in superficial layers of cingulate cortex in schizophrenics. J Neurosci. 1992;12 (3):924–9. doi: 10.1523/JNEUROSCI.12-03-00924.1992. [DOI] [PMC free article] [PubMed] [Google Scholar]
- Benes FM, Berretta S. GABAergic interneurons: implications for understanding schizophrenia and bipolar disorder. Neuropsychopharmacology. 2001;25 (1):1–27. doi: 10.1016/S0893-133X(01)00225-1. [DOI] [PubMed] [Google Scholar]
- Benes FM, Matzilevich D, Burke RE, Walsh J. The expression of proapoptosis genes is increased in bipolar disorder, but not in schizophrenia. Mol Psychiatry. 2006;11 (3):241–51. doi: 10.1038/sj.mp.4001758. [DOI] [PubMed] [Google Scholar]
- Brueckner B, Lyko F. DNA methyltransferase inhibitors: old and new drugs for an epigenetic cancer therapy. Trends Pharmacol Sci. 2004;25 (11):551–554. doi: 10.1016/j.tips.2004.09.004. [DOI] [PubMed] [Google Scholar]
- Carboni G, Tueting P, Tremolizzo L, Sugaya I, Davis J, Costa E, Guidotti A. Enhanced dizocilpine efficacy in heterozygous reeler mice relates to GABA turnover downregulation. Neuropharmacology. 2004;46 (8):1070–1081. doi: 10.1016/j.neuropharm.2004.02.001. [DOI] [PubMed] [Google Scholar]
- Chen Y, Sharma RP, Costa RH, Costa E, Grayson DR. On the epigenetic regulation of the human reelin promoter. Nucleic Acid Res. 2002;30 (13):2930–2939. doi: 10.1093/nar/gkf401. [DOI] [PMC free article] [PubMed] [Google Scholar]
- Costa E, Davis J, Grayson DR, Guidotti A, Pappas GD, Pesold C. Dendritic spine hypoplasticity and downregulation of reelin and GABAergic tone in schizophrenia vulnerability. Neurobiol Dis. 2001;8 (5):723–742. doi: 10.1006/nbdi.2001.0436. [DOI] [PubMed] [Google Scholar]
- Costa E, Chen Y, Davis JM, Dong E, Noh JS, Tremolizzo L, Veldic M, Grayson DR, Guidotti A. Reelin and schizophrenia: a disease at the interface of the genome and the epigenome. Mol Int. 2002;2 (1):47–57. doi: 10.1124/mi.2.1.47. [DOI] [PubMed] [Google Scholar]
- Costa E, Grayson DR, Guidotti A. Epigenetic downregulation of GABAergic function in schizophrenia: potential for pharmacological intervention? Mol Int. 2003;3(4):220–229. doi: 10.1124/mi.3.4.220. [DOI] [PubMed] [Google Scholar]
- Costa E, Grayson DR, Mitchell CP, Tremolizzo L, Veldic M, Guidotti A. GABAergic cortical neuron chromatin as a putative target to treat schizophrenia vulnerability. Crit Rev Neurobiol. 2003;15 (2):121–142. doi: 10.1615/critrevneurobiol.v15.i2.20. [DOI] [PubMed] [Google Scholar]
- Detich N, Bovenzi V, Szyf M. Valproate induces replication-independent active DNA demethylation. J Biol Chem. 2003;278 (30):27586–27592. doi: 10.1074/jbc.M303740200. [DOI] [PubMed] [Google Scholar]
- Dong E, Caruncho H, Liu WS, Smalheiser NR, Grayson DR, Costa E, Guidotti A. A reelin-integrin interaction regulates Arc mRNA translation in synaptoneurosomes. Proc Natl Acad Sci USA. 2003;100 (9):5479–5484. doi: 10.1073/pnas.1031602100. [DOI] [PMC free article] [PubMed] [Google Scholar]
- Dong E, Agis-Balboa RC, Simonini MV, Grayson DR, Costa E, Guidotti A. Reelin and glutamic acid decarboxylase67 promoter remodeling in an epigenetic methionine-induced mouse model of schizophrenia. Proc Natl Acad Sci USA. 2005;102 (35):12578–12583. doi: 10.1073/pnas.0505394102. [DOI] [PMC free article] [PubMed] [Google Scholar]
- Eastwood SL, Harrison PJ. Interstitial white matter neurons express less reelin and are abnormally distributed in schizophrenia: towards an integration of molecular and morphologic aspects of the neurodevelopmental hypothesis. Mol Psychiatry. 2003;8(9):769, 821–831. doi: 10.1038/sj.mp.4001399. [DOI] [PubMed] [Google Scholar]
- Fatemi SH, Earle JA, McMenomy T. Reduction in Reelin immunoreactivity in hippocampus of subjects with schizophrenia, bipolar disorder and major depression. Mol Psychiatry. 2000;5(6):654–663. 571. doi: 10.1038/sj.mp.4000783. [DOI] [PubMed] [Google Scholar]
- Feighner JP, Robins E, Guze SB, Woodruff RA, Jr, Winokur G, Munoz R. Diagnostic criteria for use in psychiatric research. Arch Gen Psychiatry. 1972;26 (1):57–63. doi: 10.1001/archpsyc.1972.01750190059011. [DOI] [PubMed] [Google Scholar]
- Gabbott PL, Somogyi P. Quantitative distribution of GABA-immunoreactive neurons in the visual cortex (area 17) of the cat. Exp Brain Res. 1986;61 (2):323–331. doi: 10.1007/BF00239522. [DOI] [PubMed] [Google Scholar]
- Grayson DR, Jia X, Chen Y, Sharma RP, Mitchell CP, Guidotti A, Costa E. Reelin promoter hypermethylation in schizophrenia. Proc Natl Acad Sci USA. 2005;102 (26):9341–9346. doi: 10.1073/pnas.0503736102. [DOI] [PMC free article] [PubMed] [Google Scholar]
- Grayson DR, Chen Y, Costa E, Dong E, Guidotti A, Kundakovic M, Sharma RP. The human reelin gene: transcription factors (+), repressors (−) and the methylation switch (+/−) in schizophrenia. Pharmacol Ther. 2006;111 (1):272–86. doi: 10.1016/j.pharmthera.2005.01.007. [DOI] [PubMed] [Google Scholar]
- Guidotti A, Auta J, Davis JM, Di-Giorgi-Gerevini V, Dwivedi Y, Grayson DR, Impagnatiello F, Pandey G, Pesold C, Sharma R, Uzunov D, Costa E. Decrease in reelin and glutamic acid decarboxylase67 (GAD67) expression in schizophrenia and bipolar disorder: a postmortem brain study. Arch Gen Psychiatry. 2000;57 (11):1061–1069. doi: 10.1001/archpsyc.57.11.1061. [DOI] [PubMed] [Google Scholar]
- Guidotti A, Auta J, Davis JM, Dong E, Grayson DR, Veldic M, Zhang X, Costa E. GABAergic dysfunction in schizophrenia: new treatment strategies on the horizon. Psychopharmacology (Berl) 2005;180 (2):191–205. doi: 10.1007/s00213-005-2212-8. [DOI] [PubMed] [Google Scholar]
- Hanada S, Mita T, Nishino N, Tanaka C. [3H]muscimol binding sites increased in autopsied brains of chronic schizophrenics. Life Sci. 1987;40 (3):259–266. doi: 10.1016/0024-3205(87)90341-9. [DOI] [PubMed] [Google Scholar]
- Hong EJ, West AE, Greenberg ME. Transcriptional control of cognitive development. Curr Opin Neurobiol. 2005;15 (1):21–28. doi: 10.1016/j.conb.2005.01.002. [DOI] [PubMed] [Google Scholar]
- Impagnatiello F, Guidotti AR, Pesold C, Dwivedi Y, Caruncho H, Pisu MG, Uzunov DP, Smalheiser NR, Davis JM, Pandey GN, Pappas GD, Tueting P, Sharma RP, Costa E. A decrease of reelin expression as a putative vulnerability factor in schizophrenia. Proc Natl Acad Sci USA. 1998;95 (26):15718–15723. doi: 10.1073/pnas.95.26.15718. [DOI] [PMC free article] [PubMed] [Google Scholar]
- Jenuwein T, Allis CD. Translating the histone code. Science. 2001;293 (5532):1074–1080. doi: 10.1126/science.1063127. [DOI] [PubMed] [Google Scholar]
- Kemp JM, Powell TP. The cortico-striate projection in the monkey. Brain. 1970;93 (3):525–546. doi: 10.1093/brain/93.3.525. [DOI] [PubMed] [Google Scholar]
- Kunzle H. Bilateral projections from precentral motor cortex to the putamen and other parts of the basal ganglia. An autoradiographic study in Macaca fascicularis. Brain Res. 1975;88 (2):195–209. doi: 10.1016/0006-8993(75)90384-4. [DOI] [PubMed] [Google Scholar]
- Larson J, Hoffman JS, Guidotti A, Costa E. Olfactory discrimination learning deficit in heterozygous reeler mice. Brain Res. 2003;971 (1):40–46. doi: 10.1016/s0006-8993(03)02353-9. [DOI] [PubMed] [Google Scholar]
- Lewis DA, Hashimoto T, Volk DW. Cortical inhibitory neurons and schizophrenia. Nat Rev Neurosci. 2005;6 (4):312–324. doi: 10.1038/nrn1648. [DOI] [PubMed] [Google Scholar]
- Liu WS, Pesold C, Rodriguez MA, Carboni G, Auta J, Lacor P, Larson J, Condie BG, Guidotti A, Costa E. Downregulation of dendritic spine and glutamic acid decarboxylase67 expressions in reelin haploinsufficient heterozygous reeler mouse. Proc Natl Acad Sci USA. 2001;98 (6):3477–3482. doi: 10.1073/pnas.051614698. [DOI] [PMC free article] [PubMed] [Google Scholar]
- Mitchell CP, Chen Y, Kundakovic M, Costa E, Grayson DR. Histone deacetylase inhibitors decrease reelin promoter methylation in vitro. J Neurochem. 2005;93 (2):483–492. doi: 10.1111/j.1471-4159.2005.03040.x. [DOI] [PubMed] [Google Scholar]
- Noh JS, Sharma R, Veldic M, Salvacion AA, Jia X, Chen Y, Costa E, Guidotti A, Grayson DR. DNA methyltransferase 1 regulates reelin mRNA expression in mouse primary cortical cultures. Proc Natl Acad Sci USA. 2005;102 (5):1749–1754. doi: 10.1073/pnas.0409648102. [DOI] [PMC free article] [PubMed] [Google Scholar]
- Parent A, Hazrati LN. Functional anatomy of the basal ganglia. I The cortico-basal ganglia thalamo-cortical loop. Brain Res Brain Res Rev. 1995;20 (1):91–127. doi: 10.1016/0165-0173(94)00007-c. [DOI] [PubMed] [Google Scholar]
- Popken GJ, Bunney WE, Jr, Potkin SG, Jones EG. Subnucleus-specific loss of neurons in medial thalamus of schizophrenics. Proc Natl Acad Sci USA. 2000;97 (16):9276–9280. doi: 10.1073/pnas.150243397. [DOI] [PMC free article] [PubMed] [Google Scholar]
- Qiu S, Korwek KM, Pratt-Davis AR, Peters M, Bergman MY, Weeber EJ. Cognitive disruption and altered hippocampus synaptic function in Reelin haploinsufficient mice. Neurobiol Learn Mem. 2006;85 (3):228–42. doi: 10.1016/j.nlm.2005.11.001. [DOI] [PubMed] [Google Scholar]
- Rajkowska G, Goldman-Rakic PS. Cytoarchitectonic definition of prefrontal areas in the normal human cortex: I Remapping of areas 9 and 46 using quantitative criteria. Cereb Cortex. 1995;5 (4):307–332. doi: 10.1093/cercor/5.4.307. [DOI] [PubMed] [Google Scholar]
- Robertson AK, Geiman TM, Sankpal UT, Hager GL, Robertson KD. Effects of chromatin structure on the enzymatic and DNA binding functions of DNA methyltransferases DNMT1 and Dnmt3a in vitro. Biochem Biophys Res Commun. 2004;322 (1):110–118. doi: 10.1016/j.bbrc.2004.07.083. [DOI] [PubMed] [Google Scholar]
- Rodriguez MA, Caruncho HJ, Costa E, Pesold C, Liu WS, Guidotti A. In Patas monkey, glutamic acid decarboxylase-67 and reelin mRNA coexpression varies in a manner dependent on layers and cortical areas. J Comp Neurol. 2002;451 (3):279–288. doi: 10.1002/cne.10341. [DOI] [PubMed] [Google Scholar]
- Rotaru DC, Barrionuevo G, Sesack SR. Mediodorsal thalamic afferents to layer III of the rat prefrontal cortex: synaptic relationships to subclasses of interneurons. J Comp Neurol. 2005;490 (3):220–238. doi: 10.1002/cne.20661. [DOI] [PubMed] [Google Scholar]
- Ruzicka WB, Zhubi A, Veldic M, Grayson DR, Costa E, Guidotti A. Selective epigenetic alteration of layer I GABAergic neurons isolated from prefrontal cortex of schizophrenia patients using laser-assisted microdissection. Mol Psychiatry in press. 2006 doi: 10.1038/sj.mp.4001954. [DOI] [PubMed] [Google Scholar]
- Selemon LD, Goldman-Rakic PS. Longitudinal topography and interdigitation of corticospinal projections in the rhesus monkey. J Neurosci. 1985;5 (3):776–794. doi: 10.1523/JNEUROSCI.05-03-00776.1985. [DOI] [PMC free article] [PubMed] [Google Scholar]
- Simonini MV, Camargo LM, Dong E, Maloku E, Veldic M, Costa E, Guidotti A. The benzamide MS-275 is a potent long-lasting brain region-selective inhibitor of histone deacetylases. Proc Natl Acad Sci USA. 2006;103 (5):1587–1592. doi: 10.1073/pnas.0510341103. [DOI] [PMC free article] [PubMed] [Google Scholar]
- Tekin S, Cummings JL. Frontal-subcortical neuronal circuits and clinical neuropsychiatry: an update. J Psychosom Res. 2002;53(2):647–654. doi: 10.1016/s0022-3999(02)00428-2. [DOI] [PubMed] [Google Scholar]
- Tisch S, Silberstein P, Limousin-Dowsey P, Jahanshahi M. The basal ganglia: anatomy physiology and pharmacology. Psychiatr Clin North Am. 2004;27 (4):757–799. doi: 10.1016/j.psc.2004.06.004. [DOI] [PubMed] [Google Scholar]
- Tremolizzo L, Carboni G, Ruzicka WB, Mitchell CP, Sugaya I, Tueting P, Sharma R, Grayson DR, Costa E, Guidotti A. An epigenetic mouse model for molecular and behavioral neuropathologies related to schizophrenia vulnerability. Proc Natl Acad Sci U S A. 2002;99 (26):17095–100. doi: 10.1073/pnas.262658999. [DOI] [PMC free article] [PubMed] [Google Scholar]
- Tremolizzo L, Doueiri MS, Dong E, Grayson DR, Davis J, Pinna G, Tueting P, Rodriguez-Menendez V, Costa E, Guidotti A. Valproate corrects the schizophrenia-like epigenetic behavioral modifications induced by methionine in mice. Biol Psychiatry. 2005;57 (5):500–509. doi: 10.1016/j.biopsych.2004.11.046. [DOI] [PubMed] [Google Scholar]
- Veldic M, Caruncho HJ, Liu WS, Davis J, Satta R, Grayson DR, Guidotti A, Costa E. DNA methyltransferase 1 is selectively overexpressed in telencephalic GABAergic interneurons of schizophrenia brains. Proc Natl Acad Sci USA. 2004;101 (1):348–353. doi: 10.1073/pnas.2637013100. [DOI] [PMC free article] [PubMed] [Google Scholar]
- Veldic M, Guidotti A, Maloku E, Davis JM, Costa E. In psychosis, cortical interneurons overexpress DNA-methyltransferase 1. Proc Natl Acad Sci USA. 2005;102 (6):2152–2157. doi: 10.1073/pnas.0409665102. [DOI] [PMC free article] [PubMed] [Google Scholar]
- Volk DW, Austin MC, Pierri JN, Sampson AR, Lewis DA. Decreased glutamic acid decarboxylase67 messenger RNA expression in a subset of prefrontal cortical gamma-aminobutyric acid neurons in subjects with schizophrenia. Arch Gen Psychiatry. 2000;57 (3):237–245. doi: 10.1001/archpsyc.57.3.237. [DOI] [PubMed] [Google Scholar]
- Woo TU, Walsh JP, Benes FM. Density of glutamic acid decarboxylase 67 messenger RNA-containing neurons that express the N-methyl-D-aspartate receptor subunit NR2A in the anterior cingulate cortex in schizophrenia and bipolar disorder. Arch Gen Psychiatry. 2004;61 (7):649–657. doi: 10.1001/archpsyc.61.7.649. [DOI] [PubMed] [Google Scholar]