

Abstract
In an effort to understand the role of IL-6/gp130 signaling in chronic liver injury, IL-6 deficient (IL-6−/−) and wild-type control (IL-6+/+) mice were subjected to bile duct ligation (BDL) for 12 weeks. This maneuver causes chronic biomechanical stress and liver injury, fueling sustained biliary epithelial and hepatocyte proliferation. By 12 weeks after BDL, IL-6−/− mice develop significantly higher total serum bilirubin levels (23.2 ± 2.3 versus 14.9 ± 2.1 mg/dl, P < 0.0001; delta bilirubin subfraction 16.7 ± 4.0% versus 9.2 ± 1.8%; P < 0.002), and the majority (15/18) show “black” gallbladder bile, compared to IL-6+/+ mice (5/16; P < 0.003). The IL-6−/− mice also cannot sustain the compensatory liver mass increase commonly seen with chronic obstructive cholangiopathy, because of less hepatocyte proliferation, despite a rate of hepatocyte apoptosis similar to that of IL-6+/+ mice. Moreover, IL-6−/− mice show a more advanced stage of biliary fibrosis and a higher mortality rate than the IL-6+/+ controls (51% versus 23%; P < 0.02). These phenotypic changes in the IL-6−/− mice are associated with decreased expression and phosphorylation of gp130 and the transcription factor STAT3, compared to IL-6+/+ mice. Daily treatment with exogenous recombinant IL-6 for 3–6 weeks starting at 6 weeks after BDL significantly lowers the serum total bilirubin in both groups. In the IL-6−/− mice, exogenous IL-6 treatment also increases the level of gp130 protein expression and completely reverses the loss of liver mass by increasing the hepatocyte proliferation. In conclusion, IL-6 appears to contribute to biliary tree integrity and maintenance of hepatocyte mass during chronic injury.
Interleukin-6 (IL-6)/gp-130 signaling is involved acutely in hepatocyte1,2 and biliary epithelial cell (BEC) growth control and pathobiology. For example, liver regeneration after partial hepatectomy (PH) is delayed in IL-6−/− mice,1,2 whereas IL-6/sIL-6R double transgenic mice develop hepatocellular hyperplasia and adenomas.3 Although data on the in vitro effects of IL-6 on hepatocyte proliferation are conflicting,4,5 there are at least two mechanisms by which IL-6/gp-130 promotes BEC growth in vitro. IL-6 is able to directly stimulate BEC DNA synthesis6 and inhibit apoptosis, via an increase of the bcl-2/bax ratio.7 When stimulated by other proinflammatory cytokines or phorbol esters, nonneoplastic BEC can also produce and secrete IL-6, which can then act as an autocrine growth factor under conditions of BEC stress.6,8,9
Serum and liver IL-6 levels are also elevated in patients with chronic inflammatory liver diseases.10-13 In this setting, IL-6 has traditionally been considered to exert a profibrogenic and mitoinhibitory influence on the development of cirrhosis.10,14-17 However, in other “chronic inflammatory proliferative disorders,” such as psoriasis and rheumatoid arthritis, IL-6 has been linked with keratinocyte and synovial cell proliferation, respectively.18 In addition, recent studies have shown that gp130 signaling is critical to the maintenance of cardiac myocyte mass during hypertrophic compensation for the biomechanical stress of aortic banding.19
Obstructive cholangiopathy is associated with biomechanical stress of the biliary tree and an increased expression of the IL-6/gp80/gp130 receptor-ligand signaling system.20,21 We therefore tested the hypothesis that the absence of IL-6 would lead to phenotypic alterations in the response to long-term bile duct ligation (BDL). This was accomplished by subjecting homozygous IL-6−/− mice and wild-type IL-6+/+ (littermate) controls to long-term BDL for 12 weeks. These studies show that despite an identical insult, by 12 weeks after BDL the IL-6−/− mice developed a more advanced stage of biliary fibrosis; significantly higher serum bilirubin levels and a higher percentage of IL-6−/− mice subsequently decompensate and die compared to IL-6+/+ controls. The more rapid deterioration in the IL-6−/− mice can be related to decreased gp130-STAT3 signaling, impaired integrity of the excretory/barrier function of the hepatocyte-biliary tree, and decreased hepatocyte proliferation, which can be reversed by exogenous IL-6 therapy.
Materials and Methods
Animals, Operative Procedures, and Treatment
Ten- to 14-week-old male homozygous IL-6−/− mice and littermate IL-6+/+ controls were used in these experiments. The IL-6−/− mice were constructed as described by Poli et al.22 Under methoxyflurane anesthesia, all animals were aseptically subjected to ligation of the common bile duct or to a sham operation, as previously described.20
Animals were sacrificed at 0, 1, 3, 6, and 12 weeks after BDL (n = 10 in each group at each time point) and at 12 weeks after a sham operation (n = 5 in each group). The total body weight (BW) of randomly selected mice, which were sacrificed at 12 weeks after BDL (n = 10 in each group) or a sham operation (n = 5 in each group), were recorded at each time point. The postoperative BW was compared to preoperative BW, and the ratio was expressed as a percentage. At the time of sacrifice, blood and tissues were collected for determination of liver injury tests, routine histopathological analysis, organ weights, bromodeoxyuridine (BrdU) labeling indexes, morphometry, and mRNA and protein analysis. A second experiment, to determine the effect of BDL on survival, included IL-6+/+ (n = 30) and IL-6−/− mice (n = 45) that were followed for 12 weeks after BDL.
Last, an experiment was conducted to determine the effect of replacement therapy with exogenous IL-6. Both IL-6+/+ and IL-6−/− mice were treated via subcutaneous injection with either IL-6 mutein (ImClone System, Somerville, NJ), a modified version of recombinant human (rh)IL-6 protein,23 or with normal saline as a control (n = 10 in each group). Daily treatment was started at 6 weeks after BDL and continued for 3 or 6 weeks, at a dose of 1 μg/g BW/day in a 0.04% solution of pyrogen-free normal saline.
Serum Alanine Aminotransferase, Total Serum and Bile Bilirubin, and Bilirubin Fractions
Blood for sera was collected from normal or BDL mice at the time of sacrifice and stored at −70°C before testing. For animals treated with exogenous rhIL-6 or saline, blood was collected from the retro-orbital space before treatment and from the heart at the time of sacrifice after treatment. Serum alanine aminotransferase (ALT), serum and bile total bilirubin (TB) levels, and serum bilirubin fractions were measured (n = 6 in each group at each time point) using the Vitros 950IRC (Ortho Clinical Diagnosis, Rochester, NY).
Bile Color
Bile was collected from the expanded biliary tract at 12 weeks after BDL and stored at −70°C before testing. The color of the bile was classified as “white-yellow” or “dark green,” based on its gross appearance. This assessment was done without knowledge of whether the bile was obtained from an IL-6−/− or an IL-6+/+ mouse.
Analysis of Hepatocyte and Biliary Epithelial Cell DNA Synthesis
One hour before sacrifice the five mice from each group at 6 weeks and 12 weeks after BDL, and after treatment with exogenous IL-6 or saline, were given an intravenous injection of 50 μg/g BW BrdU.1 The labeled cells were localized with an anti-BrdU monoclonal antibody (Amersham Life Science, Cleveland, OH), using routine indirect immunoperoxidase staining. For determination of hepatocyte DNA synthesis, the total number of BrdU+ hepatocyte nuclei were counted in 20 randomly selected high-power fields (×400), which contains approximately 2000 total hepatocytes. For determination of BEC proliferation, the bile ducts were separated according to size, based on the number of BEC around the circumference of the duct (small ≤ 20; 20 < medium ≤ 200; and large > 200). Tangentially sectioned bile ducts in which one cross-sectional diameter was greater than three times another diameter, were excluded from analysis. The number of BrdU+ BEC/total number of BEC was recorded for each duct in a section, and the average percentage of BrdU+ BEC for each size of bile duct was calculated. All counts were done without knowledge of whether the liver section was taken from an IL-6−/− or an IL-6+/+ mouse.
Apoptosis Assay
The level of hepatocyte and biliary epithelial cell apoptosis was determined using the Apop Tag Peroxidase in Situ Apoptosis (TUNEL) Detection Kit (Intergen, Purchase, NY). The sections were taken from the same formalin-fixed paraffin-embedded tissue blocks used for the BrdU staining from IL-6+/+ mice and IL-6−/− mice at 6 and 12 weeks after BDL. The total number of TUNEL+ apoptotic bodies/hepatocytes were counted in 50 random, oil immersion fields (×1000) within the lobules, which contains approximately 1000 hepatocytes. Portal tracts were not included in the count of apoptotic hepatocytes. BEC apoptosis was assayed by counting the number of TUNEL+ cells in 50 small and medium-sized ductal profiles. Only clearly identified small and medium-sized bile ducts, cut in cross section, containing a recognizable lumen and included within the portal connective tissue, were included in the analysis. Tangentially sectioned ducts (ie, one diameter > 3 × another diameter), ducts without a lumen, cholangioles at the edge of the limiting plates, and large perihilar ducts were excluded. All counts were done without knowledge of whether the liver section was taken from an IL-6−/− or an IL-6+/+ mouse.
Staging of Biliary Fibrosis, Quantitative Morphometric Analysis of the Liver Architecture, and Liver Collagen Content
Staging of the biliary fibrosis was independently conducted by two of the authors (TE and AJD), without knowledge of the mouse genotype, according to the method of Portmann.24 Briefly, stage I is changes mostly confined to the portal tracts with only mild portal expansion; in stage II portal tracts are expanded with disruption of the parenchymal limiting plates; stage III is formation of portal-to-portal fibrous septa; and IV is cirrhosis. At least three of the same separate liver lobes of all mice (n = 39) sacrificed at 12 weeks after BDL, or IL-6−/− mice sacrificed after 6 weeks of treatment (n = 10 in each group), were independently assigned staging scores, using either Masson’s trichrome or Van Gieson’s picric acid-acid fuschin-stained slides to identify the collagen. The two independently assigned staging scores, which were in agreement in more than 90% of mice, were averaged for the final stage.
Using three randomly selected mice from each group at 6 and 12 weeks after BDL, we determined the volume proportion of hepatocytes, mesenchymal cells, and BEC by a quantitative analysis of histological sections,25 using trichrome-stained slides. The area occupied by each component on the cut surface of the section was determined by a point sampling technique.25 Cells were counted in 60 randomly selected medium-power fields (×200), which contains approximately 2000 total cells. All counts were done without knowledge of whether the liver was from an IL-6−/− or an IL-6+/+ mouse. The cells were divided into three compartments: hepatocytes, BEC, and mesenchymal cells, which included stromal, endothelial, and Kupffer’s cells.
In addition to the staging and quantitative morphometry, liver collagen content before and at 12 weeks after BDL (n = 3 in each group at each time point) was estimated by measuring the hydroxyproline level in liver samples as previously described.26 Briefly, precisely weighed liver tissue samples (8–12 mg) were hydrolyzed in 150 μl of 6 N HCl containing 0.5% phenol at 110°C for 24 hours. The solution was dried under vacuum, and the residue was dissolved in 1.6 ml sodium citrate buffer (pH 3.15). The amount of hydroxyproline in 50 μl of solution was measured in a Beckman model 6300 amino acid analyzer. The amount of hydroxyproline was expressed as nmol/mg tissue.
RNA Extraction and mRNA Analyses
The extraction of total RNA from whole liver, using Trizol solution (GIBCO BRL, Gaithersburg, MD), and reverse transcription-polymerase chain reaction (RT-PCR) with a SuperScript Preamplification System (GIBCO BRL) were performed as previously described.20 The primers for IL-6 were 5′ ATG AAG TTC CTC TCT GCA AGA GAC T and 3′ CAC TAG GTT TGC CGA GTA GAT CTC. The primers for leukemia inhibitory factor (LIF) were 5′ GAA AAC GGC CTG CAT CTA AGG and 3′ GCC ATT GAG CTG TGC CAG TTG. The reaction protocol was as follows: 94°C for 1 minute, 57°C (IL-6) or 61°C (LIF) for 1 minute and 30 seconds, and 72°C for 2 minutes, 30 cycles for LIF and glyceraldehyde-3-phosphate dehydrogenase (GAPHD) and 35 cycles for IL-6 primers. PCR products were electrophoresed on an agarose gel and stained with ethidium bromide. The identities of the PCR products were confirmed by DNA sequencing.
Immunoprecipitation and Western Blot Analysis
Protein extraction and Western blotting were carried out as previously described,27 with minor modifications. Briefly, total or nuclear protein was extracted from homogenized whole liver, and aliquots were measured for protein concentration, using the Bio-Rad protein assay (Bio-Rad Laboratories, Hercules, CA). For immunoprecipitation, 400 μg of total protein was incubated with anti-IL-6Rα(gp80) (M-20; Santa Cruz Biotechnology, Santa Cruz, CA) or anti-gp130 (M-20; Santa Cruz Biotechnology) antibodies for 2 hours at 4°C and incubated with protein A/G PLUSE-Agarose (Santa Cruz Biotechnology) at 4°C overnight to precipitate antigen-antibody complexes. Samples and size markers (BioRad Laboratories) were then separated by sodium dodecyl sulfate-polyacrylamide gel electrophoresis (SDS-PAGE), using the 8% nongradient gel, after which the separated proteins were transferred to nitrocellulose membranes that were subsequently incubated with anti-IL-6Rα or anti-phosphotyrosine antibodies (Ab-2; Calbiochem, San Diego, CA). This was followed by incubation with the appropriate horseradish peroxidase-conjugated secondary antibody. For determination of the level of gp130 protein expression, the membrane that contained the gp130 immunoprecipitated protein and was probed by Western blotting for anti-phosphotyrosine was stripped and reprobed by Western blotting for gp130. For STAT3 and phospho-STAT3 Western blotting, 30 μg liver nuclear protein was separated on a 8% SDS-PAGE gel, blotted onto nitrocellulose membranes, and incubated with anti-STAT3 (C-20: Santa Cruz Biotechnology) or anti-phospho-STAT3 (Tyr705; New England Biolabs, Beverly, MA). Signals were detected using enhanced chemiluminescence reagents (NEN; Life Science Products, Boston, MA).
Statistical Analyses
The values shown for the various tests are the means ± SD. A comparison of the mean values between IL-6−/− and IL-6+/+ mice was carried out using Student’s t-test, except for the mortality, bile color, and histological staging scores for biliary fibrosis, which used the Kaplan-Meier survival analysis (Logrank), the χ2 test, or the Wilcoxon rank-sum test, respectively. A difference was considered statistically significant at a P value of <0.05.
Results
Morbidity, Liver Injury Tests, Mortality, and Bile Color
There was no significant difference in pre-BDL BW between IL-6−/− (30.1 ± 3.0 g) and IL-6+/+ mice (28.7 ± 3.1g). The insult of BDL resulted in an equivalent 15–20% loss of BW during the first 3 weeks after BDL in both groups (Figure 1a)▶ . Thereafter, the BW in both groups remained relatively stable at about 80% of the pre-BDL value for the duration of the study. In contrast, sham-operated mice from both groups experienced a gradual and equal weight gain of 10–15% by 12 weeks (Figure 1a)▶ .
Figure 1.

Measures of morbidity, liver injury, and function and mortality after bile duct ligation (BDL). a: BDL results in a 15–20% decrease in total body weight. The percentage of weight loss was the same in the IL-6+/+ and the IL-6−/− mice (□, IL-6−/− sham; ▪, IL-6+/+ sham; ○, IL-6−/− BDL; •, IL-6+/+ BDL). b: Serum alanine aminotransferase (ALT) levels indicate similar hepatocellular injury in the two groups of mice after BDL, except for 3 weeks (*P < 0.05), when ALT levels were higher in the IL-6−/− mice (○, IL-6−/−; •, IL-6+/+). c: Total serum bilirubin (TB) increased similarly in the two groups during the first 3 weeks after BDL. In the IL-6+/+ mice, the TB stabilized at values near 15 mg/dl for the duration of the study. In contrast, TB in the IL-6−/− mice continued to increase throughout the study (•, IL-6+/+; ○, IL-6−/−; *P < 0.004; **P < 0.0001). d: Although survival was similar for the first 7–8 weeks, after that time the IL-6−/− mice experienced an increased mortality (•, IL-6+/+ (n = 30); ○, IL-6−/− (n = 45); P < 0.02).
The pattern and absolute level of ALT elevations were very similar in the two groups during the entire 12-week period of observation (Figure 1b)▶ . During the first week, an equivalent and sharp increase in serum ALT levels, indicative of liver cell injury, was already evident in both groups when first measured at 16 hours and peaked at 48 hours,21 a finding similar to that of our previous study in C57BL/6 mice.20 At 3 weeks, serum ALT levels had decreased considerably in both groups but was higher in the IL-6−/− mice than in the IL-6+/+ mice (Figure 1b)▶ . Thereafter, the ALT levels were not significantly different, although the values in the IL-6−/− mice tended to be slightly higher.
TB similarly increased in both groups during the first 3 weeks after BDL (Figure 1c)▶ . Thereafter, the TB values reached a plateau value of 15.6 ± 3.9 mg/dl at 3 weeks in the IL-6+/+ mice and remained elevated at approximately the same level during the subsequent 9 weeks of follow-up (Figure 1c)▶ . In the IL-6+/+ mice, there was no significant difference in TB between 12 weeks and 1 or 3 weeks after BDL. In contrast, TB levels in the IL-6−/− mice continually increased, reaching a level of 23.2 ± 2.3 mg/dl by 12 weeks, and TB at 12 weeks was significantly higher than at 1 or 3 weeks (P < 0.001). By 6 weeks, the TB was significantly higher in the IL-6−/− mice compared to the IL-6+/+ mice (19.6 ± 2.0 versus 14.3 ± 2.7 mg/dl; P < 0.004); and by 12 weeks the difference became even greater (23.2 ± 2.3 versus 14.9 ± 2.1 mg/dl; P < 0.0001).
Delta bilirubin is a measure of conjugated bilirubin covalently bound to albumin28 and is 1) proportional to the length of time conjugated bilirubin is in contact with the blood and 2) increased when there is leakage of conjugated bile from an “obstructed” biliary tree into the blood.28 Both the absolute level of delta bilirubin (1.4 ± 0.3 versus 3.9 ± 1.2 mg/dl; P < 0.0007) and the ratio of delta bilirubin to total bilirubin (9.2 ± 1.8% versus 16.7 ± 4.0%; P < 0.002) were higher in the IL-6−/− mice at 12 weeks. This indicates that more conjugated bilirubin was in contact with blood for a longer period of time in the IL-6−/− mice, which, in conjunction with the gross appearance of the bile (below), is suggestive of impaired biliary tree integrity in this group.
The mortality rate during the 12-week follow-up period after BDL was 51% (23/45) in the IL-6−/− and 23% (7/30) in the IL-6+/+ (P < 0.02; Figure 1d▶ ). Most deaths in the IL-6−/− mice occurred more than 9 weeks after BDL. At autopsy and at the time of sacrifice at 12 weeks, the majority of both IL-6+/+ and IL-6−/− mice showed both liver and kidney fibrosis and inflammation, the latter of which is relatively common with chronic liver disease and obstructive cholangiopathy. However, the liver pathology was more advanced in the IL-6−/− mice (see below). It was difficult to determine an exact cause of death in either group of mice, but the mortality was most likely due to a combination of liver and kidney damage, combined with metabolic and other abnormalities associated with high serum bilirubin levels and obstructive cholangiopathy.
There was no difference in the gross appearance of the bile obtained from normal IL-6+/+ and IL-6−/− mice. However, at 12 weeks, the bile in the obstructed biliary tree of the majority of IL-6+/+ mice (n = 11/16) was a pale translucent white-yellow, or so-called white bile, commonly seen in chronic obstructive cholangiopathy (Figure 2)▶ .29 In contrast, dark green, heavily pigmented or so-called black bile29 was present in the majority of the IL-6−/− mice at 12 weeks (n = 15/18; P < 0.003) (Figure 2)▶ . The concentration of bilirubin in the white bile versus the black bile was 0.9 ± 0.5 versus 11.8 ± 5.1 mg/dl, respectively (n = 6 in each group).
Figure 2.

Gross appearance of bile in the distended biliary tracts. Note the presence of relatively clear or “white” bile in the IL-6+/+ mice (left), in contrast to the dark green or “black” bile in the distended gallbladder of IL-6−/− mice (right).
Sequential Changes in Liver Mass and Weight, Proliferative and Apoptotic Indexes, and Liver Morphology
Liver weight/body weight ratios(liver mass; Figure 3a▶ ) and absolute total liver weight (Figure 3b)▶ were higher in the normal IL-6−/− mice even before BDL (n = 10 in each group; 5.0 ± 0.4% versus 4.5 ± 0.4%; P < 0.02), as previously reported.2 Both the liver mass and total liver weight, significantly increased in both groups of mice, reaching a peak at the end of week 1 (Figure 3▶ , a and b). In the IL-6+/+ mice, the increased liver mass was sustained at a plateau value of about 7.5% for the duration of the study. In contrast, both the increased liver weight and mass in the IL-6−/− mice progressively declined, such that by week 12, both liver weight and mass were significantly lower in the IL-6−/− mice (6.5 ± 0.4% versus 7.5 ± 0.6%, P < 0.005, Figure 3a▶ ; and 1.56 ± 0.23 g versus 1.84 ± 0.26 g, P < 0.02, Figure 3b▶ ).
Figure 3.

Assessment of liver weight/body weight ratio (liver mass), actual liver weights, BrdU, and TUNEL+ labeling indexes after bile duct ligation (BDL). a: The initial increase in liver mass during the first week after BDL was independent of the IL-6 status, but the IL-6−/− mice were unable to sustain the increased liver mass during longer follow-up (•, IL-6+/+; ○, IL-6−/−; *P < 0.0005). b: Similar results were seen for the actual liver weights (*P < 0.02). c: BrdU labeling indexes showed fewer hepatocytes but more BEC labeling in the IL-6−/− mice at both 6 and 12 weeks after BDL, but the difference in BEC labeling was statistically significant only at 12 weeks (*P < 0.04; **P < 0.02; ***P < 0.0001; □, IL-6+/+; ▧, IL-6−/−). d: There was no significant difference between IL-6+/+ and IL-6−/− mice in the number of TUNEL+ cells/50 high power fields (HPFs) (1000×) at either 6 or 12 weeks after BDL (□, IL-6+/+; ▧, IL-6−/−).
The differences in liver mass between IL-6+/+ and IL-6−/− mice were reflected in the BrdU labeling and apoptotic indexes(Figure 3▶ , c and d) and in the volume proportions of various cell populations (Figure 4b)▶ . At 6 weeks, hepatocyte BrdU labeling was higher in the IL-6+/+ mice than in the IL-6−/− mice (0.66 ± 0.28% versus 0.21 ± 0.18%; P < 0.02) and by 12 weeks, the difference became even greater (1.10 ± 0.18% versus 0.35 ± 0.13%; P < 0.0001) (Figure 3c)▶ . Conversely, there was a trend toward increased small duct BEC BrdU labeling in the IL-6−/− mice at 6 weeks (3.17 ± 1.5% versus 2.46 ± 0.93%; P < 0.4), which became statistically significant by 12 weeks (2.77 ± 0.83% versus 1.78 ± 0.31%; P < 0.04) (Figure 3c)▶ . There were no differences in BrdU labeling in the medium and large ducts (data not shown).
Figure 4.
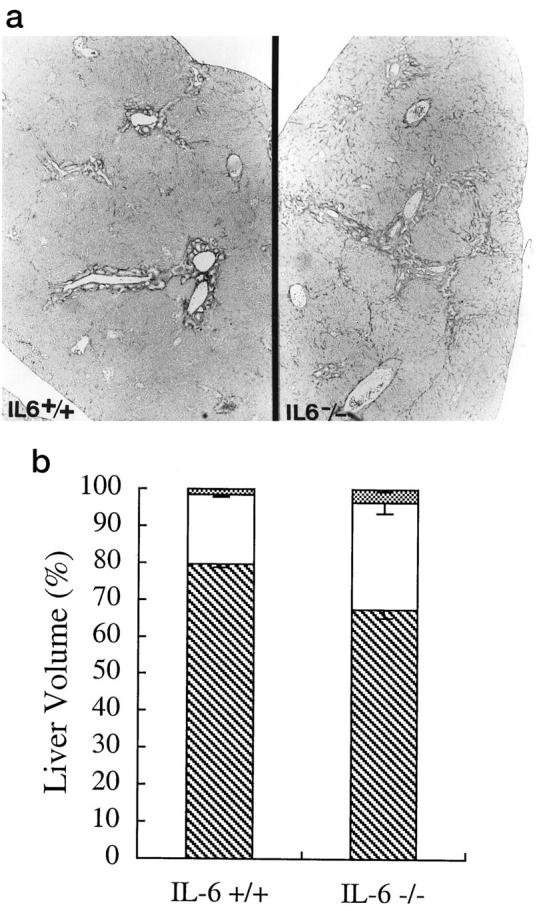
Assessment of liver architecture and cell composition of the liver after bile duct ligation. a: Routine histology, using Van Gieson’s picric acid-acid fuschin-stained slide at 12 weeks, showed that the IL-6−/− mice had progressed to stage III disease (right), with the formation of portal-to-portal bridging, whereas the IL-6+/+ mice showed mostly portal expansion, or stage II disease (left). b: Determination of the volume proportions of hepatocytes (▧), mesenchymal cells (□), and BEC (▩) showed that by 12 weeks, there was a greater percentage of mesenchymal (29.0 ± 2.9% versus 18.9 ± 0.7%; P < 0.005) and BEC (3.5 ± 0.6% versus 1.5 ± 0.2%; P < 0.006) in the IL-6−/− mice.
There was no significant difference between the IL-6+/+ and IL-6−/− mice in the number of TUNEL+ cells/50 high-power fields (HPFs) (×1000) at either 6 or 12 weeks after BDL (Figure 3d)▶ . At 6 weeks there was 11.6 ± 4.0 TUNEL+ cells/50 HPFs in the IL-6+/+ mice versus 9.3 ± 5.4/50 HPFs in the IL-6−/− mice at 6 weeks (P > 0.5). At 12 weeks, the IL-6+/+ mice showed 9.3 ± 6.1 versus 7.2 ± 2.6/50 HPFs in the IL-6−/− mice (P > 0.5). The number of apoptotic BEC was extremely low in both groups. At 6 weeks after BDL in the IL-6−/− mice there were 1.25 ± 1.64 TUNEL+ BEC/50 ductal profiles versus 1.2 ± 1.16 in the IL-6+/+ mice (P = 0.96). However, at 12 weeks after BDL there were 2.8 ± 1.94 TUNEL+ BEC/50 ductal profiles in the IL-6−/− mice versus 1.0 ± 0.82 in the IL-6+/+ mice (P = 0.09). There was no difference between IL-6+/+ and IL-6−/− mice in total caspase 3 activity in whole liver tissue, as measured by the CaspACE Assay System (Promega, Madison, WI) at either 6 or 12 weeks (data not shown). The apoptosis assay results are consistent with the serum ALT values (Figure 1b)▶ , which showed no difference between the IL-6+/+ and IL-6−/− mice at either 6 or 12 weeks.
Histopathologic staging of the biliary fibrosis (see Materials and Methods), using standard criteria,24 was conducted on all mice sacrificed at 12 weeks (n = 16 IL-6+/+ and n = 23 IL-6−/− mice) without knowledge of the genotype. Although there was variation within groups, the mean stage at 12 weeks after BDL in the IL-6+/+ mice was 1.75 ± 0.66 versus 2.45 ± 0.56 in the IL-6−/− mice (P < 0.02). A representative example of the difference in the histopathologic stage between the IL-6+/+ and IL-6−/− mice is shown in Figure 4a▶ .
Liver sections from three randomly selected mice from each group were then subjected to a quantitative morphometric analysis using a point counting method (see Materials and Methods). At 6 weeks after BDL, there were no significant differences in the volume proportion of hepatocytes, mesenchymal cells, and BEC between the IL-6+/+ and IL-6−/− mice (data not shown). By 12 weeks, however, hepatocytes accounted for 79.6 ± 0.8% of the total cells in the livers of IL-6+/+ mice (Figure 4b)▶ , but only 67.5 ± 2.3% of the total number of cells in the IL-6−/− mice (P < 0.001). Conversely, there were more mesenchymal cells (29.0 ± 2.9% versus 18.9 ± 0.7%; P < 0.005) and BEC (3.5 ± 0.6% versus 1.5 ± 0.2%; P < 0.006) in the IL-6−/− mice.
We next assayed the total collagen content of the livers, using total hydroxyproline/g liver. Hydroxyproline levels were under the detectable sensitivity (0.5 nmol/mg liver) in most normal mice before BDL in either group. By 12 weeks after BDL, there was an increase in hydroxyproline levels in both groups compared to normal mice. The IL-6−/− mice showed greater hydroxyproline levels (6.39 ± 1.73 nmol hydroxyproline/mg liver) than the IL-6+/+ mice (5.57 ± 1.03 nmol/mg liver), but the difference was not statistically significant.
Analysis of the Intrahepatic IL-6/gp130 Signaling System
IL-6 first forms a complex with either a membrane-bound or soluble cytokine-specific receptor, IL-6Rα (gp80), and this complex then binds to and induces homodimerization of the signal-transducing receptor, gp130.30 The gp130-associated kinases Jak1, Jak2, and Tyk2 phosphorylate the cytoplasmic tail of gp130, providing docking sites for STAT1 and STAT3, which also become phosphorylated, form dimers, and translocate to the nucleus, where they regulate transcription of target genes. After BDL there is persistent intrahepatic production of both IL-6 and LIF mRNA (Figure 5a)▶ at 12 weeks in the IL-6+/+ mice, compared to normal IL-6+/+ mice without BDL. LIF mRNA was also persistently expressed at 12 weeks in the IL-6−/− mice, but there was no IL-6 mRNA (Figure 5a)▶ , as expected.
Figure 5.

Analysis of the IL-6/gp130 signaling system before and after bile duct ligation (BDL). a: RT-PCR for IL-6 and LIF showed an increase in mRNA for both of these cytokines at 12 weeks after BDL (12W) in the IL-6+/+ mice, compared to normal mice (−) without BDL. The IL-6−/− mice also showed increased LIF compared to normals (−), but IL-6 mRNA was not detected, as expected. b: Immunoprecipitation (IP) followed by Western blotting (WB) showed no difference between IL-6−/− and IL-6+/+ mice in the level of IL-6Rα protein expression either before BDL(−) or 12 weeks after BDL(12W) (top row). The level of gp130 protein expression was similar between normal IL-6+/+ and IL-6−/− mice before BDL(−), but 12 weeks after BDL(12W) the IL-6+/+ clearly showed more gp130 protein expression (center row) and higher levels of gp130 phosphorylation (botttom row; PY, anti-phosphotyrosine) than the IL-6−/− mice. c: Nuclear STAT3 protein levels were slightly higher in normal IL-6+/+ mice before BDL. Nuclear phospho-STAT3 was weakly expressed in normal mice from both groups before BDL, although an occasional IL-6+/+ mouse showed slightly higher levels of expression. By 12 weeks after BDL, both groups of mice showed a small increase in nuclear STAT3 and a clear increase in nuclear phospho-STAT3. However, the level of expression of both STAT3 and phospho-STAT3 was greater in the IL-6+/+ mice. HeLa cells were used as a positive control for STAT3 and a negative control for phosph-STAT3. HeLa cells treated with interferon-α (IFN-α) were used as a positive control for STAT3 and phospho-STAT3.
Immunoprecipitation followed by Western blotting showed no difference in the level of IL-6Rα protein expression between the two groups in normal mice before BDL or 12 weeks after BDL (Figure 5b)▶ . Before BDL, the level of gp130 protein expression was also similar in normal IL-6+/+ and IL-6−/− mice. However, by 12 weeks after BDL, there was noticeably more total gp130 protein expression in the IL-6+/+ mice (Figure 5b)▶ , consistent with previous studies showing up-regulation of hepatic gp130 in vivo, after exogenous administration of IL-6.31 In addition, there is significantly more gp130 phosphorylation in the IL-6+/+ compared to the IL-6−/− mice at 12 weeks after BDL (Figure 5b)▶ .
There were also differences between the IL-6+/+ and IL-6−/− mice in gp130-related transcription factors. In normal mice before BDL, the level of STAT3 protein expression was slightly higher in the IL-6+/+ mice (Figure 5c)▶ , consistent with previous reports.1 Nuclear phospho-STAT3 was weakly and variably expressed in normal mice from both groups, although the levels tended to be higher in the IL-6+/+ mice (Figure 5c)▶ . Twelve weeks after BDL, there was a clear increase in both nuclear STAT3 and phospho-STAT3 in both groups of mice (Figure 5c)▶ , but the level of expression was uniformly greater in the IL-6+/+ than in the IL-6−/− mice. Thus, even though the IL-6−/− mice attempt to compensate for the absence of IL-6 by producing LIF and possibly other gp130 ligands, signaling via the gp130-STAT3 pathway is lower.30
Effect of Treatment with Exogenous IL-6
Before treatment with exogenous rhIL-6 or normal saline at 6 weeks, there was an equivalent low-level elevation of serum ALT in both the IL-6+/+ and the IL-6−/− mice (Figure 1b)▶ , but the TB was significantly higher in the IL-6−/− mice (Figures 1c and 6a)▶ ▶ . Starting at 6 weeks after BDL, daily treatment of mice from both groups for 3 weeks with exogenous rhIL-6 resulted in a dramatic and significant decrease in TB in the IL-6−/− mice from 20.8 ± 3.0 mg/dl to 11.9 ± 3.5 mg/dl (P < 0.0005) (Figure 6a)▶ . In addition, delta bilirubin in the IL-6−/− mice dramatically decreased from 3.9 ± 1.5 mg/dl to 0.7 ± 0.4 mg/dl (P < 0.002), and the ratio of delta bilirubin to total bilirubin decreased from 18.5 ± 5.2% to 5.7 ± 3.2% (P < 0.002) (Figure 6b)▶ . Interestingly, there was also a significant decrease in TB after treatment of the IL-6+/+ mice with exogenous rhIL-6 from 16.3 ± 1.6 mg/dl to 11.6 ± 3.0 mg/dl (P < 0.03; Figure 6a▶ ), but not in either treatment control group, given normal saline injections. Exogenous rhIL-6 treatment had no significant effect on ALT levels in either group (data not shown).
Figure 6.

Effect of exogenous rhIL-6 treatment. a: TB values at 6 weeks (pre-, □) and 9 weeks (post-, ▧) for both IL-6+/+ and IL-6−/− mice showed that treatment with rhIL-6 but not normal saline significantly lowered the serum TB levels in both the IL-6−/− mice and in the IL-6+/+ mice, although the decrease was more dramatic in the IL-6−/− mice (*P < 0.03; **P < 0.0005; n = 6 in each group). b: Treatment with exogenous rhIL-6 for 3 weeks also significantly lowered the ratio of delta bilirubin to total bilirubin in the IL-6−/− mice, indicative of increased biliary tree integrity and decreased exposure of conjugated bilirubin to the blood after therapy (see text). ▧, conjugated bilirubin; □, delta bilirubin; ▩, unconjugated bilirubin). c: Immunoprecipitation followed by Western blotting (IP/WB) showed that treatment with exogenous rhIL-6 for 6 weeks also increased the level of gp130 protein expression in the IL-6−/− mice after BDL, consistent with previous studies.31 d: Treatment with exogenous rhIL-6 for 6 weeks also increased the number of portal plasma cells in the IL-6−/− mice (inset), which were uncommonly detected in the IL-6−/− mice treated with normal saline.
Liver mass determination and hepatocyte BrdU labeling index measurements were conducted on both groups of mice after treatment for 3 and 6 weeks with exogenous rhIL-6 (Table 1)▶ . Treatment of IL-6−/− mice with exogenous IL-6 for 3 weeks slowed the decline in liver mass, but the difference between those treated with rhIL-6 and those given normal saline did not reach statistical significance (Table 1)▶ . Continued treatment of the IL-6−/− mice for 6 weeks completely reversed the liver mass decline and significantly increased hepatocyte BrdU labeling index (Table 1)▶ .
Table 1.
Liver/Body Weight Ratios (Liver/BW (%)) and Hepatocyte BrdU Labeling Indexes after Treatment with rhIL-6 for 3 Weeks in IL-6+/+ Mice, and for 3 and 6 weeks in IL-6−/− Mice
| IL-6+/+ (3 weeks) | IL-6−/− (3 weeks) | IL-6−/− (6 weeks) | ||||
|---|---|---|---|---|---|---|
| rhIL-6 | Saline | rhIL-6 | Saline | rhIL-6 | Saline | |
| Liver/BW (%) | 7.9 ± 0.6 | 7.8 ± 0.9 | 6.9 ± 0.7 | 6.5 ± 0.5 | 7.3 ± 0.7* | 6.3 ± 0.5 |
| BrdU+ hepatocyte (%) | 0.73 ± 0.49 | 0.77 ± 0.46 | 0.23 ± 0.07 | 0.26 ± 0.13 | 0.75 ± 0.35† | 0.26 ± 0.21 |
*P < 0.01 and
†P < 0.03 versus saline-treated IL-6−/− mice for 6 weeks.
Exogenous rhIL-6 therapy of IL-6−/− mice was also associated with an increased level of gp130 protein expression compared to saline-treated controls (Figure 6c)▶ , which is consistent with previous studies showing up-regulation of gp130 by exogenous IL-6.31 However, we did not detect a significant increase in either gp130 or STAT3 phosphorylation in the IL-6−/− mice after 6 weeks of treatment (data not shown). The inability to detect increased phosphorylation of the gp130 signaling pathway after IL-6 treatment of the IL-6−/− mice was attributed to a 24-hour delay between the last rhIL-6 dose and sacrifice of the mice. Direct inhibitors of gp130 and STAT3 phosphorylation, including protein inhibitor of activated STAT3(PIAS3) and suppressor of cytokine signaling (SOCS) proteins, ensure that phosphorylation of these molecules is only transient.30
Histopathologically, treatment with rhIL-6 for 3 or 6 weeks did not significantly change the stage of biliary fibrosis. The mean biliary fibrosis score in IL-6−/− mice treated for 6 weeks with exogenous rhIL-6 (2.38 ± 0.44) was less than the IL-6−/− mice treated with normal saline (2.55 ± 0.5), but the difference was not statistically significant (P > 0.05). However, there were noticeable biological effects of the rhIL-6 treatment that were not seen in the saline-treated controls. These included an increase in liver mass (Table 1)▶ , portal-based plasma cells (Figure 6d)▶ , and splenomegaly, and two of the mice also developed marked extramedullary hematopoiesis in the liver and the spleen, and a sharp increase in the hepatocyte BrdU labeling index. The latter two mice were excluded from the liver mass, BrdU labeling index, and biliary fibrosis staging analyses.
Discussion
Bile duct ligation is a convenient and well-studied experimental animal model of diseases that cause biliary cirrhosis,32 such as extrahepatic biliary atresia and primary sclerosing cholangitis, which eventually result in the need for liver transplantation.33 Development of cirrhosis in the BDL model and in human biliary diseases first proceeds through an acute epithelial mitogenic stage.34 It is characterized by brisk up-regulation of growth factors (eg, IL-6, HGF) that trigger an explosive expansion of the mature BEC,20,34-36 periductal myofibroblasts, and, to a lesser extent, hepatocytes.20,25,37 This results in marked liver enlargement, up to twice normal. A much longer chronic maintenance phase follows.34 It is characterized by maintenance of the enlarged liver mass, coincident with a shift to low-grade BEC and hepatocyte proliferation and an increase in profibrogenic (TGF-β1, FGF) and mitoinhibitory cytokines (TGF-β1, activin) and growth factors. During this phase, the portal tract is transformed into an expanding BEC/mesenchymal wedge that gradually remodels the liver architecture by linking adjacent portal tracts.34 Histopathological staging, as used in this study, chronicles the progression from mild portal expansion (stage I) to a well-developed biliary cirrhosis (stage IV).24,38
Mechanisms responsible for maintenance of liver mass during the chronic phase are poorly understood. Analysis of cellular population dynamics in livers with developing biliary cirrhosis show that over time, there is an increase in BEC and supporting stroma and a relative fall in the volume proportion of hepatocytes.25 However, an absolute decrease in hepatocytes does not occur39 or is less than anticipated, because chronic compensatory mechanisms ensure that hepatocytes continue to proliferate,40,41 and there is an overall increase in liver size.25,42 Results from this study are consistent with previous studies from our laboratory21 showing that despite brisk up-regulation of IL-6 within hours after BDL, the initial increase in liver mass during the first week is not IL-6-dependent. An increase in liver mass from the normal 4.5–5.0% to a maximum of 7.5–8.0% of total body weight occurred in both the IL-6+/+ and IL-6−/− mice. This amounts to almost a doubling of liver size that enables the animal or patient to remain relatively stable, or compensate for the insult, throughout the early stages and often into the later stages of the disease.
The ability to maintain the increased liver mass and compensated state was clearly IL-6-dependent. Total serum bilirubin continued to rise in the IL-6−/− mice and their enlarged livers gradually became smaller, in contrast to the IL-6+/+ mice, in which both the serum bilirubin and liver mass stabilized. This was associated in the IL-6−/− mice with lower expression and phosphorylation of the signal-transducing receptor, gp130, and the downstream transcription factor, STAT3, compared to the IL-6+/+ mice. Instability of the compensated state in the IL-6−/− mice after BDL is similar to a recent report of cardiac ventricle-restricted knockout of gp130 via Cre-loxP-mediated recombination.19 Aortic banding in these mice created a pressure overload, or biomechanical stress within the heart, which results in adaptive ventricular hypertrophy. In contrast to controls, the cardiac ventricle-gp130 knockouts could not sustain the compensated state; instead, they quickly developed cardiac dilatation and failure because of massive cardiac myocyte apoptosis.19 In this study, the IL-6−/− mice were also unable to sustain the compensatory hepatic hyperplasia associated with the biomechanical stress of BDL. However, failure to maintain the compensated state was due to lower hepatocyte proliferation and not an increased rate of apoptosis. This was confirmed by a comparison of hepatocyte BrdU and TUNEL labeling indexes (Figure 3▶ , c and d), total capase activity, and equivalent elevations of serum ALT (Figure 1b)▶ .
Because obstructive cholangiopathy and hyperbilirubinemia alone can inhibit hepatocyte mitosis after partial hepatectomy,43 an initial impression was that the progressive increase in TB in the IL-6−/− mice was the cause of impaired hepatocyte proliferation. This possibility was considered unlikely when exogenous rhIL-6 treatment for 3 weeks dramatically lowered the TB in the IL-6−/− mice, without causing an equally dramatic increase in the hepatocyte BrdU labeling index. Conversely, exogenous administration of hepatocyte growth factor (HGF) to the IL-6−/− mice was not able to lower the total serum bilirubin (data not shown).
Further studies are needed, however, to determine whether the lower hepatocyte proliferation in the IL-6−/− mice is a result of a direct mitogenic effect of IL-6 on hepatocytes via gp130-STAT3 signaling or an indirect effect through intermediaries. The ability of the IL-6/gp130 signaling system to directly stimulate hepatocyte proliferation in vivo appears to depend on the ratio of gp130 to soluble or membrane-bound IL-6Rα(gp80). In IL-6 single transgenic mice, no significant hepatic phenotype is observed, but IL-6/sIL-6R double transgenic mice show hepatocellular hyperplasia and adenomas.3 In this study, exogenous rhIL-6 treatment reversed the decline of increased liver mass by increasing the hepatocyte BrdU labeling index. Several of the IL-6−/− mice that received long-term rhIL-6 treatment also developed marked extramedullary hematopoiesis in the liver and the spleen and a very high hepatocyte BrdU labeling index, which is similar to the reaction of the experimental animals treated, IL-6/sIL-6R double transgenic mice.44 This finding suggests that the level of sIL-6R in these mice is an important regulator of IL-6 biological activity and might account for the delay between IL-6 therapy and BrdU labeling index and liver mass recovery. IL-6 might also regulate hepatocyte entry or progression through the cell cycle,1,2 possibly by influencing the levels of cyclin-dependent kinase inhibitors such as p21. Last, IL-6 might also indirectly influence hepatocyte proliferation via its ability to up-regulate hepatocyte growth via HGF/met expression.45-48
The IL-6−/− mice attempt to compensate for the lack of IL-6 after BDL with up-regulation of LIF, which is also a BEC mitogen, in vitro.21 As expected, preliminary data on the quantitative level of LIF mRNA production from a ribonuclease protection assay showed higher levels in the IL-6−/− mice at 12 weeks after BDL (data not shown). Despite the increase in LIF and possibly other gp130 ligands in the IL-6−/− mice after BDL, whole-liver gp130 protein expression, gp130 phosphorylation, and downstream signaling through nuclear phospho-STAT3 are lower than in the IL-6+/+ mice. This is at least partially explained by the ability of IL-6 to increase hepatic gp130 protein and gene expression, as seen in this and other studies.31,49 Furthermore, IL-6 signaling results in the formation of gp130 homodimers, whereas LIF results in gp130-LIFR heterodimers.18 Last, IL-6Rα(gp80) is expressed largely on hepatocytes,20 whereas the LIFR reportedly shows preferential expression on the BEC.50 Absence of IL-6 and compensation by LIF in the liver of IL-6−/− mice theoretically could direct more gp130-STAT3 signaling through the BEC instead of hepatocytes. This would favor transformation of the portal tract into an expanding BEC/mesenchymal wedge and subsequent architectural distortion. In any event, the more advanced biliary fibrosis seen in this study in association with decreased gp130-STAT3 signaling is consistent with a recent study of mice with selective hepatic gp130 knockout. These mice show a number of hepatocyte cytologic abnormalities, including a widening of the intercellular spaces, and a replacement of the liver tissue by fibrosis.51
An inability to detect increased phospho-gp130 and phospho-STAT3 after treatment of the IL-6−/− mice with exogenous rhIL-6 deserves comment. It was attributed to a 24-hour delay between administration of the last dose of IL-6 and sacrifice of the mice. Natural inhibitors of gp130 and STAT3 phosphorylation, such as PIAS3 and SOCS proteins,30 ensure that phosphorylation of this system is only transient. An additional difference is a bolus exogenous source of IL-6 in the IL-6-treated IL-6−/− mice versus a continuous intrahepatic IL-6 source in the IL-6+/+ mice.
The progressive increase in serum bilirubin in the IL-6−/− mice points toward an impaired barrier/excretory function of the hepatocyte-biliary tree axis. Several lines of evidence support this contention: the predominance of “white bile” in the obstructed biliary tree of IL-6+/+ mice and “black bile” in the IL-6−/− mice,29 higher serum TB and delta fraction in the IL-6−/− mice,28 and the ability of exogenous rhIL-6 to quickly lower the serum bilirubin in the IL-6−/− mice. Previous studies have shown that “white bile” is a result of total obstruction of an intact biliary tree. This significantly raises intralumenal pressure that causes back-flow of bile from the biliary tree to the liver, resorption of bile pigments and secretion of water by cholangiocytes, and subsequent inhibition of further hepatocyte bile production/secretion.29 “Black bile” on the other hand, is the result of continued low-level leakage or drainage of the “obstructed” biliary tree, via the gallbladder,29 or escape into periportal tissues and then into the portal lymphatics.38,52 This results in lower intralumenal pressures and, thus, continued bile production and a higher concentration of bilirubin in the bile, which can then leak back into the blood to raise serum TB levels and the delta fraction.29
The exact site/mechanism responsible for the impaired barrier/excretory function in the IL-6−/− mice is currently under investigation. Possibilities include increased permeability of the hepatocyte-biliary tree axis because of leaky intercellular junctions, increased susceptibility of small bile duct cells to apoptosis, and/or failure of feedback mechanisms to decrease bile flow in obstructive cholangiopathy.53 This can lead to leakage of bile into the portal connective tissue and a sustained stimulus for BEC and myofibroblast proliferation.
In humans, IL-6 is produced within the liver by Kupffer’s cells and other antigen-presenting cells, endothelial cells,11 and BEC8 during acute and chronic hepatitis, alcoholic liver disease,11 PBC, PSC, and other causes of cirrhosis.8,13 During stage I–III primary biliary cirrhosis there is significant liver enlargement, which is associated with elevated intrahepatic IL-6 mRNA levels12 and a high rate of hepatocyte proliferation.54 Serum IL-6 is also increased in a variety of patients with chronic inflammatory liver diseases, including chronic hepatitis C virus infection.10,55 The results of this study suggest that IL-6/gp130 signaling likely contributes to compensatory hepatocyte growth during chronic injury, at least in chronic biliary tract diseases, which is similar to keratinocyte and synovial cell proliferation observed in other “chronic fibroinflammatory proliferative disorders,” such as psoriasis and rheumatoid arthritis, respectively.18
Empirical linear regression models are used to predict decompensation or death in patients with chronic biliary diseases and are used to optimally time therapeutic intervention with liver transplantation. Almost all of these models have identified elevated TB and histological stage of the disease as independent predictors of survival.56-60 However, the rate of progression through various histopathological stages is variable, and factors influencing the evolution are poorly understood. This study illustrates an important concept: the rate of progression of biliary fibrosis/cirrhosis is influenced by the absolute and relative growth rates of various cell populations within the liver. In turn, the growth rates are influenced by the availability of cytokines and growth factors and by the expression of receptors for these molecules. In this model, despite a similar degree of injury, the adaptive changes brought about by the absence of IL-6 resulted in a repair response that actually hastened the development of architectural distortion and subsequent decompensation. The more advanced biliary fibrosis stage and decreased hepatocyte proliferation in the IL-6−/− mice after BDL were associated with decreased expression of native and phosphorylated gp130 and STAT3 in the liver, consistent with the increased fibrosis seen in aged-normal hepatic gp130 knockout mice.51
Polymorphisms in the IL-6 promoter region61-63 and levels of soluble IL-6Rα3,64,65 importantly contribute to IL-6 biological activity. Whether these can affect the evolution and compensation of biliary cirrhosis in humans is certainly worthy of further investigation. Conversely, liver injury and the development of cirrhosis might be retarded by infusion of cytokines/growth factors that preserve hepatocyte integrity and/or favor hepatocyte proliferation over (myo-)fibroblasts and BEC that are responsible for distortion of the liver architecture.34 Thus, in addition to treatment aimed at removing the insult in chronic inflammatory liver disease (eg, interferon), it should be possible to simultaneously intervene with cytokines and growth factors that preserve hepatocytes and, consequently, architectural integrity.
Acknowledgments
We thank Dr. Shinji Osada for his technical help and assistance in Western blotting, ImClone Systems Incorporated for supplying the mutein-IL-6, and Ms. Joanne Lasko for organizing laboratory ordering and preparing the manuscript.
Footnotes
Address reprint requests to Dr. A. J. Demetris, E1548 BMST, University of Pittsburgh, Pittsburgh, PA 15261. E-mail: demetrisaj@msx.upmc.edu.
Supported by National Institutes of Health Grant NIH 1 RO1DK49615-03.
References
- 1.Cressman DE, Greenbaum LE, Deangelis RA, Ciliberto G, Furth EE, Poli V, Taub R: Liver failure and defective hepatocyte regeneration in interleukin-6-deficient mice. Science 1996, 274:1379-1383 [DOI] [PubMed] [Google Scholar]
- 2.Sakamoto T, Liu Z, Murase N, Ezure T, Yokomuro S, Poli V, Demetris AJ: Mitosis and apoptosis in the liver of interleukin-6-deficient mice after partial hepatectomy. Hepatology 1999, 29:403-411 [DOI] [PubMed] [Google Scholar]
- 3.Maione D, Di Carlo E, Li W, Musiani P, Modesti A, Peters M, Rose-John S, Della Rocca C, Tripodi M, Lazzaro D, Taub R, Savino R, Ciliberto G: Coexpression of IL-6 and soluble IL-6R causes nodular regenerative hyperplasia and adenomas of the liver. EMBO J 1998, 17:5588-5597 [DOI] [PMC free article] [PubMed] [Google Scholar]
- 4.Kuma S, Inaba M, Ogata H, Inaba K, Okumura T, Saito K, Yamamoto M, Ikehara S: Effect of human recombinant interleukin-6 on the proliferation of mouse hepatocytes in the primary culture. Immunobiology 1990, 180:235-242 [DOI] [PubMed] [Google Scholar]
- 5.Huggett AC, Ford CP, Thorgeirsson SS: Effects of interleukin-6 on the growth of normal and transformed rat liver cells in culture. Growth Factors 1989, 2:83-89 [DOI] [PubMed] [Google Scholar]
- 6.Matsumoto K, Fujii H, Michalopoulos G, Fung JJ, Demetris AJ: Human biliary epithelial cells secrete and respond to cytokines and hepatocyte growth factors in vitro: interleukin-6, hepatocyte growth factor and epidermal growth factor promote DNA synthesis in vitro. Hepatology 1994, 20:376-382 [PubMed] [Google Scholar]
- 7.Patel T, LaRusso NF, Gores GJ: Interleukin-6 suppresses cholangiocyte apoptosis by down-regulation of Bax. Hepatology 1997, 26:226A9214474 [Google Scholar]
- 8.Yasoshima M, Kono N, Sugawara H, Katayanagi K, Harada K, Nakanuma Y: Increased expression of interleukin-6 and tumor necrosis factor-alpha in pathologic biliary epithelial cells: in situ and culture study. Lab Invest 1998, 78:89-100 [PubMed] [Google Scholar]
- 9.Yokomuro S, Lunz JG, Sakamoto T, Ezure T, Murase N, Demetris AJ: The effect of interleukin-6 (IL-6)/gp130 signaling on biliary epithelial cell growth, in vitro. Cytokine 2000 (in press) [DOI] [PubMed]
- 10.Malaguarnera M, Trovato BA, Laurino A, Di Fazio I, Romeo MA, Motta M: Interleukin-6 in hepatitis C cirrhosis. Panminerva Med 1996, 38:207-210 [PubMed] [Google Scholar]
- 11.Kakumu S, Fukatsu A, Shinagawa T, Kurokawa S, Kusakabe A: Localisation of intrahepatic interleukin 6 in patients with acute and chronic liver disease. J Clin Pathol 1992, 45:408-411 [DOI] [PMC free article] [PubMed] [Google Scholar]
- 12.Martinez OM, Villanueva JC, Gershwin ME, Krams SM: Cytokine patterns and cytotoxic mediators in primary biliary cirrhosis. Hepatology 1995, 21:113-119 [PubMed] [Google Scholar]
- 13.Napoli J, Bishop GA, McCaughan GW: Increased intrahepatic messenger RNA expression of interleukins 2, 6, and 8 in human cirrhosis. Gastroenterology 1994, 107:789-798 [DOI] [PubMed] [Google Scholar]
- 14.Wu J, Kuncio GS, Zern MA: Human liver growth in fibrosis and cirrhosis. Strain AJ Diehl AM eds. Liver Growth and Repair. 1998, :pp 558-576 Chapman and Hall, London [Google Scholar]
- 15.Tiggelman AM, Boers W, Linthorst C, Brand HS, Sala M, Chamuleau RA: Interleukin-6 production by human liver (myo)fibroblasts in culture. Evidence for a regulatory role of LPS, IL-1 beta and TNF alpha. J Hepatol 1995, 23:295-306 [PubMed] [Google Scholar]
- 16.Huang YS, Hwang SJ, Chan CY, Wu JC, Chao Y, Chang FY, Lee SD: Serum levels of cytokines in hepatitis C-related liver disease: a longitudinal study. Chung Hua I Hsueh Tsa Chih (Taipei) 1999, 62:327-333 [PubMed] [Google Scholar]
- 17.Choi I, Kang HS, Yang Y, Pyun KH: IL-6 induces hepatic inflammation and collagen synthesis in vivo. Clin Exp Immunol 1994, 95:530-535 [DOI] [PMC free article] [PubMed] [Google Scholar]
- 18.Hirano T: Interleukin 6 and its receptor: ten years later. Int Rev Immunol 1998, 16:249-284 [DOI] [PubMed] [Google Scholar]
- 19.Hirota H, Chen J, Betz UA, Rajewsky K, Gu Y, Ross J, Jr, Muller W, Chien KR: Loss of a gp130 cardiac muscle cell survival pathway is a critical event in the onset of heart failure during biomechanical stress. Cell 1999, 97:189-198 [DOI] [PubMed] [Google Scholar]
- 20.Liu Z, Sakamoto T, Ezure T, Yokomuro S, Murase N, Michalopoulos G, Demetris AJ: Interleukin-6, hepatocyte growth factor, and their receptors in biliary epithelial cells during a type I ductular reaction in mice: interactions between the periductal inflammatory and stromal cells and the biliary epithelium. Hepatology 1998, 28:1260-1268 [DOI] [PubMed] [Google Scholar]
- 21.Liu Z, Sakamoto T, Yokomuro S, Ezure T, Murase N, Contrucci S, Demetris AJ: The acute response to obstructive cholangiopathy in IL-6 deficient mice: compensation by leukemia inhibitory factor (LIF) suggests importance of gp-130 signaling in the ductular reaction. Liver 2000 (in press) [DOI] [PubMed]
- 22.Poli V, Balena R, Fattori E, Markatos A, Yamamoto M, Tanaka H, Ciliberto G, Rodan GA, Costantini F: Interleukin-6 deficient mice are protected from bone loss caused by estrogen depletion. EMBO J 1994, 13:1189-1196 [DOI] [PMC free article] [PubMed] [Google Scholar]
- 23.Skelly SM, Tackney C, Hicklin D, Tamkins T, Goldstein N, Waksal H, Dagan S: High-level expression of a biologically active human interleukin-6 mutein. J Biotechnol 1994, 34:79-86 [DOI] [PubMed] [Google Scholar]
- 24.Portmann BC, MacSween RNM: Diseases of the intrahepatic bile ducts. ed 3 MacSween RNM Anthony PP Scheuer PJ Burt AD Portmann BC eds. Pathology of the Liver, 1994, :pp 477-512 Churchill Livingstone, New York [Google Scholar]
- 25.Johnstone JM, Lee EG: A quantitative assessment of the structural changes the rat’s liver following obstruction of the common bile duct. Br J Exp Pathol 1976, 57:85-94 [PMC free article] [PubMed] [Google Scholar]
- 26.Sugihara A, Tsujimura T, Fujita Y, Nakata Y, Terada N: Evaluation of role of mast cells in the development of liver fibrosis using mast cell-deficient rats and mice. J Hepatol 1999, 30:859-867 [DOI] [PubMed] [Google Scholar]
- 27.Ni R, Nishikawa Y, Carr BI: Cell growth inhibition by a novel vitamin K is associated with induction of protein tyrosine phosphorylation. J Biol Chem 1998, 273:9906-9911 [DOI] [PubMed] [Google Scholar]
- 28.Kozaki N, Shimizu S, Higashijima H, Kuroki S, Yamashita H, Yamaguchi K, Chijiiwa K, Tanaka M: Significance of serum delta-bilirubin in patients with obstructive jaundice. J Surg Res 1998, 79:61-65 [DOI] [PubMed] [Google Scholar]
- 29.Hashmonai M, Kam I, Schramek A: The etiology of “white bile” in the biliary tree. J Surg Res 1984, 37:479-486 [DOI] [PubMed] [Google Scholar]
- 30.Heinrich PC, Behrmann I, Muller-Newen G, Schaper F, Graeve L: Interleukin-6-type cytokine signalling through the gp130/Jak/STAT pathway1. Biochem J 1998, 334:297-314 [DOI] [PMC free article] [PubMed] [Google Scholar]
- 31.Saito M, Yoshida K, Hibi M, Taga T, Kishimoto T: Molecular cloning of a murine IL-6 receptor-associated signal transducer, gp130, and its regulated expression in vivo. J Immunol 1992, 148:4066-4071 [PubMed] [Google Scholar]
- 32.Kountouras J, Billing BH, Scheuer PJ: Prolonged bile duct obstruction: a new experimental model for cirrhosis in the rat. Br J Exp Pathol 1984, 65:305-311 [PMC free article] [PubMed] [Google Scholar]
- 33.Belle SH, Beringer KC, Detre KM: Recent findings concerning liver transplantation in the United States. Clin Transpl 1996, :15-29 [PubMed] [Google Scholar]
- 34.Demetris AJ, Sakamoto T, Liu Z, Yokomuro S, Ezure T, Murase N, Blakolmer K: The ductular reaction in liver disease: emphasis on a type I response. Fleig WE eds. Normal and Malignant Liver Cell Growth. 1999, :pp 141-155 Kluwer Academic Publishers, Dordecht [Google Scholar]
- 35.Polimeno L, Azzarone A, Zeng QH, Panella C, Subbotin V, Carr B, Bouzahzah B, Francavilla A, Starzl TE: Cell proliferation and oncogene expression after bile duct ligation in the rat: evidence of a specific growth effect on bile duct cells. Hepatology 1995, 21:1070-1078 [PMC free article] [PubMed] [Google Scholar]
- 36.Napoli J, Prentice D, Niinami C, Bishop GA, Desmond P, McCaughan GW: Sequential increases in the intrahepatic expression of epidermal growth factor, basic fibroblast growth factor, and transforming growth factor beta in a bile duct ligated rat model of cirrhosis. Hepatology 1997, 26:624-633 [DOI] [PubMed] [Google Scholar]
- 37.Tuchweber B, Desmouliere A, Bochaton-Piallat ML, Rubbia-Brandt L, Gabbiani G: Proliferation and phenotypic modulation of portal fibroblasts in the early stages of cholestatic fibrosis in the rat. Lab Invest 1996, 74:265-278 [PubMed] [Google Scholar]
- 38.Desmet VJ: Cholestasis: extrahepatic obstruction and secondary biliary cirrhosis. ed 3 MacSween RNM Anthony PP Scheuer PJ Burt AD Portmann BC eds. Pathology of the Liver, 1994, :pp 425-476 Churchill Livingstone, Edinburgh [Google Scholar]
- 39.Gall JA, Bhathal PS: A quantitative analysis of the liver following ligation of the common bile duct. Liver 1990, 10:116-125 [DOI] [PubMed] [Google Scholar]
- 40.Zimmermann H, Ganz P, Zimmermann A, Oguey D, Marti U, Reichen J: The overexpression of proliferating cell nuclear antigen in biliary cirrhosis in the rat and its relationship with epidermal growth factor receptor. J Hepatol 1995, 23:459-464 [DOI] [PubMed] [Google Scholar]
- 41.Oguey D, Marti U, Reichen J: Epidermal growth factor receptor in chronic bile duct obstructed rats: implications for maintenance of hepatocellular mass. Eur J Cell Biol 1992, 59:187-195 [PubMed] [Google Scholar]
- 42.Yamauchi H, Koyama K, Otowa T, Ouchi K, Anezaki T, Sato T: Morphometric studies on the rat liver in biliary obstruction. Tohoku J Exp Med 1976, 119:9-25 [DOI] [PubMed] [Google Scholar]
- 43.Kimura F, Miyazaki M, Itoh H: Effects of biliary obstruction on hepatic deoxyribonucleic acid and protein synthesis after partial hepatectomy. Hepatogastroenterology 1997, 44:501-507 [PubMed] [Google Scholar]
- 44.Schirmacher P, Peters M, Ciliberto G, Blessing M, Lotz J, Meyer zum Buschenfelde KH, Rose-John S: Hepatocellular hyperplasia, plasmacytoma formation, and extramedullary hematopoiesis in interleukin (IL)-6/soluble IL-6 receptor double- transgenic mice. Am J Pathol 1998, 153:639-648 [DOI] [PMC free article] [PubMed] [Google Scholar]
- 45.Moghul A, Lin L, Beedle A, Kanbour-Shakir A, DeFrances MC, Liu Y, Zarnegar R: Modulation of c-MET proto-oncogene (HGF receptor) mRNA abundance by cytokines and hormones: evidence for rapid decay of the 8 kb c-MET transcript. Oncogene 1994, 9:2045-2052 [PubMed] [Google Scholar]
- 46.Liu Y, Michalopoulos GK, Zarnegar R: Structural and functional characterization of the mouse hepatocyte growth factor gene promoter. J Biol Chem 1994, 269:4152-4160 [PubMed] [Google Scholar]
- 47.Liu Y, Beedle AB, Lin L, Bell AW, Zarnegar R: Identification of a cell-type-specific transcriptional repressor in the promoter region of the mouse hepatocyte growth factor gene. Mol Cell Biol 1994, 14:7046-7058 [DOI] [PMC free article] [PubMed] [Google Scholar]
- 48.Michalopoulos GK, DeFrances MC: Liver regeneration. Science 1997, 276:60-66 [DOI] [PubMed] [Google Scholar]
- 49.O’Brien CA, Manolagas SC: Isolation and characterization of the human gp130 promoter. Regulation by STATS. J Biol Chem 1997, 272:15003-15010 [DOI] [PubMed] [Google Scholar]
- 50.Omori N, Evarts RP, Omori M, Hu Z, Marsden ER, Thorgeirsson SS: Expression of leukemia inhibitory factor and its receptor during liver regeneration in the adult rat. Lab Invest 1996, 75:15-24 [PubMed] [Google Scholar]
- 51.Betz UAK, Bloch W, van den Broek M, Yoshida K, Taga T, Kishimoto T, Addicks K, Rajewsky K, Muller W: Postnatally induced inactivation of gp130 in mice results in neurological, cardiac, hematopoietic, immunological, hepatic, and pulmonary defects. J Exp Med 1998, 188:1955-1965 [DOI] [PMC free article] [PubMed] [Google Scholar]
- 52.Szabo G, Magyar Z, Szentirmai A, Jakab F, Mihaly K: Bile constituents in blood and lymph during biliary obstruction. II. The absorption and transport of bile acids and bilirubin. Lymphology 1975, 8:36-42 [PubMed] [Google Scholar]
- 53.Green RM, Whiting JF, Rosenbluth AB, Beier D, Gollan JL: Interleukin-6 inhibits hepatocyte taurocholate uptake and sodium- potassium-adenosinetriphosphatase activity. Am J Physiol 1994, 267:G1094-G1100 [DOI] [PubMed] [Google Scholar]
- 54.Shibata M, Watanabe M, Ueno Y, Sadamoto T, Sato G, Yasushi T, Yamagami T, Tuzimoto S, Enomoto M: Clinicopathological study of proliferating cell nuclear antigen (PCNA) of hepatocytes in primary biliary cirrhosis. J Gastroenterol 1994, 29:56-60 [DOI] [PubMed] [Google Scholar]
- 55.Ito N, Kawata S, Tamura S, Kiso S, Tsushima H, Maeda Y, Yamasaki E, Igura T, Matsuzawa Y: Induction of interleukin-6 by interferon alfa and its abrogation by a serine protease inhibitor in patients with chronic hepatitis C. Hepatology 1996, 23:669-675 [DOI] [PubMed] [Google Scholar]
- 56.Wiesner RH, Grambsch PM, Dickson ER, Ludwig J, MacCarty RL, Hunter EB, Fleming TR, Fisher LD, Beaver SJ, LaRusso NF: Primary sclerosing cholangitis: natural history, prognostic factors and survival analysis. Hepatology 1989, 10:430-436 [DOI] [PubMed] [Google Scholar]
- 57.Broome U, Olsson R, Loof L, Bodemar G, Hultcrantz R, Danielsson A, Prytz H, Sandberg-Gertzen H, Wallerstedt S, Lindberg G: Natural history and prognostic factors in 305 Swedish patients with primary sclerosing cholangitis. Gut 1996, 38:610-615 [DOI] [PMC free article] [PubMed] [Google Scholar]
- 58.Farrant JM, Hayllar KM, Wilkinson ML, Karani J, Portmann BC, Westaby D, Williams R: Natural history and prognostic variables in primary sclerosing cholangitis. Gastroenterology 1991, 100:1710-1717 [DOI] [PubMed] [Google Scholar]
- 59.Wiesner RH: Liver transplantation for primary biliary cirrhosis and primary sclerosing cholangitis: predicting outcomes with natural history models. Mayo Clin Proc 1998, 73:575-588 [DOI] [PubMed] [Google Scholar]
- 60.Reisman Y, van Dam GM, Gips CH, Lavelle SM, Euricterus PM: Survival probabilities of Pugh-Child-PBC classified patients in the euricterus primary biliary cirrhosis population, based on the Mayo clinic prognostic model. Euricterus Project Management Group. Hepatogastroenterology 1997, 44:982-989 [PubMed] [Google Scholar]
- 61.Fishman D, Faulds G, Jeffery R, Mohamed-Ali V, Yudkin JS, Humphries S, Woo P: The effect of novel polymorphisms in the interleukin-6 (IL-6) gene on IL-6 transcription and plasma IL-6 levels, and an association with systemic-onset juvenile chronic arthritis. J Clin Invest 1998, 102:1369-1376 [DOI] [PMC free article] [PubMed] [Google Scholar]
- 62.Murray RE, McGuigan F, Grant SF, Reid DM, Ralston SH: Polymorphisms of the interleukin-6 gene are associated with bone mineral density. Bone 1997, 21:89-92 [DOI] [PubMed] [Google Scholar]
- 63.Fugger L, Morling N, Bendtzen K, Ryder L, Andersen V, Heilman C, Karup Pedersen F, Friis J, Halbert P, Svejgaard A: IL-6 gene polymorphism in rheumatoid arthritis, pauciarticular juvenile rheumatoid arthritis, systemic lupus erythematosus, and in healthy Danes. J Immunogenet 1989, 16:461-465 [DOI] [PubMed] [Google Scholar]
- 64.Peters M, Jacobs S, Ehlers M, Vollmer P, Mullberg J, Wolf E, Brem G, Meyer zum Buschenfelde KH, Rose-John S: The function of the soluble interleukin 6 (IL-6) receptor in vivo: sensitization of human soluble IL-6 receptor transgenic mice towards IL-6 and prolongation of the plasma half-life of IL-6. J Exp Med 1996, 183:1399-1406 [DOI] [PMC free article] [PubMed] [Google Scholar]
- 65.Peters M, Blinn G, Solem F, Fischer M, Meyer zum Buschenfelde KH, Rose-John S: In vivo and in vitro activities of the gp130-stimulating designer cytokine Hyper-IL-6. J Immunol 1998, 161:3575-3581 [PubMed] [Google Scholar]