

Abstract
The mechanisms of hepatocarcinogenesis by certain synthetic estrogens seem to involve both nongenotoxic and indirect genotoxic effects. However, the natural estrogen estradiol did not exert any carcinogenic effects in established experimental protocols. To elucidate specific long-term effects of natural estrogens on hepatocytes, small pieces of ovarian tissue were transplanted via the portal vein into the livers of ovariectomized female rats. One week, 3 weeks, and 3 months after transplantation the transplants were found to proliferate and to secrete estradiol. Three weeks after transplantation the hepatocytes of the liver acini downstream of the stimulated transplants already showed a remarkable loss of glycogen, distinct cytoplasmic amphophilia, enlargement of their nuclei, a strong increase in the number and size of peroxisomes, an increase in proliferative activity and apoptotic elimination, and changes in the activity of certain key enzymes of energy metabolism. All hepatocellular alterations could be inhibited by the estrogen receptor antagonist toremifene and are, therefore, attributed to specific effects of estradiol produced by the transplants. The observed alterations resemble in some respects amphophilic preneoplastic liver foci, which particularly occur after long-term administration of nongenotoxic hepatocarcinogens, including the adrenal steroid hormone dehydroepiandrosterone. In a preliminary experiment three of six animals exhibited a hepatocellular carcinoma, and another animal developed a hepatocellular adenoma 18 months after intrahepatic ovarian tissue transplantation.
A causal relationship between the use of oral contraceptive steroids and the development of hepatocellular adenomas in humans is now accepted, whereas a definite relationship between oral contraceptive use and malignant liver tumors has not yet been established. Nevertheless, some authors reported an increase in incidence of hepatocellular carcinomas in women using hormonal contraceptives for prolonged periods. 1-3 This was supported by long-term animal studies, which demonstrate an enhancement of hepatocarcinogenesis by various synthetic estrogens, eg, ethinyl estradiol and diethylstilbestrol. 4-7 The mechanisms of estrogen carcinogenesis are quite complex: They include nongenotoxic, ie, proliferative effects via direct mitogenic action, as well as by enhancement of the effects of epidermal growth factor (EGF), hepatocyte growth factor (HGF), and transforming growth factor α (TGFα) on hepatocytes. 8-10 Furthermore, genotoxic effects like the formation of DNA adducts and the generation of reactive intermediates (quinones) and free radicals, causing lipid peroxidation, have been identified. 11,12
Interestingly, the natural estrogen estradiol exerts stimulating effects on hepatocyte proliferation, whereas no carcinogenic effect of estradiol has been demonstrated so far. 13 Some of the carcinogenic effects of ethinyl estradiol can be inhibited by simultaneous application of estrogen receptor antagonists like tamoxifen, particularly hepatocyte proliferation and appearance of γ-glutamyl-transferase (GGT)-positive foci. 14 Therefore, these effects are reasonably assumed to be estrogen receptor mediated, and one has to wonder if natural estrogens lack any carcinogenic potential. On the other hand, an additive effect of ethinyl estradiol and tamoxifen on the appearance of GGT-positive foci has been observed. 5 For this reason, the the carcinogenic effects of synthetic estrogens are considered to be caused by indirect genotoxic mechanisms, rather than being estrogen receptor mediated. However, this interpretation is limited by the finding that the antiestrogen tamoxifen, which has been used in these experiments, has genotoxic potential and exerts hepatocarcinogenic effects in rats. 11,15 We wanted to investigate the long-term effects of natural estrogens on hepatocytes by transplanting ovarian tissue into rat liver.
Materials and Methods
Experimental Design
The experimental design is shown in Table 1 ▶ . Highly inbred Lewis rats, weighing about 200 g at the start of the experiment, were used. The main group (MG) consisted of ovariectomized female rats, which received ovarian tissue transplanted via the portal vein into the right part of the liver. In control group 1 (CG1) the female animals were only ovariectomized but did not receive any transplantation. All other control groups received intrahepatic transplantation of ovarian tissue in analogy to MG (Table 1) ▶ . Control group 5 (CG5) animals were administered 24 mg/kg/day of the estrogen receptor antagonist toremifene (donated by Dr. Ellmen, Orion Corporation, Orion Pharma, Turku, Finland) during the whole experimental period. Control group 6 (CG6) consisted of completely untreated female rats weighing about 230 g at the time of sacrifice. Housing and treatment of the animals were in line with the guidelines of the Society for Laboratory Animals Service (GV-Solas) and the strict German animal protection law.
Table 1.
Experimental Design
| MG | Female rats, ovariectomy and transplantation* |
| CG1 | Female rats, ovariectomy |
| CG2 | Female rats, transplantation* without ovariectomy |
| CG3 | Male rats, orchiectomy and transplantation* |
| CG4 | Male rats, transplantation* without orchiectomy |
| CG5 | Female rats, ovariectomy and transplantation,* additional treatment with estrogen receptor antagonist toremifene |
| CG6 | Completely untreated female rats |
* The ovarian tissue of the ovariectomized animals of MG, CG1, and CG5 was used as donor tissue for all recipient animals. The tissue of one ovary was used for one recipient.
Experimental Procedure
After transabdominal ovariectomy or orchiectomy, the ovaries used for transplantation were dissected with razor blades into small fragments about 400 μm in diameter. Isologous transplantation of the ovarian tissue via the portal vein into the right part of the liver was carried out with groups MG, CG2, CG3, CG4, and CG5, each group consisting of 18 animals. The method of transplantation procedure was essentially the same as that for transplantation of pancreatic islets and thyroid follicles, as described earlier. 16-18 At 1 week, 3 weeks, and 3 months after transplantation, six animals of each experimental group were killed and perfused with 0.5% glutaraldehyde and 3% formaldehyde. An additional six animals of from the MG were killed 18 months after transplantation as a preliminary experiment for a long-term study. Seven days before animals were killed, half of the animals of each group received osmotic pumps s.c. (Alzet model 2ML1; Alza Corp., Palo Alto, CA), each filled with 40 mg of 5-bromo-2′-desoxyuridine (BrdU) (Sigma, Heidelberg, Germany), as described earlier. 16,19 These pumps continuously delivered BrdU until the animals were sacrificed. The remaining animals received a single dose of 50 mg BrdU/kg body weight i.p. 1 hour before sacrifice. The preparation of tissues has been described elsewhere (for details see ref. 17 ). From the liver specimen, serial sections of 2 μm thickness were stained with hematoxylin and eosin (H&E) and by the periodic acid-Schiff (PAS) reaction.
Immunohistochemistry
Immunostains of the liver for BrdU (monoclonal primary antibody from Dako, Hamburg, Germany; dilution 1:100), transforming growth factor (TGF-α) (monoclonal primary antibody from Oncogene science, Cambridge, MA; final antibody concentration 10 μg/ml), and glutathione-S-transferase, placental form (GST-P) (polyclonal primary antibody from Biogenex, San Ramon, CA; dilution 1:100) were performed as described earlier. 16,17 Estrogen receptor (ER) (monoclonal primary antibody from Coulter-Immunotech, Hamburg, Germany; dilution 1:50) was pretreated by microwave cooking (600 W) in citrate buffer for 30 minutes, and after incubation with the primary antibody treated with an avidin-biotin block (Boehringer Mannheim, Mannheim, Germany) to block endogenous biotin. In all cases, the LSAB+ Kit (Dako) and the DAB+ Kit (Dako) were used for the immunostainings.
Determination of BrdU-Labeling, Apoptotic, and Mitotic Indices
The mitotic indices (MI), the apoptotic indices (AI), and the BrdU labeling indices (BrdU-LI 1h and BrdU-LI 7d) of the hepatocytes were determined as described earlier. 16,17 For the groups that had received a transplantation, all indices were calculated separately for the liver acini downstream of the transplanted ovarian fragments in the right part of the liver, and in the left part of the liver, which was free of transplants (intraindividual control). When no alterations were identifiable downstream of the transplants, the indices for the right part of the liver were calculated with the hepatocytes at a distance of about 1 mm from the transplants. In CG1 and CG6, only the right lobes were used.
Serum Estrogen, Progesterone, LH, and FSH
Serum estrogen and progesterone concentrations were measured by an electrochemiluminescence immunoassay with an Elecsys analyzer (Boehringer Mannheim). Serum-luteinizing hormone (LH) and follicle-stimulating hormone (FSH) concentrations were measured using the Amerlex-M magnetic separation system (Amersham International, Buckinghamshire, United Kingdom).
Histochemistry of Enzymes and Metabolic Products
Pieces from frozen liver tissue of five rats were frozen onto the same tissue holder, and serial sections of all pieces were cut simultaneously in a cryostat (Jung, Nussloch, Germany). 20 The sections were mounted on the same slide or the same membrane and incubated for histochemical reactions. Liver sections and ovarian sections of one completely untreated adult rat were always included as a normal control. The following enzymes were investigated: glycogen synthase (SYN), glycogen phosphorylase (PHO), glucose-6-phosphatase (G6Pase), glucose-6-phosphate dehydrogenase (G6PDH), pyruvate kinase (PK), succinate dehydrogenase (SDH), malic enzyme (ME), mitochondrial glycerol-3-phosphate dehydrogenase (mG3PDH), cytochrome c oxidase (COX), acid phosphatase (AP), and γ-glutamyltransferase (GGT). 21-24 Furthermore, serial cryostat sections were stained for basophilia with toluidine blue, for the presence of neutral lipids with Fettrot B, and for the presence of glycogen with the PAS reaction.
Statistical Analysis
Body weight, AI, MI, BrdU-LI 1h, BrdU-LI 7d, serum estrogen, progesterone, LH, and FSH of the different experimental groups at 1 week, 3 weeks, and 3 months after transplantation were compared with the Wilcoxon-Mann-Whitney test. Significance was accepted when P < 0.05.
Results
Body Weight Gain
The body weight gain is shown in Table 2 ▶ . Three weeks and 3 months after transplantation the animals of the main group showed significantly lower body weight than the animals of CG1. No differences existed between MG and the nonovariectomized animals of CG2 throughout the whole experimental period. Interestingly, the toremifene-treated animals of CG5 showed significant reduction of body weight compared to MG at all times after transplantation. This delay in body weight gain is a well-known effect in female rats treated with antiestrogens. 25
Table 2.
Change of Body Weight of the Animals between Transplantation and Sacrifice
| Body weight change (%) | |||
|---|---|---|---|
| 1 week | 3 weeks | 3 months | |
| MG | 105 ± 1 | 113 ± 3 | 120 ± 3 |
| CG1 | 104 ± 0 | 123 ± 1* | 143 ± 4* |
| CG2 | 104 ± 2 | 112 ± 24 | 113 ± 2 |
| CG3 | 107 ± 3 | 111 ± 2 | 120 ± 5 |
| CG4 | 114 ± 5 | 122 ± 1 | 150 ± 5* |
| CG5 | 96 ± 1* | 101 ± 2* | 101 ± 1* |
Body weight at the time of transplantation/ovariectomy was set at 100%. Mean values ± SEM are shown. All groups consisted of six animals each.
* Significantly different from MG at the same time After transplantation, Wilcoxon-Mann-Whitney test P < 0.05
Estrogen, Progesterone, LH, and FSH Levels
As expected, 1 week after transplantation the serum values of estradiol of MG lay between those of CG1 and CG2 (Table 3) ▶ . The gonadotropin levels of MG did not differ significantly from those of CG2. Three weeks after transplantation, MG estradiol levels increased and reached those of CG2, whereas the corresponding LH and FSH levels did not change from 1 to 3 weeks after transplantation. Three months after transplantation, the FSH levels of MG were increased when compared with CG2. The estradiol levels of the male animals of CG3 and CG4 decreased in the course of the experiment and finally reached the low estradiol levels of CG1. The estradiol and gonadotropin levels of the toremifene-treated animals of CG5 did not differ from MG or CG2 at all times after transplantation. In the MG, the progesterone levels increased in the course of the experiment and, 3 months after transplantation, were significantly higher than those of CG1, CG3, CG4, and CG5.
Table 3.
Serum Hormone Levels of the Different Groups at Different Times after Transplantation
| Group | 1 week | 3 weeks | 3 months |
|---|---|---|---|
| MG E2 | 17.1 ± 1.4 (3) | 27.7 ± 3.7 (4)† | 27.4 ± 3.4 (6)† |
| CG1 E2 | <10 (2)*§ | 10.3 ± 0.2 (3)* | 10.5 ± 0.5 (6)*§ |
| CG2 E2 | 26 ± 4.2 (5) | 25.8 ± 6.4 (6) | 24.1 ± 3.5 (6) |
| CG3 E2 | 20.4 ± 3.3 (4) | 15 ± 2.8 (4)* | 11.8 ± 0.8 (6)*† |
| CG4 E2 | 23.6 ± 3.9 (6) | 16 ± 4.8 (2) | 15.8 ± 2.6 (6)*† |
| CG5 E2 | 15.1 ± 0.2 (2) | 32.6 ± 4.1 (6)† | 22.8 ± 6.5 (3) |
| MG Prog | 5.7 ± 2.5 (3) | 4.9 ± 1.4 (4) | 20.5 ± 4.1 (6)†‡ |
| CG1 Prog | 14.5 ± 2.4 (2) | 5.7 ± 1.0 (3) | 6.5 ± 1.6 (6)* |
| CG2 Prog | 12.8 ± 4.1 (5) | 8.3 ± 2.7 (6) | 9.7 ± 2.4 (6) |
| CG3 Prog | 7.2 ± 1.5 (4) | 4.7 ± 1.2 (4) | 7.4 ± 3.4 (6)* |
| CG4 Prog | 8.2 ± 2.6 (6) | 5.8 ± 2.4 (2) | 3.3 ± 0.3 (6)* |
| CG5 Prog | 4 ± 2.2 (2) | 7.8 ± 3.0 (6) | 6.5 ± 2.9 (3)* |
| MG LH | 7.8 ± 3.8 (3) | 10.2 ± 1.9 (4) | 5.6 ± 1.4 (6)‡ |
| CG1 LH | 9.1 ± 2.4 (2) | 14.4 ± 2.8 (3) | 15.4 ± 1.9 (6)*§ |
| CG2 LH | 3.3 ± 0.4 (5) | 3.1 ± 0.2 (6)* | 4.2 ± 1.2 (6) |
| CG3 LH | 7.9 ± 2.0 (4) | 10.1 ± 1.4 (4) | 12.5 ± 1.2 (6)* |
| CG4 LH | 2.7 ± 0.1 (6) | 2.3 ± 0.1 (2)* | 2.3 ± 0.1 (6)† |
| CG5 LH | 4.2 ± 0.0 (2) | 4.6 ± 0.7 (6) | 2.8 ± 0.7 (3) |
| MG FSH | 9.4 ± 1.0 (3) | 8.8 ± 0.9 (4) | 21.4 ± 3.7 (6)†‡ |
| CG1 FSH | 51.9 ± 4.0 (2)*§ | 68.1 ± 2.0 (2)*§ | 89.6 ± 8.0 (5)*†‡ |
| CG2 FSH | 7.5 ± 0.5 (5) | 8.6 ± 0.8 (6) | 8.3 ± 0.5 (6)* |
| CG3 FSH | 16.9 ± 4.0 (4) | 47.7 ± 2.0 (4)† | 69.7 ± 5.7 (6)*†‡ |
| CG4 FSH | 8.3 ± 0.5 (5) | 10 ± 0.8 (2) | 10.2 ± 1.4 (6)* |
| CG5 FSH | 7.5 ± 0.3 (2) | 8.2 ± 0.3 (6) | 16.2 ± 3.0 (2) |
Serum estradiol (E2) (pg/ml), progesterone (Prog) (ng/ml), LH (ng/ml), and FSH (ng/ml) at the time of sacrifice (1 week, 3 weeks, and 3 months after transplantation of ovarian fragments). Mean values ± SEM are shown. The number of animals is shown in parentheses.
* Significantly different from MG at the same time after transplantation.
† Significantly different from data at 1 week.
‡ Significantly different from data at 3 weeks.
§ CG1 significantly different from CG2 of the same time after transplantation.
*†‡ Wilcoxon-Mann-Whitney test P < 0.05.
Examined Organs Other Than Liver
One week after transplantation the uteri of MG resembled the small and atrophic uteri of CG1, but after 3 weeks they looked exactly like those of CG2 and CG6. Vaginal smears of MG 1 week after transplantation consisted of small and cornified epithelial cells, which are a characteristic of vaginal smears from ovariectomized animals, 26 but after 3 weeks they exhibited typical features of cells stimulated by estrogens, now resembling those found in CG2 and CG6. Because vaginal smears were taken once at the time of sacrifice, it remains unclear whether the animals of the MG exhibit an estrous cycle.
Histological examination of pituitary glands showed an enlargement of several endocrine epithelial cells in MG, CG1, and CG3 at all times after transplantation. In MG these endocrine cells were less enlarged at 3 months when compared with 1 and 3 weeks after transplantation. The histological examination of heart, lung, kidneys, adrenal glands, pancreas, and spleen did not reveal any unusual findings.
Morphology of the Transplanted Ovarian Tissue
By stereomicroscopic examination of the unstained liver sections the transplants of all groups were visible 1 week after transplantation. They measured about 1 mm in diameter and consisted of white-yellowish, firm tissue. The transplants of MG and CG5 reached a size of about 3 mm in diameter in the course of 3 months, with some of them containing several cystic structures, whereas the transplants in all other groups were sparse and small (Figure 1) ▶ .
Figure 1.
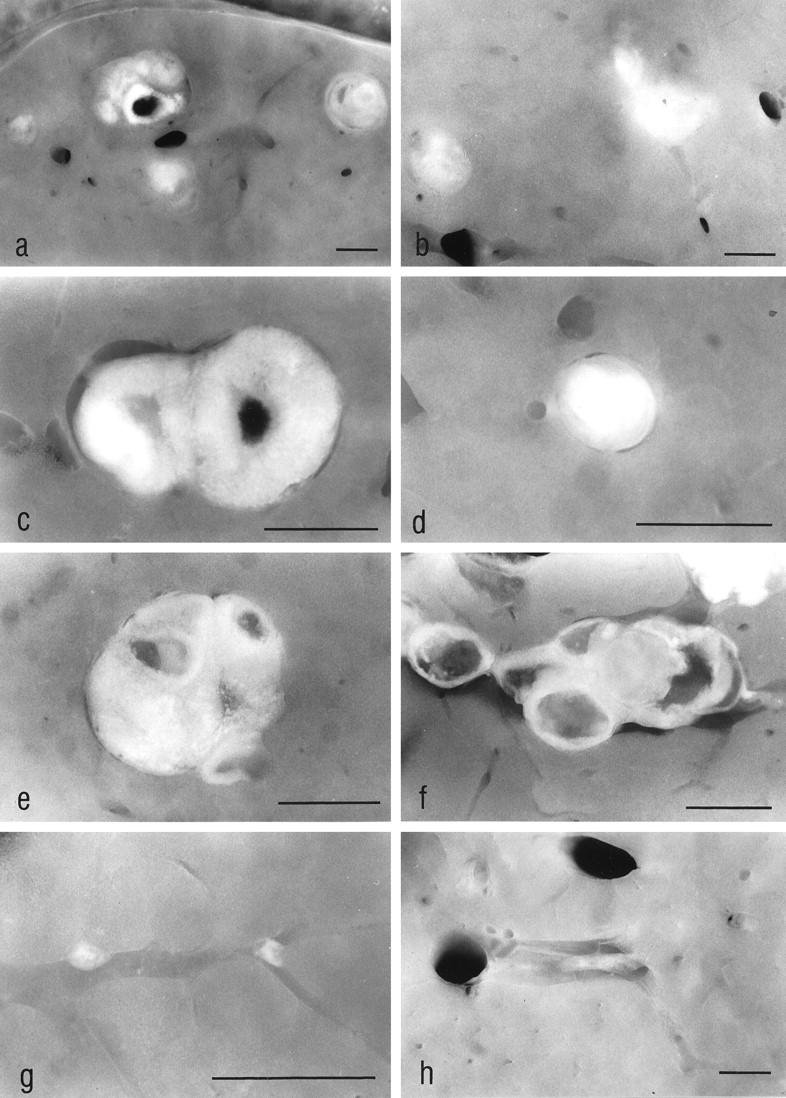
The stereomicroscopic examination of unstained liver slices allowed us to find intrahepatic ovarian transplants. In the ovariectomized animals (MG) (a and c) and in the orchiectomized animals (CG3) (b), the transplants reached a size of about 2 mm at 3 weeks after transplantation, whereas the transplants in the nonovariectomized animals (CG2) remained small (d). Three months after transplantation the transplants of MG (e), as well as those of the toremifene-treated animals (CG5) (f), showed a similar size if compared with those at 3 weeks after transplantation, whereas the transplants of CG2 (g) and of CG3 (h) underwent fibrosis, obviously because they were not stimulated in a sufficient manner by gonadotropins. The altered liver tissue downstream of the transplants in MG cannot be identified in the unstained slices. The transplant shown in e is the same as shown in Figure 5a ▶ . a–d: 3 weeks after transplantation; e–h: 3 months after transplantation. Original magnifications: a, ×9; b, ×11; c, ×25; d, ×29; e, ×22; f, ×18; g, ×35; h, ×11. Scale bars, 1 mm
By light microscopic examination the transplants of all groups contained follicles in varying stages of maturation, oocytes, corpora lutea, and sometimes corpora albicantia 1 week after transplantation. During the course of the experimental period the transplants of MG and CG5 showed a strong proliferative activity, and the number of large (Graafian-like) follicles increased. In contrast to this, the transplants of CG2 and CG4, and later those of CG3, were subject to atrophy and fibrosis (Figures 1 ▶ , d, g, and h, and 2b).
Morphology and Proliferative Activity of the Altered Liver Acini
One week after transplantation, the AI in MG and CG2 were increased in the neighborhood of the ovarian transplants in the right part of the liver when compared with the left part. MI and AI of the MG rats were increased when compared with CG6 (Table 4) ▶ . A noticeable but not significant increase in BrdU-LI 7d downstream of the transplants in MG could be detected when compared with the internal control tissue of the left part of the liver (twofold increase) and with the right part of the liver of CG2 (fourfold increase) (Table 5) ▶ .
Table 4.
MI and AI of MG, CG1, CG2, CG5, and CG6 at Different Times after Transplantation
| 1 week | 3 weeks | 3 months | ||||
|---|---|---|---|---|---|---|
| Right part | Left part | Right part | Left part | Right part | Left part | |
| MI 1/1000 | ||||||
| MG | 0.55 ± 0.20¶ | 0.37 ± 0.10 | 9.50 ± 1.76*‡¶ | 0.39 ± 0.12 | 3.22 ± 1.09*§¶ | 0.04 ± 0.02‡§ |
| CG1 | 0.24 ± 0.09 | 0.16 ± 0.12‡ | 0.08 ± 0.07† | |||
| CG2 | 0.10 ± 0.09 | 0.31 ± 0.13 | 0.58 ± 0.21‡ | 0.17 ± 0.04 | 0.03 ± 0.03†§ | 0.06 ± 0.04 |
| CG5 | 0.25 ± 0.16 | 0.43 ± 0.21 | 0.37 ± 0.06‡¶ | 0.32 ± 0.13 | 0.36 ± 0.16† | 0.42 ± 0.09† |
| CG6 | 0.10 ± 0.06 | |||||
| AI 1/1000 | ||||||
| MG | 1.00 ± 0.27*¶ | 0.17 ± 0.05 | 2.05 ± 0,52*¶ | 0.10 ± 0.05 | 0.76 ± 0.19*§¶ | 0.04 ± 0.03 |
| CG1 | 0.14 ± 0.06† | 0.15 ± 0.06† | 0.03 ± 0.02† | |||
| CG2 | 1.22 ± 0.47* | 0.08 ± 0.02 | 0.21 ± 0.13† | 0.04 ± 0.03 | 0.02 ± 0.03†‡ | 0.04 ± 0.04 |
| CG5 | 0.38 ± 0.21 | 0.17 ± 0.05 | 0.35 ± 0.09†¶ | 0.25 ± 0.09 | 0.16 ± 0.04† | 0.16 ± 0.02† |
| CG6 | 0.03 ± 0.03 |
Shown are data of MI and AI at 1 week, 3 weeks, and 3 months after transplantation. Mean values ± SEM are shown. Each group consisted of six animals. MI is the number of mitotic figures of hepatocytes per 1000 hepatocytic nuclei. AI is the number of apoptotic bodies per 1000 hepatocytic nuclei. If more than 10,000 nuclei were counted, two digits after the digital point are given. MI and AI were separately calculated for the liver acini downstream of the transplanted ovarian fragments in the right part of the liver, and in the left part of the liver, which was free of transplants. When no alterations were identifiable downstream of the transplants, the indices for the right part of the liver were calculated with the hepatocytes in a distance of about 1 mm from the transplants. For CG1 and CG6, indices were only calculated for the right lobe.
* Significantly different from the left part of the liver.
† Significantly different from MG at the same time after transplantation.
‡ Significantly different from data at 1 week.
§ Significantly different from data at 3 weeks.
¶ Significantly different from CG6.
*†‡§/p Wilcoxon-Mann-Whitney test P < 0.05.
Table 5.
BrdU-LI of All Groups at Different Times after Transplantation
| 1 week | 3 weeks | 3 months | ||||
|---|---|---|---|---|---|---|
| Right part | Left part | Right part | Left part | Right part | Left part | |
| BrdU-LI 7d | ||||||
| MG | 42.3 ± 12.7 (3) | 26.6 ± 9.5 (3) | 72.4 ± 4.3 (3)*∥ | 3.8 ± 2.3 (3) | 64.4 ± 5.9 (3)*∥ | 3.5 ± 1.3 (3) |
| CG1 | 7.5 ± 0.9 (3) | 16.3 ± 2.4 (3)†∥ | 4.9 ± 1.9 (3)†¶ | |||
| CG2 | 10.3 ± 3.9 (3) | 20.9 ± 1.3 (3)‡ | 11.9 ± 2.8 (3)† | 12.6 ± 2.4 (3) | 8.3 ± 0.7 (3)† | 5.0 ± 1.2 (3)§ |
| CG3 | 22.6 ± 4.6 (3)∥ | 24.6 ± 6.3 (3) | 62.3 ± 9.7 (3)*§¶ | 8.0 ± 1.6 (3) | 12.2 ± 4.2 (3)†¶ | 6.1 ± 0.4 (3) |
| CG4 | 26.4 ± 11.7 (3) | 30.7 ± 10.1 (3) | 9.3 ± 2.3 (3)† | 7.1 ± 1.9 (3) | 4.2 ± 1.8 (3)† | 2.8 ± 1.3 (3) |
| CG5 | 18.4 ± 0.3 (2)∥ | 24.9 ± 3.5 (2) | 9.6 ± 2.5 (3)† | 10.2 ± 2.0 (3) | 15.5 ± 3.1 (3)†∥ | 5.4 ± 6.7 (3)† |
| CG6 6 | 4.2± 1.7 (3) | |||||
| BrdU-LI 1h | ||||||
| MG | 0.2 ± 0.2 (2) | 0.1 ± 0.1 (2) | 4.7 ± 0.4 (3)*§∥ | 0.4 ± 0.1 (3) | 2.4 ± 0.5 (3)*§¶∥ | 0.1 ± 00 (3)¶ |
| CG1 | 0.1 ± 0.0 (3) | 0.3 ± 0.2 (3)† | 0.1 ± 0.0 (3)† | |||
| CG2 | 0.3 ± 0.1 (3) | 0.2 ± 0.1 (3) | 1.0 ± 0.2 (2)† | 0.2 ± 0.1 (2) | 0.1 ± 0.1 (3)† | 0.1 ± 0.0 (3) |
| CG3 | 1.2 ± 0.8 (3) | 0.5 ± 0.2 (3) | 5.7 ± 1.1 (2) | 0.2 ± 0.1 (2) | 0.1 ± 0.1 (3)† | 0.1 ± 0.1 (3) |
| CG4 | 0.4 ± 0.2 (3) | 0.5 ± 0.2 (3) | 0.4 ± 0.2 (3)† | 0.2 ± 0.1 (3) | 0.0 ± 0.0 (3)† | 0.0 ± 0.0 (3) |
| CG5 | 0.3 ± 0.1 (3) | 0.3 ± 0.1 (3) | 0.4 ± 0.1 (3)† | 0.5 ± 0.1 (3) | 0.1 ± 0.1 (2)† | 0.1 ± 0.0 (2)¶ |
| CG6 | 0.1± 0.0 (3) |
Data of BrdU-LI at 1 week, 3 weeks, and 3 months after transplantation. Mean values ± SEM are shown. The number of animals per group is shown in parentheses. BrdU-LI is the number of BrdU-labeled nuclei per 100 nuclei after either 7 days of continuous infusion via osmotic pumps or after 1 hour of pulse labeling. BrdU-LI were separately calculated for the liver acini downstream of the transplanted ovarian fragments in the right part of the liver, and in the left part of the liver, which was free of transplants. When no alterations were identifiable downstream of the transplants, the BrdU-LI for the right part of the liver was calculated with the hepatocytes at a distance of about 1 mm from the transplants. For CG1 and CG6, BrdU-LI was calculated only for the right lobe.
* Significantly different from the left part of the liver.
† Significantly different from MG at the same time after transplantation.
‡ CG2 significantly different from CG1.
§ Significantly different from BrdU-LI at 1 week.
¶ Significantly different from BrdU-LI at 3 weeks.
∥ Significantly different from CG6.
*†‡§/p∥ Wilcoxon-Mann-Whitney test P < 0.05.
Three weeks after transplantation the MG showed striking alterations in both the morphology and the proliferative activity of the acini downstream of the ovarian transplants. The control groups lacked any of those alterations, except for the castrated male animals of CG3, which showed alterations similar to those of the MG after 3 weeks. However, these alterations of CG3 had disappeared completely after 3 months. Three weeks after transplantation, the hepatocytes of the liver acini downstream of the transplanted ovarian tissue of MG and CG3 showed a decrease in glycogen content and an increase both in cytoplasmic basophilia and eosinophilia (Figures 2a and 3 ▶ ▶ , a, b, and d). This characteristic staining property, together with a noticeable homogeneity of the cytoplasm, is called cytoplasmic amphophilia. In this case it results from a striking increase in the number and size of peroxisomes, together with a slight increase in the number of mitochondria, as can be seen by electron microscopic examination (Figure 4) ▶ . In addition to this, the nuclei of the altered hepatocytes were enlarged, and many of them contained multiple nucleoli (Figures 3c and 4b) ▶ ▶ . The nuclear chromatin was decondensed. Interestingly, some hepatocytes showed intracytoplasmic areas of glycogen accumulation rather than depletion of glycogen. Whether these cells represent a different step of alteration or simply an intermediate state between unaltered hepatocytes and glycogen-poor hepatocytes remains unclear. The proliferative activity (MI, BrdU-LI 7d, and BrdU-LI 1h) and the apoptotic elimination of hepatocytes of the altered liver acini were simultaneously increased in the MG (Tables 4 and 5) ▶ ▶ . In particular, the BrdU-LI 7d in MG was increased 19-fold when compared with the left part of the liver of the same animals, fourfold when compared to CG1, eightfold when compared to CG4, sevenfold when compared to CG5, and 17-fold when compared with CG6. At this time there existed no significant difference between MG and CG3. The data on the proliferative activity in the different control groups and those for the activity in the left part of the liver in the MG were not significantly different.
Figure 2.
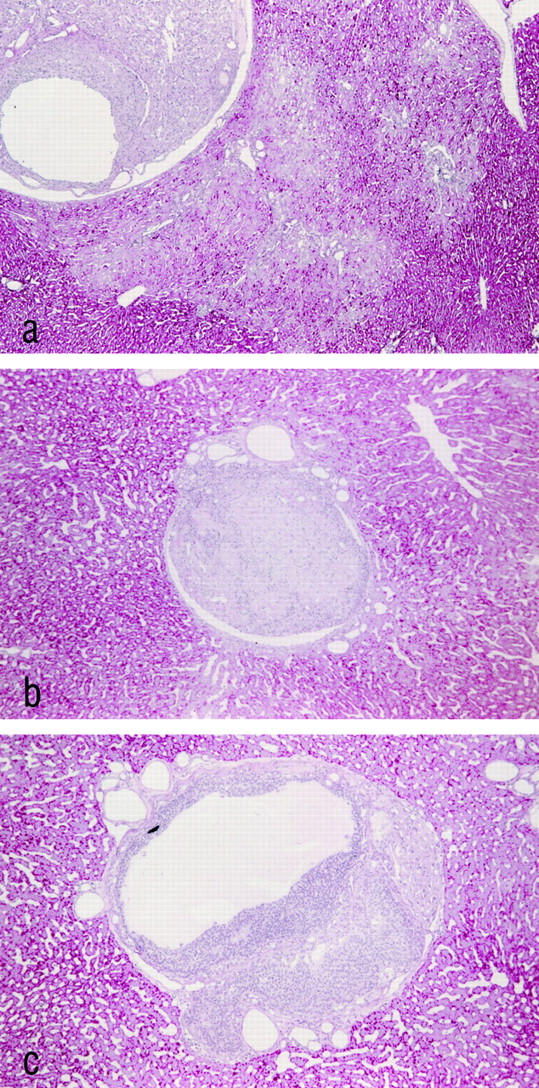
Ovarian transplants and surrounding hepatic tissue in different groups 3 weeks after transplantation. The transplants of the MG as shown in a contain follicles in varying stages of maturation, germ cells, and corpora lutea. The altered liver acini downstream of the transplant can be distinguished easily from the surrounding tissue by their glycogen depletion. b: The transplant of a nonovariectomized animal of CG2 that is beginning to fibrose. The hepatic tissue does not show any focal alterations. The transplant of an animal treated with toremifene (CG5) (c) contains follicular tissue and corpus luteum tissue similar to the transplants of MG. However, no morphological alterations of the liver acini downstream of the transplant can be detected. Paraffin sections, PAS stain. Original magnification, ×80.
Figure 3.
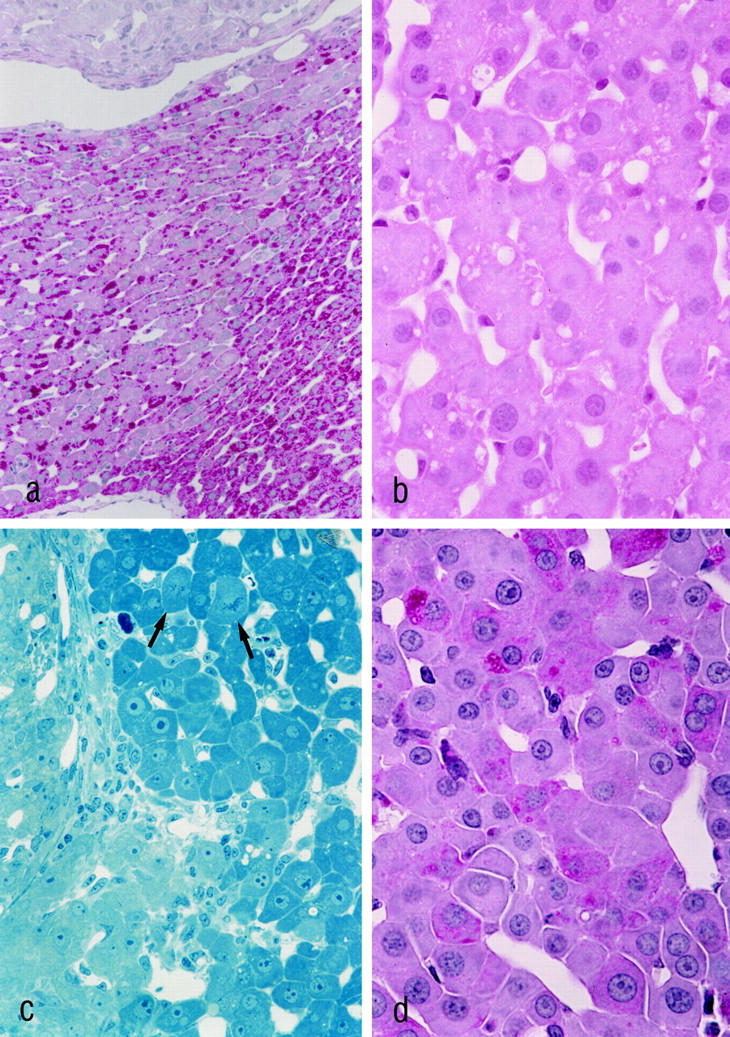
Histological features of the altered liver acini in MG 3 weeks (a–c) and 3 months (d) after transplantation. In a, the PAS-stained section demonstrates the decrease in glycogen in the liver acinus downstream of the ovarian transplant. The transplant, which is situated in a portal vein branch, is shown at the upper margin, and the draining hepatic venule is visible at the lower margin of the figure ▶ . The H&E stain (b) reveals a distinct cytoplasmic amphophilia of the altered hepatocytes. In c, the pale cells on the left are corpus luteum cells. The hepatocytes of the altered liver acinus in the right part of the figure ▶ exhibit enlarged nuclei with prominent nucleoli. Mitotic figures are indicated by arrows. Three months after transplantation, the typical cell plate pattern of hepatocytes is partly replaced by thickened trabeculae consisting of more than two cell layers of hepatocytes (d). a and d: PAS reaction; b: H&E-stained paraffin section; c: Epon section stained according to the method of Richardson. 40 Original magnifications: a, ×225; b and d, ×725; c, ×470.
Figure 4.
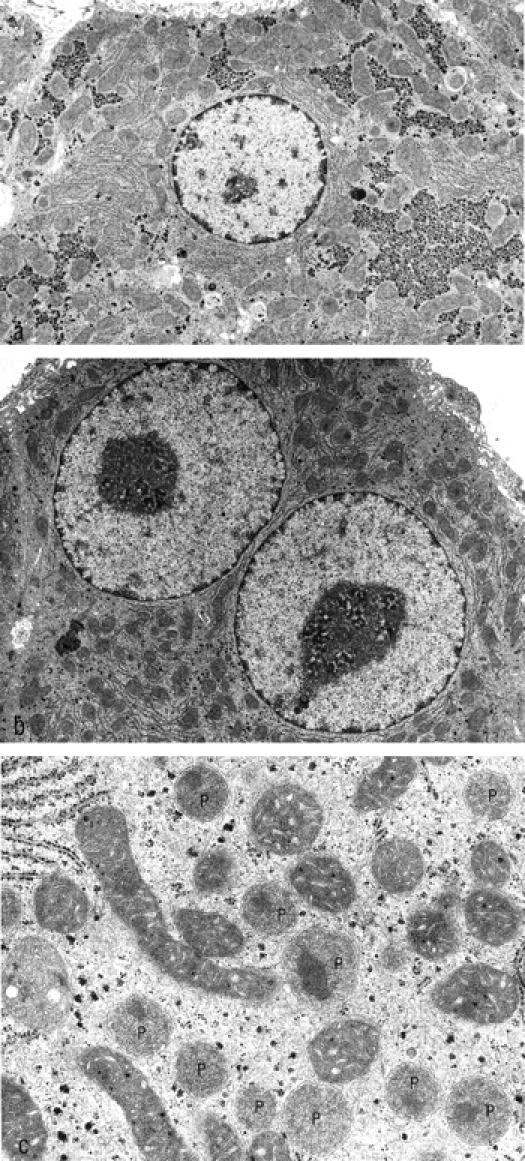
The electron micrographs show nonaltered (a) and altered (b) hepatocytes of the same animal 3 weeks after transplantation. The altered hepatocytes exhibit a loss of glycogen and enlarged nuclei with a decondensation of chromatin and prominent nucleoli. At higher magnification (c), a strong increase in the number and size of peroxisomes can be identified (P). Original magnifications: a and b, ×7,850; c, 32,600.
Three months after transplantation, the morphological changes in the liver acini of the MG downstream of the transplanted ovarian tissue were still present. Moreover, an alteration in the architectural pattern of the hepatic tissue could be observed in some altered acini. The typical cell plate pattern of hepatocytes was replaced by thickened trabeculae consisting of more than two cell layers of hepatocytes (Figure 3d) ▶ . The proliferative activity in MG was found to be decreased when compared with the data at 3 weeks, but the difference between the MI and BrdU-LI of MG and that of the left part of the liver as well as that of the control groups at 3 months after transplantation was even more pronounced (Figure 5) ▶ . The long-term administration of toremifene resulted in an increase in hepatocytic proliferative activity (right and left part of the liver) when compared with CG6 and with the left part of the livers in the MG (Tables 4 and 5) ▶ ▶ .
Figure 5.
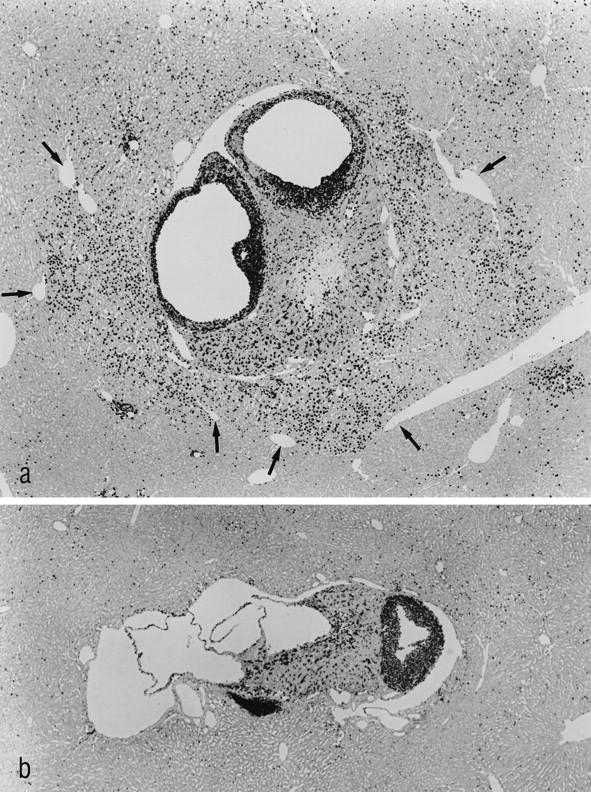
The immunohistochemical localization of BrdU-labeled nuclei demonstrates a strong proliferative activity of the transplant and of the surrounding hepatocytes in MG 3 months after transplantation (a). The border of the liver acini downstream of the transplants is sharply defined by the draining hepatic venules (arrows), demonstrating the acinar nature of the hyperproliferative areas. b: The transplant of a toremifene-treated animal 3 months after transplantation is found to proliferate, whereas the surrounding hepatocytes do not show any alteration in their proliferative activity. Shown are immunostains for BrdU (administered via s.c. implanted osmotic minipumps for 7 days). Original magnification: a and b, ×48.
Histochemical Alterations of Liver Acini Downstream of the Transplanted Ovarian Tissue
The enzyme histochemical pattern of the ovarian transplants did not differ from that of the untreated control ovary. One week after transplantation no differences in enzyme activities were found. The histochemical patterns of the altered liver acini at 3 weeks and 3 months after transplantation are summarized in Table 6 ▶ , and examples are shown in Figure 6 ▶ . The altered acini showed a slight increase in the activities of mG3PDH and GGT. The increase in GGT in the altered acini was present in zones 1 and 2, but not in zone 3. The activities of PHO, SYN, G6Pase, G6PDH, and PK were decreased. The activities of ME, SDH, COX, and AP were unchanged. Immunostains for TGFα and GST-P were negative in the altered acini. No quantitative changes in staining intensity or percentage of estrogen receptor positive hepatocytes could be observed in the altered liver acini when compared with those of control tissue.
Table 6.
Histochemical Pattern of Altered Liver Acini at 3 Weeks and 3 Months after Intraportal Transplantation of Ovarian Tissue in Ovariectomized Rats
| Basophilia | ↑↑ |
| Glycogen | ↓↓ |
| Fat | NC |
| Glycogen phosphorylase (PHO) | ↓↓ |
| Glycogen synthase (SYN) | ↓↓ |
| Glucose-6-phosphatase (G6Pase) | ↓ |
| Glucose-6-phosphate dehydrogenase (G6PDH) | ↓ |
| Pyruvat kinase (PK) | ↓ |
| Malic enzyme (ME) | NC |
| Mitochondrial glycerol-3-phosphate dehydrogenase (mG3PDH) | ↑ |
| Succinate dehydrogenase (SDH) | NC |
| Cytochrome c oxidase (COX) | NC |
| Acid phosphatase (AP) | NC |
| γ-Glutamyltransferase (GGT) | ↑ |
| Glutathion S-transferase, placental form (GST-P) | NC |
| Transforming growth factor α (TGFα) | NC |
For semiquantitative comparison of the altered acini with the unaltered tissue of the same specimen (internal control), five grades were used: NC, no change; ↑, increase; ↑↑, strong increase; ↓ decrease; ↓↓, strong decrease.
Figure 6.
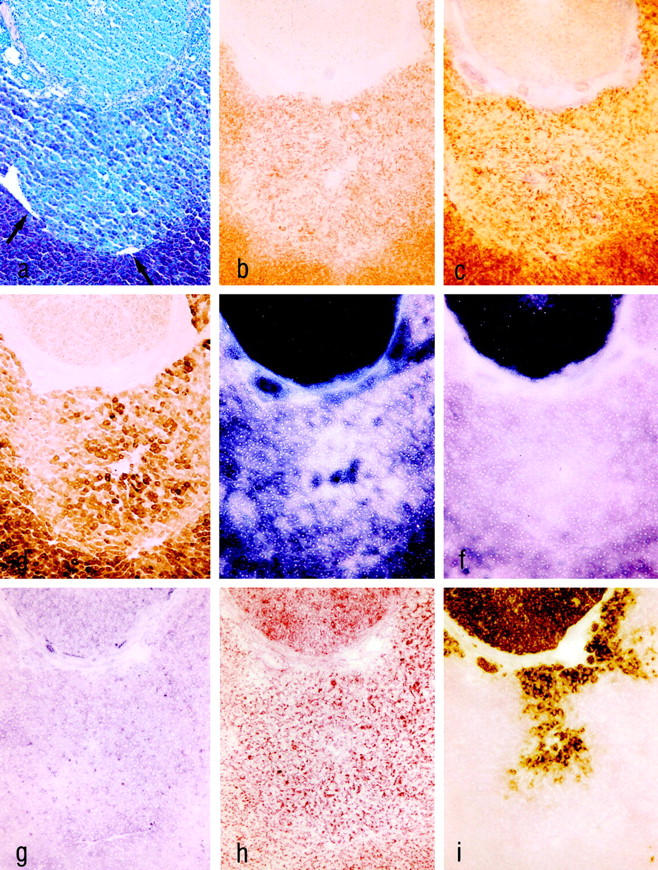
Serial cryostat sections of altered liver acini downstream of an ovarian transplant (upper part) in MG 3 weeks after transplantation. The draining hepatic venules are indicated by arrows in a. PAS reaction (a) demonstrates glycogen loss. Only the activities of mG3PDH (g) and GGT (i) were slightly increased, whereas the activities of SYN (b), PHO (c), G6Pase (d), and G6PDH (e) were decreased. The activities of ME (f) and AP (h) were unchanged. Original magnification, ×62.
Hepatocellular Neoplasms in the MG 18 Months after Transplantation
Eighteen months after transplantation, one of the six MG animals showed a hepatocellular adenoma 5 mm in size, located in the right part of the liver. Three animals exhibited highly differentiated hepatocellular carcinomas (HCCs). Two of the HCCs measured 3 cm in diameter and were restricted to the right part of the liver, and one HCC extended to the right, middle, and the left lobes of the liver (Figure 7) ▶ . All hepatocellular neoplasms showed a trabecular growth pattern. The cytoplasm of the tumor cells was amphophilic, sometimes containing areas of glycogen accumulation. The ovarian transplants were smaller than those found 3 months after transplantation. Oocytes were absent, and stromal cells contained many lipid droplets.
Figure 7.
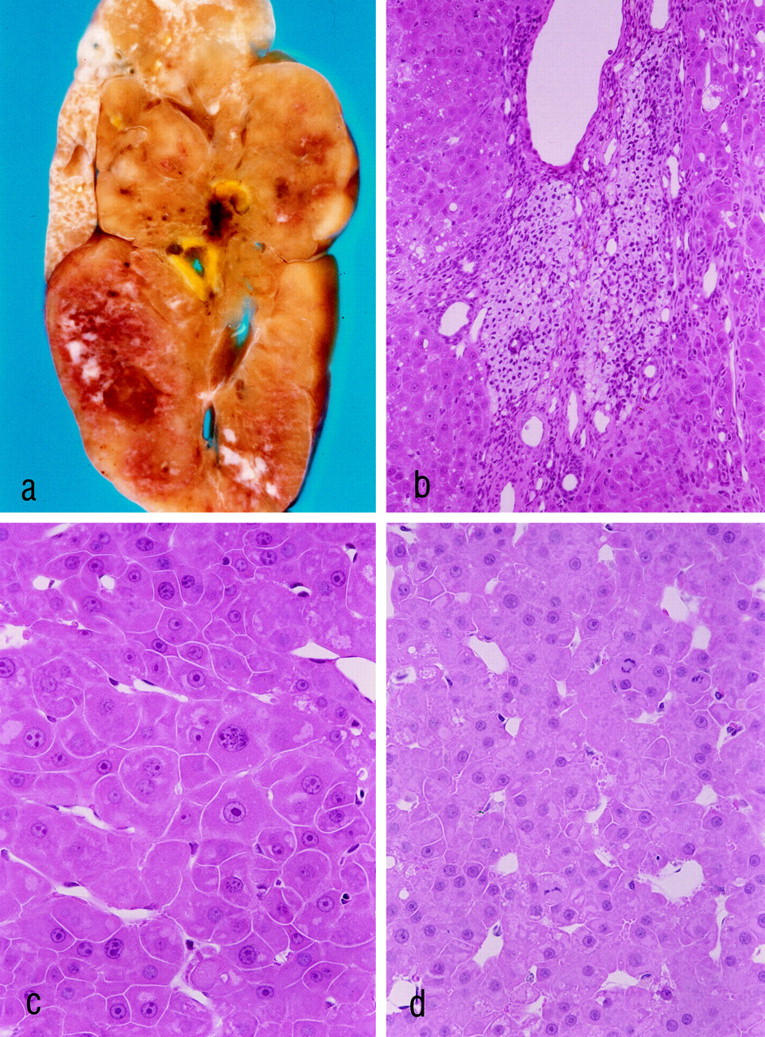
Hepatocellular carcinoma (HCC) 18 months after ovarian tissue transplantation (a–d). a–c: The same HCC, which measures 4 cm in diameter. At this time after transplantation all transplants consisted of luteinized theca cells. b: The transplant is surrounded by the HCC. c and d: The HCCs show a trabecular growth pattern. The tumor cells share some characteristics with the altered hepatocytes at 3 weeks and at 3 months after transplantation (compare with Figure 3 ▶ , b–d), ie, large nucleoli, cytoplasmic amphophilia, and sometimes small areas of glycogen accumulation. Mitotic figures are visible in d. a: Unstained liver slice after perfusion fixation. b–d: H&E stains. Original magnifications: a, ×3; b, ×180; c and d, ×360.
Discussion
The ovariectomy of the animals of MG and CG5 seems to be a required precondition for sufficient stimulation of the transplants by gonadotropins, 27,28 as demonstrated by the difference in morphological appearance of the transplants in the different groups, and by the strong increase in serum estradiol levels of MG and CG5 3 weeks after transplantation. In the case of CG3, which presents with elevated gonadotropin levels similar to those of CG1, but which lacks a lasting functional activity of the transplanted ovarian tissue, one can speculate that the male pattern of gonadotropin secretion does not stimulate the transplants in a sufficient manner. Interestingly, 3 months after transplantation the FSH levels of MG differ significantly from those of CG2, which can be regarded as “normal” levels, although estradiol levels of MG were already as high as those of CG2 3 weeks after transplantation. Because part of the hormones produced by the transplanted ovarian fragments can be assumed to become metabolized by the hepatocytes downstream, normal systemic levels of ovarian hormones as observed in MG can be maintained only when the transplants are stimulated to supranormal secretory activity. Thus it can be assumed that our model results in a local increase in estradiol concentrations confined to the liver acini downstream of the transplanted ovarian tissue, the extent of which even surpasses the metabolizing capacity of these acini.
Three weeks after transplantation the hepatocytes of the liver acini downstream of the transplanted ovarian tissue already show alterations in their morphology, their cell turnover, and their enzymic pattern. The observed increase in hepatocellular proliferation and, at the same time, in apoptotic elimination is a typical feature of preneoplastic liver foci. 29,30 A similar increase in cell turnover has been observed in glycogen-storing liver foci after pancreatic islet transplantation, which proceeded to hepatocellular adenomas and carcinomas after 8–22 months. 17 An increase in hepatocyte proliferation is a well-known effect of estrogens. Estrogens act as weak direct mitogens in the liver, probably via the steroid hormone receptor, 8,31 and as comitogens by enhancing the effects of EGF, HGF, and TGFα on hepatocytes. 9 As such an increase in proliferation is regularly found in models of hepatocarcinogenesis by using estrogens as carcinogenic agents, it has been proposed that estrogens exert their carcinogenic activity at least partly by enhancing hepatocellular proliferation according to the concept of nongenotoxic carcinogenesis. 14,32,33 Unfortunately, no report concerning the morphology of early hepatocellular lesions and hepatocellular tumors caused by synthetic estrogens was available.
The estrogen receptor antagonist toremifene blocked all morphological, proliferative, and cytochemical changes within the liver acini downstream of the transplants. It should be pointed out that the transplants in animals receiving toremifene were secreting estradiol to the same extent as the transplants in the MG. This shows that the alterations observed in this experiment were caused by estrogen receptor-mediated actions and not by conceivable effects of toxic estrogen metabolites generated in the liver, as has been postulated for the hepatocarcinogenic effects of synthetic estrogens. The fact that the hepatic foci observed downstream of the transplants in the MG exhibit a unique pattern of proliferative, morphological, and cytochemical alterations also suggests that these alterations are caused by specific hormonal actions. The alterations after intrahepatic transplantation of ovarian fragments differ in their morphology and their enzymic pattern from glycogenotic foci occurring after intrahepatic transplantation of pancreatic islets, 16,34 as well as from the amphophilic foci occurring after intrahepatic transplantation of thyroid tissue. 18 This demonstrates that transplants of different endocrine tissues induce different long-term patterns of hepatocellular alterations.
The characteristic H&E staining pattern resembles that of a well-known type of altered hepatocyte population, which is called an amphophilic focus. 35 This type of cell focus is mainly induced by peroxisome proliferators, eg, by hypolipidemic drugs and the adrenal steroid hormone dehydroepiandrosterone (DHEA). 36,37 Most peroxisome proliferators exert their actions through peroxisome proliferator-activated receptors, which belong to the receptor superfamily of steroid hormone receptors. 38,39
However, several important differences between the hepatocellular alterations observed in this experiment and amphophilic preneoplastic foci deserve consideration:
1. The peroxisome proliferation caused by the peroxisome proliferator DHEA is much more pronounced in perivenular hepatocytes, whereas amphophilic foci and hepatocellular adenomas develop almost exclusively in the vicinity of portal tracts, so that the proliferation of peroxisomes itself does not seem to be an important early event in neoplastic development elicited by peroxisome proliferators. 36
2. The alterations of enzyme activities in the altered liver acini differ in some respects from those observed in amphophilic cell foci induced by peroxisome proliferators. They share a decrease in glycogen, PHO, SYN, PK, and G6PDH; in basophilia; and in the activity of mG3PDH. Moreover, neither one expresses GST-P. However, in the estrogen-induced altered foci, the activities of G6Pase, ME, and SDH were reduced, and those of AP and COX were unchanged, whereas in amphophilic preneoplastic foci induced by DHEA these activities were found to be increased. 21
Thus, although the estrogen-induced altered liver acini and preneoplastic amphophilic foci produced by peroxisome proliferators share a distinct morphological appearance, they differ in important histochemical aspects. Moreover, the specific pattern of alterations of enzymic activities caused by intrahepatic transplantation of ovarian tissue does not resemble any pattern that has been observed in a model of hepatocarcinogenesis so far. Consequently, the alterations found in this experiment represent a novel subtype of the morphologically defined group of amphophilic cell foci, which exhibit a unique and as yet unknown pattern of enzymic alterations.
The occurrence of one hepatocellular adenoma and three HCCs in the six MG animals 18 months after intrahepatic ovarian tissue transplantation suggests a causal association between the local long-term hyperestrogenism in the liver acini downstream of the transplants and the development of hepatocellular neoplasms. Moreover, this represents an argument for the preneoplastic nature of the altered liver acini described in this study. Nevertheless, it has to be pointed out that these six animals represent only a preliminary experiment lacking control groups and the in-depth analysis of the tumors and in-between stages during the neoplastic progression.
In conclusion, we established a new experimental model that permits the investigation of local effects of natural estrogens on hepatocytes. The observed alterations downstream of the transplanted ovarian tissue resemble in some but not in all respects preneoplastic amphophilic cell foci induced by peroxisome proliferators. This is the first report on hyperproliferative and morphologically altered foci induced by natural ovarian hormones that suggests a possible tumorigenic action of natural estrogens on hepatocytes. A long-term study has been started to clarify whether the altered liver acini indeed progress to hepatocellular neoplasms and therefore represent true preneoplastic lesions.
Acknowledgments
The toremifene citrate used in this study was a gift from the Fareston Project, Orion Pharma (Turku, Finland). The skillful technical assistance of Sybille Wolf-Kümmeth, Katrin Kählcke, Jörg Bedorf, Mathilde Hau-Liersch, and Inge Heim is gratefully acknowledged. We thank Gerrit Klemm and Björn Fehmers for their excellent photographic work and Dr. Matthias Evert for critical reading of the manuscript.
Footnotes
Address reprint requests to Dr. Frank Dombrowski, Pathologisches Institut der Universität Bonn, Sigmund-Freud-Strasse 25, D-53127 Bonn, Germany. E-mail: dombi@mailer.meb.uni-bonn.de.
Supported by the Deutsche Forschungsgemeinschaft (grants DO 622/1-1 and DO 622/1-3).
References
- 1.Forman D, Doll R, Peto R: Trends in mortality from carcinoma of the liver and the use of oral contraceptives. Br J Cancer 1983, 48:349-354 [DOI] [PMC free article] [PubMed] [Google Scholar]
- 2.Henderson BE, Preston-Martin S, Edmonson HA, Peters RL, Pike MC: Hepatocellular carcinoma and oral contraceptives. Br J Cancer 1983, 48:437-440 [DOI] [PMC free article] [PubMed] [Google Scholar]
- 3.Neuberger J, Nunnerley HB, Davis M, Portman B, Laws JW, Williams R: Oral contraceptive-associated liver tumors: occurrence of malignancy and difficulties in diagnosis. Lancet 1980, 1:273-276 [DOI] [PubMed] [Google Scholar]
- 4.Taper HS: The effect of estradiol-17-phenylpropionate and estradiol benzoate on N-nitrosomorpholine-induced liver carcinogenesis in ovariectomized female rats. Cancer 1978, 42:462-467 [DOI] [PubMed] [Google Scholar]
- 5.Ghia M, Mereto E: Induction and promotion of gammaglutamyltranspeptidase-positive foci in the liver of female rats treated with ethinyl estradiol, clomiphene, tamoxifen and their associations. Cancer Lett 1989, 46:195-202 [DOI] [PubMed] [Google Scholar]
- 6.Yager JD, Yager R: Oral contraceptive steroids as promoters of hepatocarcinogenesis in female Sprague-Dawley rats. Cancer Res 1980, 40:3680-3685 [PubMed] [Google Scholar]
- 7.: WHO: Oral contraceptives and neoplasia. WHO Tech Rep Ser 1992, 817:22-25 [PubMed] [Google Scholar]
- 8.Shi YE, Yager JD: Effects of the liver promoter ethinyl estradiol on epidermal growth factor-induced DNA synthesis and epidermal growth factor receptor levels in cultured rat hepatocytes. Cancer Res 1989, 49:3574-3580 [PubMed] [Google Scholar]
- 9.Ni N, Yager JD: Comitogenic effects of estrogens on DNA synthesis induced by various growth factors in cultured female rat hepatocytes. Hepatology 1994, 19:183-192 [PubMed] [Google Scholar]
- 10.Shinozuka H: Stimulation of liver cell growth by direct mitogens. Bannasch P Kanduc D Papa S Tager JM eds. Cell Growth and Oncogenesis. 1998, :pp 213-225 Birkhäuser Verlag, Basel [Google Scholar]
- 11.Hard G, Iatropoulos M, Jordan K, Radi L, Kaltenberg O, Imondi A, Williams G: Major difference in the hepatocarcinogenicity and DNA adduct forming ability between toremifene and tamoxifen in female Crl: CD(BR) rats. Cancer Res 1993, 53:4534-4541 [PubMed] [Google Scholar]
- 12.Liehr J: Genotoxic effects of estrogens. Mutat Res 1990, 238:269-276 [DOI] [PubMed] [Google Scholar]
- 13.Yager JD, Campbell H, Longnecker D, Roebuck B, Benolt MC: Enhancement of hepatocarcinogenesis in female rats by ethinyl estradiol and mestranol but not estradiol. Cancer Res 1984, 44:3862-3869 [PubMed] [Google Scholar]
- 14.Yager DY, Roebuck BD, Paluszcyk TL, Memoli VA: Effects of ethinyl estradiol and tamoxifen on liver DNA turnover and new synthesis and appearance of gamma glutamyl transpeptidase-positive foci in female rats. Carcinogenesis 1986, 7:2007-2014 [DOI] [PubMed] [Google Scholar]
- 15.Dragan YP, Vaughan J, Jordan VC, Pitot HC: Comparison of the effects of tamoxifen and toremifene on liver and kidney tumor promotion in female rats. Carcinogenesis 1995, 16:2733-2741 [DOI] [PubMed] [Google Scholar]
- 16.Dombrowski F, Lehringer-Polzin M, Pfeifer U: Hyperproliferative liver acini after intraportal islet transplantation in streptozotocin-induced diabetic rats. Lab Invest 1994, 71:688-699 [PubMed] [Google Scholar]
- 17.Dombrowski F, Bannasch P, Pfeifer U: Hepatocellular neoplasms induced by low-number islet transplants in streptozotocin diabetic rats. Am J Pathol 1997, 150:1071-1087 [PMC free article] [PubMed] [Google Scholar]
- 18.Dombrowski F, Klotz L, Hacker HJ, Li Y, Klingmüller D, Brix C, Herzog V, Bannasch P: Hyperproliferative hepatocellular alterations after intra-portal transplantation of thyroid follicles. Am J Pathol 2000, 156:99-113 [DOI] [PMC free article] [PubMed] [Google Scholar]
- 19.Eldrige SR, Tilbury LF, Goldsworthy TL, Butterworth BE: Measurement of chemically induced cell proliferation in rodent liver and kidney: a comparison of 5-bromo-2′-desoxyuridine and [3H]thymidine administered by injection or osmotic pump. Carcinogenesis 1990, 12:2245-2251 [DOI] [PubMed] [Google Scholar]
- 20.Hacker HJ, Grobholz R, Klimek F: Enzyme histochemistry and biochemical microanalysis of preneoplastic lesions. Prog Histochem Cytochem 1991, 23:61-72 [DOI] [PubMed] [Google Scholar]
- 21.Mayer D, Metzger C, Leonetti P, Beier K, Benner A, Bannasch P: Differential expression of key enzymes of energy metabolism in preneoplastic and neoplastic rat liver lesions induced by N-nitrosomorpholine and dehydroepiandrosterone. Int J Cancer 1998, 79:232-240 [DOI] [PubMed] [Google Scholar]
- 22.Lojda Z, Grossau R, Schiebler TH: Enzyme Histochemistry. 1979. Springer Verlag, Berlin, Heidelberg, New York,
- 23.Hacker HJ, Moore MA, Mayer D, Bannasch P: Correlative histochemistry of some enzymes of carbohydrate metabolism in preneoplastic and neoplastic lesions in the rat liver. Carcinogenesis 1982, 3:1265-1272 [DOI] [PubMed] [Google Scholar]
- 24.Bannasch P, Hacker HJ, Klimek F, Mayer D: Hepatocellular glycogenosis and related pattern of enzymatic changes during hepatocarcinogenesis. Adv Enzyme Regul 1984, 22:97-121 [DOI] [PubMed] [Google Scholar]
- 25.Perry B, McCracken A, Furr B, MacFie H: Separate roles of androgen and estrogen in the manipulation of growth and efficiency of food utilization in female rats. J Endocrinol 1979, 81:35-48 [DOI] [PubMed] [Google Scholar]
- 26.Mandl AM: The phases of the oestrous cycle in the adult white rat. J Exp Biol 1952, 28:576-592 [Google Scholar]
- 27.Biskind GR, Biskind MS: Atrophy of ovaries transplanted to the spleen in unilaterally castrated rats: proliferative changes following subsequent removal of the intact ovary. Science 1948, 108:137-138 [DOI] [PubMed] [Google Scholar]
- 28.Boe F, Togertsen O, Attramadal A: Tumours produced by intrasplenic or intrahepatic ovarian grafting. Acta Endocrinol (Copenh) 1954, 17:42-53 [PubMed] [Google Scholar]
- 29.Columbano A, Ledda-Columbano GM, Rao PM, Rajalakshmi S, Sarma DSR: Occurrence of cell death (apoptosis) in preneoplastic and neoplastic liver cells. Am J Pathol 1984, 116:441-446 [PMC free article] [PubMed] [Google Scholar]
- 30.Schulte-Hermann R, Timmermann-Trosiener I, Barthel G, Bursch W: DNA synthesis, apoptosis and phenotype expression as determinants of growth of altered foci in rat liver during phenobarbital promotion. Cancer Res 1990, 50:5127-5135 [PubMed] [Google Scholar]
- 31.Columbano A, Shinozuka H: Liver regeneration versus direct hyperplasia. FASEB J 1996, 10:1118-1128 [DOI] [PubMed] [Google Scholar]
- 32.Vickers AEM, Nelson K, McCoy Z, Lucier GW: Changes in estrogen receptor, DNA-ploidy and estrogen metabolism in rat hepatocytes during a 2-stage model for hepatocarcinogenesis using ethinylestradiol as the promoting agent. Cancer Res 1989, 49:6512-6520 [PubMed] [Google Scholar]
- 33.Mayol X, Neal GE, Davies R, Romero A, Domingo J: Ethinylestradiol-induced cell proliferation in rat liver. Involvement of specific populations of hepatocytes. Carcinogenesis 1992, 13:2381-2388 [DOI] [PubMed] [Google Scholar]
- 34.Dombrowski F, Filsinger E, Bannasch P, Pfeifer U: Altered liver acini induced in diabetic rats by portal vein islet isografts resemble preneoplastic hepatic foci in their enzymic pattern. Am J Pathol 1996, 148:1249-1256 [PMC free article] [PubMed] [Google Scholar]
- 35.Bannasch P: Pathogenesis of hepatocellular carcinoma: sequential cellular, molecular and metabolic changes. Prog Liver Dis 1996, 14:161-197 [PubMed] [Google Scholar]
- 36.Metzger C, Mayer D, Hoffmann H, Bocker T, Hobe G, Benner A, Bannasch P: Sequential appearance and ultrastructure of ampho-philic cell foci, adenomas and carcinomas in the liver of male and female rats treated with dehydroepiandrosterone (DHEA). Toxicol Pathol 1995, 23:591-605 [DOI] [PubMed] [Google Scholar]
- 37.Weber E, Moore MA, Bannasch P: Enzyme histochemical and mor-phological phenotype of amphophilic foci and amphophilic/tigroid cell neoplastic nodules in rat liver after combined treatment with dehydroepiandrosterone and N-nitrosomorpholine. Carcinogenesis 1988, 9:1049-1054 [DOI] [PubMed] [Google Scholar]
- 38.Mangelsdorff DJ, Thummel C, Beato M, Herrlich P, Schütz G, Umesono K, Blumberg B, Kastner P, Mark M, Chambon P, Evans RM: The nuclear receptor superfamily: the second decade. Cell 1995, 83:835-839 [DOI] [PMC free article] [PubMed] [Google Scholar]
- 39.Reddy JK, Azarnoff DL, Hignite DD: Hypolipidemic hepatic peroxisome proliferators form a novel class of chemical carcinogens. Nature 1980, 283:397-400 [DOI] [PubMed] [Google Scholar]
- 40.Richardson KC, Jarret L, Finke EH: Embedding in epoxy resins for ultrathin sectioning in electron microscopy. Stain Technol 1960, 35:313-325 [DOI] [PubMed] [Google Scholar]