

Abstract
Objective:
We investigated whether proteomic analysis of the low molecular weight region of the serum proteome could predict histologic response of locally advanced rectal cancer to neoadjuvant radiochemotherapy (RCT).
Summary Background Data:
Proteomic analysis of serum is emerging as a powerful new modality in cancer, in terms of both screening and monitoring response to treatment. No study has yet assessed its ability to predict and monitor the response of rectal cancer to RCT.
Methods:
Sequential serum samples from 20 patients undergoing RCT were prospectively collected. Time points sampled were as follows: pretreatment, 24/48 hours, 1 week, 2 weeks, 3 weeks, 5 weeks (last day of RCT), and presurgery. Response to treatment was measured using a 5-point tumor regression grade (TRG) based on the degree of residual tumor to fibrosis. All serum samples were analyzed in duplicate using surface-enhanced laser desorption/ionization-time of flight mass spectrometry (SELDI-TOF-MS). Support vector machine (SVM) analysis of spectra was used to generate a predictive algorithm for each time point based on proteins that were maximally differentially expressed between good and poor responders. This algorithm was then tested using leave-one-out cross validation.
Results:
In total, 230 spectra were generated representing all available time points from 9 good responders (TRG 1+2) and 11 poor responders (TRG 3–5). SVM analysis indicated that changes within the serum proteome at the 24/48 hours time point into treatment provided optimal classification accuracy. In more detail, a cohort of 14 protein peaks were identified that collectively differentiated between good and poor responders, with 87.5% sensitivity and 80% specificity.
Conclusions:
Serum proteomic analysis may represent an early response predictor in multimodal treatment regimens of rectal cancer. These data suggest that this novel, minimally invasive modality may be a useful adjunct in the multimodal management of rectal cancer, and in the design of future clinical trials.
SELDI-TOF analysis was performed on 115 sequential serum samples taken from 20 patients with rectal cancer during the course of neoadjuvant radiochemotherapy. Biostatistical analysis of spectra generated over time from good and poor responders at each time point identified 14 key protein differences. This cohort of markers could be used to predict response with 87.5% sensitivity and 80% specificity after 24 and 48 hours of treatment.
Neoadjuvant radiochemotherapy (RCT), followed by rectal cancer resection encompassing a total mesorectal excision, is increasingly accepted as the gold standard for patients with clinical T3/T4 rectal tumors.1–4 Compared with adjuvant regimens, neoadjuvant approaches are associated with a reduced rate of local recurrence and improved overall survival.2,5–10
The benefit of neoadjuvant therapy is most marked where a complete pathologic response (pCR) is achieved. Currently, approximately 10% to 30% of patients undergo pCR, characterized by complete sterilization of all tumor cells in the resected surgical specimen.11,12 The remainder demonstrate a spectrum of residual disease varying from a few scattered tumor cells to large islands of radioresistant tumor cells.13 It is not understood why tumors of identical pretreatment stage, undergoing identical neoadjuvant regimens, respond differently to RCT; therefore, all patients undergo empirical treatment. Moreover, RCT is expensive and time-consuming and increases both the perioperative morbidity and the risk of developing secondary tumors.4,14–16 The ability to identify and select only patients sensitive to or resistant to RCT, ideally before or in the early stages of treatment, would confer a major clinical advance, both in terms of the optimization of current treatment regimens, and the development of clinical trials.
A further potential value for response predictors is highlighted by a recent seminal publication by Habr-Gama et al.17 In this study, patients with rectal cancer who underwent a complete clinical response to RCT were managed by observation alone rather than surgery. This cohort had lower rates of local recurrence and increased 5-year survival compared with patients with residual disease that underwent surgery. In this study, clinical assessment did not truly reflect pathologic response as 8.3% of patients deemed incomplete responders were found to have undergone pCR and a further 23% had pT1 disease. The inaccuracy of clinical response in predicting pathologic response has been identified in several other published reports.18,19 Identification of accurate means of response prediction using molecular markers would enable the true utility and benefits of conservative management after RCT to be evaluated. Furthermore, while the concept of conservative management after RCT has not previously been described for locally advanced rectal cancer, it is now an established first-line management in other malignancies such as squamous carcinoma of the anus.20,21
In recent years, the need for predictive markers to guide therapy, coupled with an increasing knowledge of molecular medicine, has prompted the analysis of archival pretreatment tumor biopsies from patients undergoing RCT. This work, to date, has mainly focused on identifying inherent molecular differences between good and poor responders using immunohistochemistry (IHC). The majority of studies have focused on single or small groups of molecular targets, most commonly mutations in the p53 gene or its downstream effector molecules. Results from these studies, however, have been largely inconclusive and still no clinically useful marker has been described.22,23
In recent months, Ghadimi et al reported on global gene expression profiles derived from fresh pretreatment rectal cancer biopsies using cDNA microarrays.24 In this case, a combination of 54 genes was identified, which showed significantly different expression in the pretreatment biopsy tissues of good versus poor responders. The ability for the combination of these genes to predict response was then assessed using leave-one-out cross-validation. Tumor behavior was correctly predicted on an individual patient basis with 78% sensitivity and 80% specificity. This study is important, as it is the first in rectal cancer to predict response on an individual patient basis using genomic profiling, an approach that may more accurately reflect the multiplicity of pathways controlling radiation response.
A potential alternative to tissue-based methods of response prediction is analysis of the low molecular weight region of the serum proteome using surface-enhanced laser desorption/ionization time of flight-mass spectrometry (SELDI-TOF-MS). This technique is based on the premise that blood becomes endowed with an archive of protein-based histologic information as it circulates through the body.25 This is thought to represent byproducts of cellular metabolism such as cell-cell signaling molecules and species shed from dead or dying cells.26 SELDI-TOF-MS can detect multiple proteins and peptides in biologic samples based upon their time of flight down a vacuum chamber.27 Using data mining software, profiles of multiple protein patterns may be compared between test and control groups. The most common clinical example of this is the generation of specific proteomic patterns that allow discrimination of serum taken from patients with cancer or from healthy controls. In this role, it has been found to be capable of correctly identifying between groups with high sensitivity and specificity, being validated in many cancer subtypes including colorectal, lung, ovarian and breast cancer.28–31
Currently, SELDI-TOF-MS remains unassessed in the role of predicting response to radiation-based therapies. It may be ideally suited to this purpose as in contrast to tissue-based methods, it is minimally invasive and may be repeated at multiple time points through treatment. We report, herein, an investigation of SELDI-TOF-MS analysis of serum to predict and monitor tumor response in patients undergoing a standard multimodal protocol for rectal cancer.
METHODS
Patients and Ethics
Our protocol was passed by the ethics committee of the participating institutions. From July 2003 to October 2004, 20 consecutive patients were prospectively recruited. All patients gave fully informed consent. Pretreatment staging consisted of 1) thoracic and abdominal CT scanning and 2) pelvic MRI scanning in all patients. A subset of patients underwent transrectal ultrasound (TRUS) evaluation in addition to MRI to further define local disease. Any discrepancies between MRI and TRUS were discussed at multidisciplinary conferences and a final pretreatment stage was assigned to each patient according to the TNM classification.
Neoadjuvant Regimen
All patients were deemed suitable for RCT after discussion at a weekly multidisciplinary meeting. Each patient received an identical treatment regimen consisting of 45 Gy of radiotherapy, given in 25 fractions of 1.8 Gy delivered on 5 days for 5 weeks. Continuous IV 5-fluorouracil (225 mg/m2 per day) was given concurrently with radiotherapy via a syringe driver. Surgery was performed approximately 6 to 8 weeks after the last fraction of radiotherapy had been delivered.
Histopathologic Response
Diagnostic slides from resected specimens of all patients were retrieved. These included no less than 3 sections of the irradiated area per patient. A single pathologist blinded to patient identifying characteristics reassessed all sections. Response to RCT was assessed using the scoring system previously described by Mandard et al.13
This system grades response on a 5-point scale according to the relative amounts of residual tumor and fibrosis (Fig. 1). For analysis purposes in this study, patients with a TRG of 1 or 2 were deemed to have demonstrated a good response and those with a TRG of 3 to 5 a poor response.
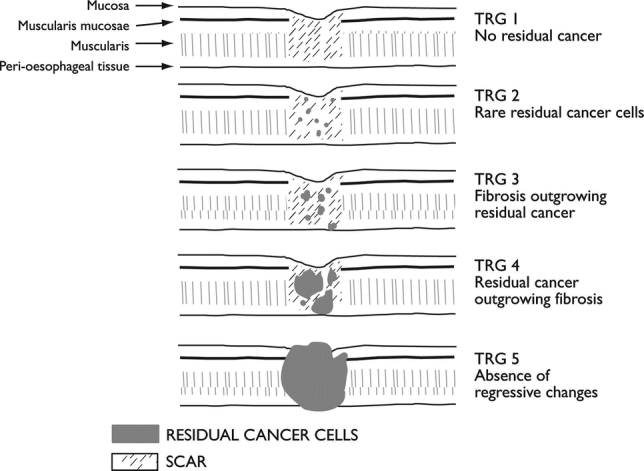
FIGURE 1. Mandard tumor regression grade used to classify response in this study.13
Serum Sampling
Serum sampling was done in accordance with standard operating procedures of the NCI/FDA Clinical Proteomics Program (Bethesda, MD). Briefly, all serum was collected using Z-clot activator serum tubes (Greiner Bio-One, Gloustershire, UK) immediately before irradiation. After clotting, samples were then centrifuged at 3000 rpm for 10 minutes and stored at −80°C in a designated surgical tissue biobank. Time points sampled through treatment were: pretreatment, immediate/early (24/48 hours), then at 1 week, 2 weeks, 3 weeks, and 5 weeks (before their final fraction of radiation). An additional sample was taken from patients the evening before surgery was performed.
SELDI-TOF-MS Analysis
Serum samples were thawed and added to a Q10 Protein Chip Array (strong anion exchange surface) using a robotic liquid handling workstation (Microlab STAR, Hamilton Company, Reno, NV). Chips were detected on the Protein Biologic System II (PBS-II) Chip Reader System (Ciphergen Biosystems, Freemont, CA) as previously described.30 The system was calibrated using protein standards, and all samples were run in random order with serum controls. All samples were normalized according to the total ion current of mass-to-charge ratios (m/z) between 2000 and 40,000 Da and qualified mass peaks (signal-to-noise ratio >3) with m/z between 2000 and 20,000 Da were automatically detected. Peak clusters were completed with second-pass peak selection (within a 0.3% mass window) and estimated peaks were added. These analyses were performed using ProteinChip Software, version 3.2.1, and its Biomarker Wizard utility (Ciphergen Biosystems).
Bioinformatic Analysis
Support vector machines (SVMs) were applied to binary-labeled training data (ie, responders and nonresponders) and were used to perform classification on median normalized, averaged duplicate spectra at each time point sampled.32,33 The SVM method was chosen over other classification methods, such as decision tree-based approaches, by virtue of the fact that it classifies data based upon their maximal separation using a three-dimensional hyperplane rather than finding the highest training accuracy. This process, therefore, minimizes the risk of chance error and overtraining of data34 and has been used in other studies involving serum proteomics.35 The misclassification rates of the classifier developed for each time point was then tested using a leave-one-out cross-validation strategy using GeneSpring 7.2 (Silicon Genetics, Redwood City, CA). The predictive strength of each peak was then evaluated for all peaks in the classifier. This is a measure of the association between class (ie, good/poor responder) and expression level of the peak and is the negative natural log of the peak's P value (P value derived by Fisher exact test). The greater the predictive strength of a peak, its ability to discriminate one class from another. This reflects the fact that not all peaks discriminate between the 2 groups equally but that they are collectively required to achieve the optimal separation between the groups.
RESULTS
Individual Protein Peaks Associated With Good and Poor Response
All 20 patients included in this study underwent the full course of RCT followed by surgical excision of their tumor. Demographic details and staging information are shown in Table 1. In total, 230 spectra were successfully obtained representing available time points from all patients run in duplicate. Before assessing the ability of proteomic profiles to predict response, an analysis of conventional pretreatment patient indices to predict response was performed using a Cox proportional hazards model (SPSS, version 12, SPSS Inc., Chicago, IL). This included patient age, sex, tumor distance from the anal verge, and TNM stage. Similar to other published reports in rectal cancer undergoing RCT, these variables were unable to predict response.23
TABLE 1. Patient, Tumor, and Response Characteristics

Preliminary proteomic analysis was performed using Biomarker Wizard software (Ciphergen Biosystems). This demonstrated multiple differential expression patterns of individual peaks both at individual time points and over the course of RCT. Analysis of individual time points revealed several peaks that were significantly differentially expressed between good and poor responders (P < 0.05). Here, positive markers of a good response, ie, protein peaks expressed at higher levels in good responder relative to poor responders (eg, m/z 4188), as well as negative markers of good response (eg, m/z 4159) were identified at all time points (examples given in Fig. 2).
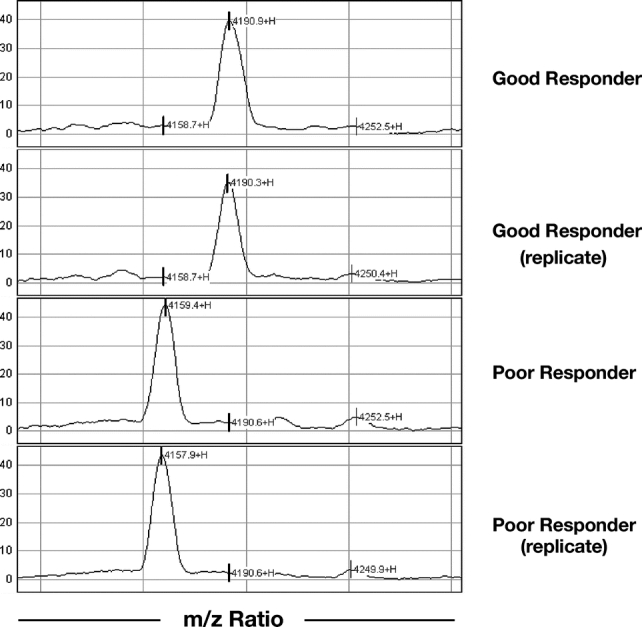
FIGURE 2. Representative portion of replicate patient spectra showing a positive marker (m/z 4159) and a negative marker (m/z 4188) of good response. Intensity, normalized to total ion current, is given on the vertical axis.
Time-course analysis of single peak expression over the course of RCT in individual patients was also performed. This revealed a multiplicity of protein responses to RCT comprising differential alterations, many of which could be directly correlated to RCT. Two compelling examples of these can be seen in seen in Figures 3 and 4. In Figure 3, the intensity of a peak at m/z 4159, previously identified as being associated with a poor response (Fig. 2), is seen at each time point through treatment in a single, poorly responsive patient. This peak is rapidly up-regulated until 1 week into treatment, wherein after it is steadily down-regulated. Of note, between the 6- to 8-week period between stopping RCT and surgery, this peak remains down-regulated compared with pretreatment levels. Figure 4 shows the intensity of a peak at m/z 3451 over time, again in a poorly responsive patient. Here, the intensity of this peak is seen to increase by over 3-fold during the course of RCT but between the 6- to 8-week period between stopping RCT and commencement of surgery, its expression fell back to its original pretreatment value. In addition to peaks, which showed time course-related changes to RCT, there were others that did not and whose intensity was constant throughout the course of treatment (data not shown).
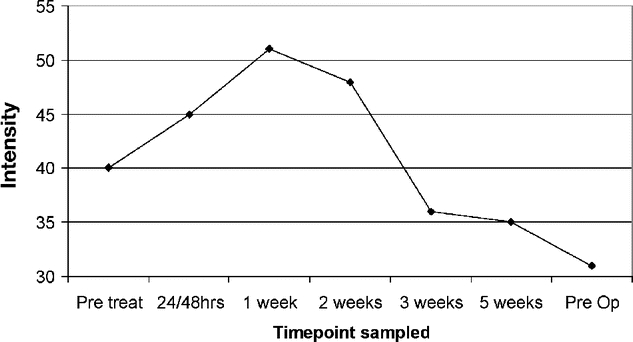
FIGURE 3. Time-course analysis of peak at m/z 4159 demonstrating marked treatment-induced alterations in expression level. Intensity, normalized to total ion current, is given on the vertical axis.
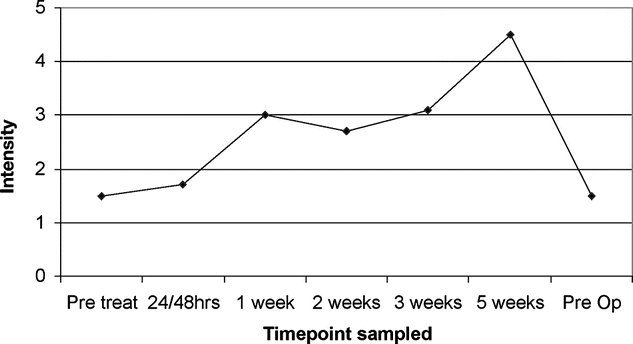
FIGURE 4. Time-course analysis of peak at m/z 3451 demonstrating >3-fold up-regulation during RCT, followed by return to pretreatment levels 6 weeks after stopping RCT. Intensity, normalized to total ion current, is given on the vertical axis.
Classification of Response to RCT Based on Protein Spectra
To determine whether a selection of spectral peaks could differentiate good from poor responders, SVM analysis was performed at each of the time points sampled. The performance of each classifier was then determined using leave-one-out cross validation. Briefly, the ability of a classifier to predict the response status of an individual, blinded patient sample based on the expression of the remaining patient samples was iteratively assessed and the optimal sensitivities and specificities determined. These are shown for each time point in Table 2. The greatest classification accuracy was achieved using serum from 18 patients sampled 24/48 hours into treatment, where prediction of response could be performed with a sensitivity of 87.5% and a specificity of 80%.
TABLE 2. Optimal Performance of SVMs at Each Time Point

This was achieved using a 14-peak classifier comprising 7 positive and 7 negative markers of good response to RCT (Fig. 5). The majority of these detected peaks were of low molecular weight: 10 of 14 (71%) had m/z values of <5000 Da and a further 3 (21%) had m/z values of <10,000 Da. While some degree of discrimination between response groups could be obtained by SVM at other time points, its accuracy was too poor for clinical utility (Table 2).
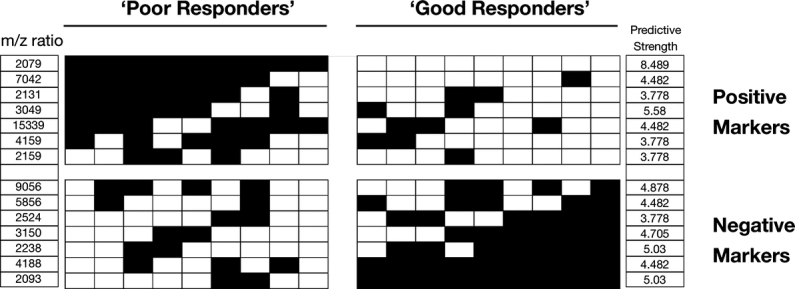
FIGURE 5. This shows the ability of 14 “key” peaks to identify good and poor responders at the 24- and 48-hour time point. Vertical columns represent individual patient response profiles; rows represent individual predictive peaks. Shading represents mean-normalized expression values of the signal for a peak across the time points assessed. Black boxes indicate a higher than mean signal for that peak and vice versa. The predictive strength of each peak, derived from the negative natural log of its P value, is also indicated.
DISCUSSION
In this study, serial SELDI-TOF-MS serum profiling was performed in 20 patients with rectal cancer undergoing neoadjuvant RCT. Pretreatment samples were unable to predict response, but serum samples taken 24/48 hours into treatment could predict the ultimate pathologic response with 87.5% sensitivity and 80% specificity based on a pattern of 14 differentially expressed proteins.
The finding may be clinically important as, to date, most studies that have aimed to predict response to RCT in rectal cancer have used pretreatment tissue biopsies.36 Biopsy methods have 2 implicit suggestions: first, that the small portion of tumor sampled is representative of the tumor biology as a whole; and second, that molecular expression at this time point best represents how the tumor will subsequently respond. Increasing evidence suggests that there is a dynamic response to cytotoxic therapy within tumors and that important changes in gene expression occur in the initial stages of treatment. In a mouse model, Wang et al have recently demonstrated that total body irradiation induces the expression of the transcription factor nuclear factor κB (NFκB) in intestinal epithelial cells in a time-dependent manner.37 They found that an initial rise and fall in NFκB activity 2 hours after radiation exposure occurred followed by a subsequent rise in levels that persisted for up to 24 hours. This observation is important as NFκB is known to induce the expression of many molecules capable of regulating cell survival. We have previously identified that endogenous nuclear NFκB expression in pretreatment biopsies can predict response of esophageal tumors to neoadjuvant, multimodal therapy,38 and previous studies have shown that inhibition of NFκB activation increases radiation-induced apoptosis and cellular radiosensitivity in colorectal cancer cell lines.39 Rodel et al,40 in a colorectal cell line model, demonstrated a marked up-regulation of the apoptosis inhibitor survivin 48 hours after cell irradiation in radioresistant cells, associated with reduced levels of cellular apoptosis. This was in stark contrast to radiosensitive cells where survivin expression remained unchanged. Buchholz et al analyzed sequential core biopsies from 5 patients with breast cancer undergoing neoadjuvant chemotherapy.41 Biopsies were taken pretreatment and 24 and/or 48 hours after treatment and analyzed using cDNA microarrays. This study identified significant changes in transcriptional response in patients during chemotherapy, and these changes were associated with gene clustering that was distinct in patients with a good or poor response.
This evidence therefore suggests that the early time point after initiation of cytotoxic therapy may potentially be even more important than pretreatment sampling because transcriptional profiles of molecules involved in radio-responsiveness have become established. Serial assessment of molecular tumor profiles, rather than reliance purely on pretreatment tumor biopsies, may therefore ultimately prove to be the most informative means of predicting response and understanding endogenous mechanisms of tumor radioresistance. If this hypothesis were correct, it would favor a move away from conventional tissue biopsy, or repeated endoscopy and biopsy, which is invasive and often distressing for patients. An alternative means of evaluating patients via proteomic analysis of serum via SELDI-TOF-MS has considerable appeal, as serum sampling is minimally invasive and can easily be repeated at multiple time points throughout treatment.
This study highlights the potential utility of SELDI-TOF-MS analysis as a clinical response prediction tool. Not only does it predict response after the first or second dose of radiation, but it does so on an individual patient basis with high sensitivity and specificity based on a combination of 14 key proteomic differences. This is in contrast to previous immunohistochemically based studies where statistically significant differences in markers have been identified between good and poor response groups but have not been assessed in a prospective manner.42 Analysis of the pretreatment serum proteome was not sufficient of itself in this study as, although 12 proteins were differentially expressed between good and poor responders (P < 0.05), they were unable to predict response on cross validation (data not shown). As the radiation response is likely to be governed by many interacting molecular pathways, it may be that only techniques such as SELDI-TOF-MS, capable of simultaneously detecting multiple markers, are able to accurately predict response at an individual level.
There is increasing evidence that serum proteomic analysis will ultimately prove to be a valuable clinical tool.43 There are several important aspects of experimental design, however, including identical sample preparation and treatment protocols, checks of sensitivity and reproducibility between runs, and using robotic instrumentation to increase precision that must be adhered to if meaningful interpretation of results and interlaboratory comparison are to be made.44 We addressed these issues in our study in several ways by strict adherence to established NCI standard operating procedures. Specifically, all serum was collected in additive-free tubes immediately before each fraction of radiation was given. A fresh vein was used on each occasion and centrifugation and storage of serum at −80°C was always performed in less than 2 hours. To avoid pipetting inaccuracy, chip preparation and serum application were performed using a robotic liquid handling workstation and, in each run, serum samples were run in random order on chips and in duplicate.
One of the main focuses of our laboratory is currently the expansion and validation of these data. Despite our attention to detail in every aspect of this study, it is imperative that we are able to replicate our results on a further cohort of patients not used to derive our original discriminating model. As such, all patients undergoing RCT at our institution are being invited to participate in this study, and serum is still being actively collected. We anticipate that our current classifier will still be able to correctly predict response in this expanded group of patients; however, the ultimate test of its robustness and clinical applicability would require multicenter sample accrual and processing.
The biologic processes governed by the 14 peaks identified in this study are unclear. We hypothesize that they most likely represent pro/antiapoptosis signaling factors derived from tumors as part of their initial response to radiation. Increasing evidence suggests that apoptosis is an integral mechanism for tumor radiosensitivity.45–48 Studies in rectal cancer have already shown that high levels of apoptosis in pretreatment biopsies may correlate with a good response to radiotherapy.49 This hypothesis is supported by temporal assays of circulating nucleosomes, elementary units of chromatin released into the circulation in situations of enhanced apoptosis, in the sera of patients during radiation and chemotherapy. Nucleosome levels reach maximum values at 48 to 72 hours in the serum of patients receiving radiotherapy for pancreatic cancer and chemotherapy for colorectal cancer.50,51
SELDI-TOF-MS profiling may offer other clinical possibilities. One of these is the ability to identify and sequence the proteins or peptides responsible for predictive peaks. This in turn may aid the discovery of specific mediators and pathways that are driving radiation response, facilitating the development of novel pharmacological therapies. A recent publication by the Human Proteome Organisation Plasma Proteome Project emphasizes this capability and its consistency across multiple geographic sites.52 Here, aliquots of reference serum and plasma samples were analyzed by 8 different laboratories worldwide. Data from 5 sites passed preliminary quality assurance tests and among these, a high correlation was found between spectra generated. Furthermore, a peak at m/z 9200 was consistently purified and identified in samples originating from these 5 sites using mass fingerprinting and MS-MS analysis.
CONCLUSION
This study is the first to our knowledge to use SELDI-TOF-MS to predict outcome after RCT for rectal cancer. It supports the thesis that the analysis of dynamic tumor responses as opposed to the focus on pretreatment biopsies may be a critical and largely overlooked predictive tool. It is becoming apparent that SELDI-TOF-MS is a stable and reproducible platform that enables secondary protein purification and identification. It may thus provide a more specific understanding of the molecular basis of resistance to radiation and cytotoxic therapy may be gained, allowing for the creation of tailor-made cancer therapy. The data from this study suggest that SELDI-TOF-MS has significant promise toward a better understanding and novel clinical trials in the multimodal management of rectal cancer.
ACKNOWLEDGMENTS
The authors thank Mr. Paul Quinlan for his extensive help and patience in the preparation of figures for the manuscript; Ms. Eleanor for her dedication, help, and support in collecting tissue samples; Ms. Sally Ruckers and Dr. Gordon Whiteley for their assistance in performing SELDI-TOF-MS analyses; the staff at St. Luke's Hospital for their patience and assistance throughout this study; and Dr. Donal Brennan for his assistance in the statistical analysis of aspects of our data.
Footnotes
Supported by the Health Research Board of Ireland and Cancer Research Ireland.
Emanuel F. Petricoin and Lance A. Liotta are co-inventors on technologies presented and employed during the work for this manuscript. These patents and pending patents are assigned to either the U.S. government or George Mason University. By law they are entitled to receive royalties on any license taken.
Reprints: John V. Reynolds, FRCSI, Department of Surgery, St. James's Hospital, Dublin 8, Ireland. E-mail: reynoljv@tcd.ie.
REFERENCES
- 1.Sauer R, Becker H, Hohenberger W, et al. Preoperative versus postoperative chemoradiotherapy for rectal cancer. N Engl J Med. 2004;351:1731–1740. [DOI] [PubMed] [Google Scholar]
- 2.Habr-Gama A, Perez RO, Kiss DR, et al. Preoperative chemoradiation therapy for low rectal cancer: impact on downstaging and sphincter-saving operations. Hepatogastroenterology. 2004;51:1703–1707. [PubMed] [Google Scholar]
- 3.Crane CH, Skibber JM, Feig BW, et al. Response to preoperative chemoradiation increases the use of sphincter-preserving surgery in patients with locally advanced low rectal carcinoma. Cancer. 2003;97:517–524. [DOI] [PubMed] [Google Scholar]
- 4.Rullier E, Goffre B, Bonnel C, et al. Preoperative radiochemotherapy and sphincter-saving resection for T3 carcinomas of the lower third of the rectum. Ann Surg. 2001;234:633–640. [DOI] [PMC free article] [PubMed] [Google Scholar]
- 5.Wheeler JM, Dodds E, Warren BF, et al. Preoperative chemoradiotherapy and total mesorectal excision surgery for locally advanced rectal cancer: correlation with rectal cancer regression grade. Dis Colon Rectum. 2004;47:2025–2031. [DOI] [PubMed] [Google Scholar]
- 6.Guillem JG, Chessin DB, Cohen AM, et al. Long-term oncological outcome following preoperative combined modality therapy and total mesorectal excision of locally advanced rectal cancer. Ann Surg. 2005;241:829–836. [DOI] [PMC free article] [PubMed] [Google Scholar]
- 7.Bouzourene H, Bosman FT, Seelentag W, et al. Importance of tumor regression assessment in predicting the outcome in patients with locally advanced rectal carcinoma who are treated with preoperative radiotherapy. Cancer. 2002;94:1121–1130. [PubMed] [Google Scholar]
- 8.Garcia-Aguilar J, Hernandez de Anda E, Sirivongs P, et al. A pathologic complete response to preoperative chemoradiation is associated with lower local recurrence and improved survival in rectal cancer patients treated by mesorectal excision. Dis Colon Rectum. 2003;46:298–304. [DOI] [PubMed] [Google Scholar]
- 9.Habr-Gama A, Perez RO, Nadalin W, et al. Long-term results of preoperative chemoradiation for distal rectal cancer correlation between final stage and survival. J Gastrointest Surg. 2005;9:90–101. [DOI] [PubMed] [Google Scholar]
- 10.Theodoropoulos G, Wise WE, Padmanabhan A, et al. T-level downstaging and complete pathologic response after preoperative chemoradiation for advanced rectal cancer result in decreased recurrence and improved disease-free survival. Dis Colon Rectum. 2002;45:895–903. [DOI] [PubMed] [Google Scholar]
- 11.Reerink O, Karrenbeld A, Plukker JT, et al. Molecular prognostic factors in locally irresectable rectal cancer treated preoperatively by chemo-radiotherapy. Anticancer Res. 2004;24:1217–1221. [PubMed] [Google Scholar]
- 12.Gambacorta MA, Micciche F, Corvari B, et al. Biological factors and therapeutic modulation in rectal cancer radiotherapy. Rays. 2002;27:219–222. [PubMed] [Google Scholar]
- 13.Mandard AM, Dalibard F, Mandard JC, et al. Pathologic assessment of tumor regression after preoperative chemoradiotherapy of esophageal carcinoma: clinicopathologic correlations. Cancer. 1994;73:2680–2686. [DOI] [PubMed] [Google Scholar]
- 14.Van Den Brink M, Van Den Hout WB, Stiggelbout AM, et al. Cost-utility analysis of preoperative radiotherapy in patients with rectal cancer undergoing total mesorectal excision: a study of the Dutch Colorectal Cancer Group. J Clin Oncol. 2004;22:244–253. [DOI] [PubMed] [Google Scholar]
- 15.Birgisson H, Pahlman L, Gunnarsson U, et al. Occurrence of second cancers in patients treated with radiotherapy for rectal cancer. J Clin Oncol. 2005;23:6126–6131. [DOI] [PubMed] [Google Scholar]
- 16.Dahlberg M, Stenborg A, Pahlman L, et al. Cost-effectiveness of preoperative radiotherapy in rectal cancer: results from the Swedish Rectal Cancer Trial. Int J Radiat Oncol Biol Phys. 2002;54:654–660. [DOI] [PubMed] [Google Scholar]
- 17.Habr-Gama A, Perez RO, Nadalin W, et al. Operative versus nonoperative treatment for stage 0 distal rectal cancer following chemoradiation therapy: long-term results. Ann Surg. 2004;240:711–717. [DOI] [PMC free article] [PubMed] [Google Scholar]
- 18.Bedrosian I, Rodriguez-Bigas MA, Feig B, et al. Predicting the node-negative mesorectum after preoperative chemoradiation for locally advanced rectal carcinoma. J Gastrointest Surg. 2004;8:56–62. [DOI] [PubMed] [Google Scholar]
- 19.Zmora O, Dasilva GM, Gurland B, et al. Does rectal wall tumor eradication with preoperative chemoradiation permit a change in the operative strategy? Dis Colon Rectum. 2004;47:1607–1612. [DOI] [PubMed] [Google Scholar]
- 20.Sischy B. The use of radiation therapy combined with chemotherapy in the management of squamous cell carcinoma of the anus and marginally resectable adenocarcinoma of the rectum. Int J Radiat Oncol Biol Phys. 1985;11:1587–1593. [DOI] [PubMed] [Google Scholar]
- 21.Sischy B, Doggett RL, Krall JM, et al. Definitive irradiation and chemotherapy for radiosensitization in management of anal carcinoma: interim report on Radiotherapy Oncology Group study no. 8314. J Natl Cancer Inst. 1989;81:850–856. [DOI] [PubMed] [Google Scholar]
- 22.Smith FM, Stephens RB, Kennedy MJ, et al. p53 abnormalities and outcomes in colorectal cancer: a systematic review. Br J Cancer. 2005;92:1813. [DOI] [PMC free article] [PubMed] [Google Scholar]
- 23.Smith FM, Reynolds JV, Miller N, et al. Pathological and molecular predictors of the response of rectal cancer to neoadjuvant radiochemotherapy. Eur J Surg Oncol. 2006;32:55–64. [DOI] [PubMed] [Google Scholar]
- 24.Ghadimi BM, Grade M, Difilippantonio MJ, et al. Effectiveness of gene expression profiling for response prediction of rectal adenocarcinomas to preoperative chemoradiotherapy. J Clin Oncol. 2005;23:1826–1838. [DOI] [PMC free article] [PubMed] [Google Scholar]
- 25.Liotta LA, Ferrari M, Petricoin E. Clinical proteomics: written in blood. Nature. 2003;425:905. [DOI] [PubMed] [Google Scholar]
- 26.Conrads TP, Zhou M, Petricoin EF 3rd, et al. Cancer diagnosis using proteomic patterns. Expert Rev Mol Diagn. 2003;3:411–420. [DOI] [PubMed] [Google Scholar]
- 27.Espina V, Dettloff KA, Cowherd S, et al. Use of proteomic analysis to monitor responses to biological therapies. Expert Opin Biol Ther. 2004;4:83–93. [DOI] [PubMed] [Google Scholar]
- 28.Yang S, Xiao X, Zhang W, et al. Application of serum SELDI proteomic patterns in diagnosis of lung cancer. BMC Cancer. 2005;5:83. [DOI] [PMC free article] [PubMed] [Google Scholar]
- 29.Laronga C, Becker S, Watson P, et al. SELDI-TOF serum profiling for prognostic and diagnostic classification of breast cancers. Dis Markers. 2003;19:229–238. [DOI] [PMC free article] [PubMed] [Google Scholar]
- 30.Petricoin EF, Ardekani AM, Hitt BA, et al. Use of proteomic patterns in serum to identify ovarian cancer. Lancet. 2002;359:572–577. [DOI] [PubMed] [Google Scholar]
- 31.Chen YD, Zheng S, Yu JK, et al. Artificial neural networks analysis of surface-enhanced laser desorption/ionisation mass spectra of serum protein pattern distinguishes colorectal cancer from healthy population. Clin Cancer Res. 2004;10:8380–8385. [DOI] [PubMed] [Google Scholar]
- 32.Furey TS, Cristianini N, Duffy N, et al. Support vector machine classification and validation of cancer tissue samples using microarray expression data. Bioinformatics. 2000;16:906–914. [DOI] [PubMed] [Google Scholar]
- 33.Yu JK, Chen YD, Zheng S. An integrated approach to the detection of colorectal cancer utilizing proteomics and bioinformatics. World J Gastroenterol. 2004;10:3127–3131. [DOI] [PMC free article] [PubMed] [Google Scholar]
- 34.Cortes C, Vapnik V. Support-Vector Networks. Machine Learning. 1995;20:273. [Google Scholar]
- 35.Yu JK, Chen YD, Zheng S. An integrated approach to the detection of colorectal cancer utilizing proteomics and bioinformatics. World J Gastroenterol. 2004;10:3127–3131. [DOI] [PMC free article] [PubMed] [Google Scholar]
- 36.Deleted in proof.
- 37.Wang Y, Meng A, Lang H, et al. Activation of nuclear factor kB in vivo selectively protects the murine small intestine against ionising radiation-induced damage. Cancer Res. 2004;64:6240–6246. [DOI] [PubMed] [Google Scholar]
- 38.Abdel-Latif MM, O'Riordan J, Windle HJ, et al. NF-kappaB activation in esophageal adenocarcinoma: relationship to Barrett's metaplasia, survival, and response to neoadjuvant chemoradiotherapy. Ann Surg. 2004;239:491–500. [DOI] [PMC free article] [PubMed] [Google Scholar]
- 39.Russo SM, Tepper JE, Baldwin AS Jr, et al. Enhancement of radiosensitivity by proteasome inhibition: implications for a role of NF-kappaB. Int J Radiat Oncol Biol Phys. 2001;50:183–193. [DOI] [PubMed] [Google Scholar]
- 40.Rodel C, Haas J, Groth A, et al. Spontaneous and radiation-induced apoptosis in colorectal carcinoma cells with different intrinsic radiosensitivities: survivin as a radioresistance factor. Int J Radiat Oncol Biol Phys. 2003;55:1341–1347. [DOI] [PubMed] [Google Scholar]
- 41.Buchholz TA, Stivers DN, Stec J, et al. Global gene expression changes during neoadjuvant chemotherapy for human breast cancer. Cancer J. 2002;8:461–468. [DOI] [PubMed] [Google Scholar]
- 42.Chang JC, Hilsenbeck SG, Fuqua SA. Genomic approaches in the management and treatment of breast cancer. Br J Cancer. 2005;92:618–624. [DOI] [PMC free article] [PubMed] [Google Scholar]
- 43.Roblick UJ, Auer G. Proteomics and clinical surgery. Br J Surg. 2005;92:1464–1465. [DOI] [PubMed] [Google Scholar]
- 44.Rai AJ, Stemmer PM, Zhang Z, et al. Analysis of Human Proteome Organization Plasma Proteome Project (HUPO PPP) reference specimens using surface enhanced laser desorption/ionization-time of flight (SELDI-TOF) mass spectrometry: multi-institution correlation of spectra and identification of biomarkers. Proteomics. 2005;5:3467–3474. [DOI] [PubMed] [Google Scholar]
- 45.Blagosklonny MV. Prospective strategies to enforce selectively cell death in cancer cells. Oncogene. 2004;23:2967–2975. [DOI] [PubMed] [Google Scholar]
- 46.Hu W, Kavanagh JJ. Anticancer therapy targeting the apoptotic pathway. Lancet Oncol. 2003;4:721–729. [DOI] [PubMed] [Google Scholar]
- 47.Norbury CJ, Zhivotovsky B. DNA damage-induced apoptosis. Oncogene. 2004;23:2797–2808. [DOI] [PubMed] [Google Scholar]
- 48.Pommier Y, Sordet O, Antony S, et al. Apoptosis defects and chemotherapy resistance: molecular interaction maps and networks. Oncogene. 2004;23:2934–2949. [DOI] [PubMed] [Google Scholar]
- 49.Rodel C, Grabenbauer GG, Papadopoulos T, et al. Apoptosis as a cellular predictor for histopathologic response to neoadjuvant radiochemotherapy in patients with rectal cancer. Int J Radiat Oncol Biol Phys. 2002;52:294–303. [DOI] [PubMed] [Google Scholar]
- 50.Kremer A, Wilkowski R, Holdenrieder S, et al. Nucleosomes in pancreatic cancer patients during radiochemotherapy. Tumor Biol. 2005;26:44–49. [DOI] [PubMed] [Google Scholar]
- 51.Holdenrieder S, Holubec L, Topolcan O, et al. Circulating nucleosomes and cytokeratin 19-fragments in patients with colorectal cancer during chemotherapy. Anticancer Res. 2005;25:1795–1801. [PubMed] [Google Scholar]
- 52.Rai AJ, Stemmer PM, Zhang Z, et al. Analysis of Human Proteome Organization Plasma Proteome Project (HUPO PPP) reference specimens using surface enhanced laser desorption/ionization-time of flight (SELDI-TOF) mass spectrometry: multi-institution correlation of spectra and identification of biomarkers. Proteomics. 2005;5:3467–3474. [DOI] [PubMed] [Google Scholar]