

Abstract
Objective:
To find out the most predictive staging system for papillary thyroid carcinoma (PTC) currently available in the literature.
Background:
Various staging systems or risk group stratifications have been used extensively in the clinical management of patients with PTC, but the most predictive system for cancer-specific survival (CSS) based on distinct histologic types remains unclear.
Methods:
Through a comprehensive MEDLINE search from 1965 to 2005, a total of 17 staging systems were found in the literature and 14 systems were applied to the 589 PTC patients managed at our institution from 1961 to 2001. CSS were calculated by Kaplan-Meier method and were compared by log-rank test. Using Cox proportional hazards analysis, the relative importance of each staging system in determining CSS was calculated by the proportion of variation (PVE).
Results:
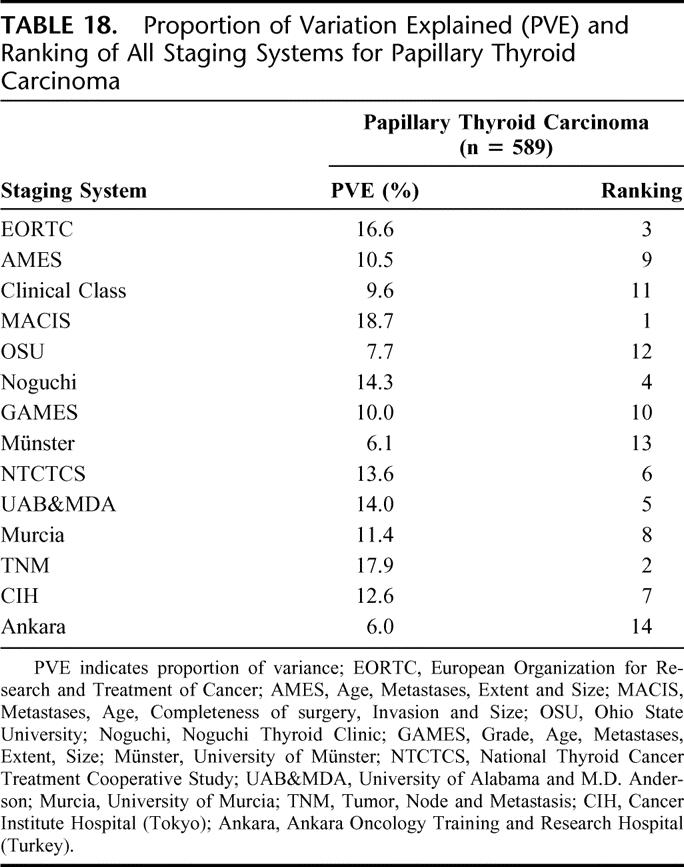
All 14 staging systems significantly predicted CSS (P < 0.001). The 3 highest ranked staging systems by PVE were the Metastases, Age, Completeness of Resection, Invasion, Size (MACIS) (18.7) followed by the new AJCC/UICC 6th edition tumor, node, metastases (TNM) (17.9), and the European Organization for Research and Treatment of Cancer (EORTC) (16.6).
Conclusions:
All of the currently available staging systems predicted CSS well in patients with PTC regardless of which histologic type from which they were derived. When predictability was measured by PVE, the MACIS system was the most predictive staging system and so should be the staging system of choice for PTC in the future.
A predictive staging system for thyroid carcinoma not only provides important prognostic information to patients and clinicians but also helps to standardize and facilitate information exchange between different medical centers. The present study confirmed that the MACIS system was the most predictive system for cancer-specific survival in papillary thyroid carcinoma.
Papillary thyroid carcinoma (PTC) is the most common type of differentiated thyroid carcinoma (DTC). It accounts for at least 70% of all follicular-cell derived thyroid malignancies1,2 and in our locality, its incidence has increased by 2.5 times in the last 20 years.3 This increasing trend was also observed in other parts of the world.4–8 Although the prognosis of PTC is generally good, up to 10% of patients would eventually die of the disease and an even greater proportion would face the morbidity of recurrences.1,2,9,10 As a result, a number of studies have identified various clinicopathologic predictors for PTC and devised risk-group stratification or staging systems to select those at high risk of cancer death for more aggressive surgical and adjuvant treatment while those at low risk would be spared of aggressive treatment.11–15 This is known as the stage-specific treatment.16
Given the number of staging systems described in the literature, several studies have attempted to compare the predictability of these staging systems in different populations.14,17–25 However, most of these studies only compared a restricted number of these systems and some failed to have an objective measurement of predictability and also tended to analyze PTC and follicular thyroid carcinoma (FTC) collectively.
The objectives of the present study were to comprehensively review all of the current staging systems available in the literature by performing a computer-assisted MEDLINE search and to look for the most predictive staging system for cancer-specific survival (CSS) in a predominantly ethnic Chinese population with PTC.
PATIENTS AND METHODS
A comprehensive review of the literature was performed by searching MEDLINE for relevant articles in the English Language from 1965 to 2005 indexed under the key words thyroid carcinoma/cancer, staging, risk stratification, multivariate analysis, or risk factors. The abstracts of all captured articles were read and those describing staging systems or risk group stratifications were identified and reviewed in detail. In addition, the bibliographies of captured articles were further searched to identify potentially relevant articles not found in the original MEDLINE search.
Patients
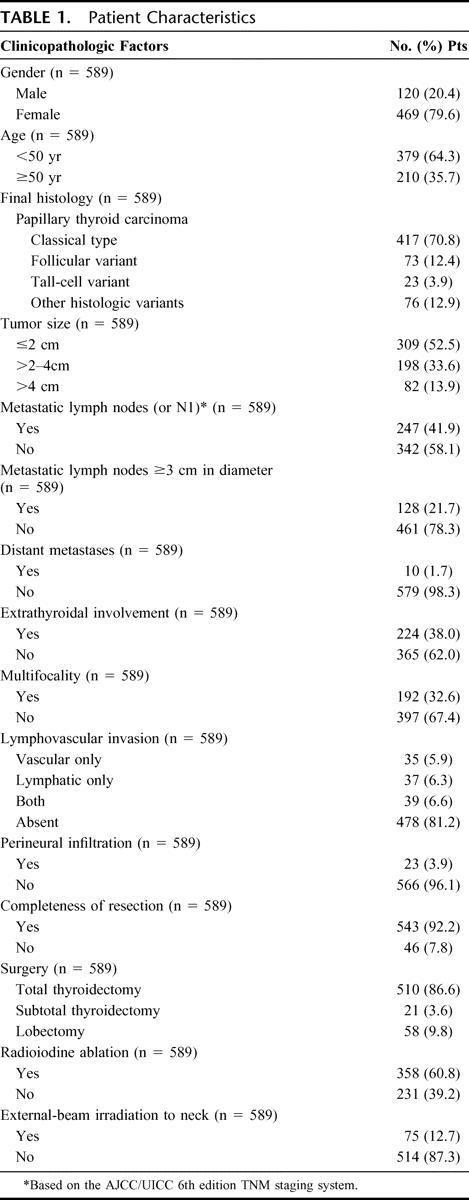
From 1961 to 2001, a total of 589 consecutive patients with a histologic diagnosis of PTC who underwent primary surgical treatment at our institution were recruited to the present study. Over the same period, there were 171 patients with histologic diagnosis of FTC and they were excluded from the analysis. The majority of the PTC cohort were female (79.6%) and ethnic Chinese (93.7%). The median age was 43.0 years (range, 10.0–89.0 years). All histologic variants of PTC (n = 172, 29.2%) were included. The most common nonconventional PTC variants were follicular (FVPTC) (n = 73, 12.4%), encapsulated (n = 31, 5.3%), and tall-cell (n = 23, 3.9%) variants. There were 111 papillary microcarcinomas (11.8%) based on tumor size of ≤1.0 cm included in the present cohort. Patients with occult microcarcinomas detected incidentally during histologic examination of thyroidectomy specimens for benign goiters were excluded because of their incidental nature and invariably indolent behavior.26 The 5-, 10-, and 15-year CSS in this specific subtype were significantly better than those of the conventional group (98.4%, 95.4%, 93.4% vs. 94.2%, 90.1%, 86.3%, respectively, P = 0.047). To ensure consistency and accuracy, each histologic diagnosis was reconfirmed after a careful review of the retrieved slides by a dedicated pathologist (K.-Y.L.) unaware of the clinical data, according to the standardized criteria approved by World Health Organization.27 Table 1 shows the patient characteristics of the cohort.
TABLE 1. Patient Characteristics
Surgical Treatment and Adjuvant Therapy
Details of surgical treatment, adjuvant therapy, and follow-up protocol had been described previously.2,28,29 In brief, for those patients with a preoperative diagnosis of DTC, a total or near-total thyroidectomy (defined as leaving less than 1 g of thyroid tissue behind) had increasingly been the preferred procedure of choice. For those diagnosed after a lobectomy, the decision whether to perform a completion total thyroidectomy and/or to administer radioiodine (RAI) ablation afterward was determined by known risk factors such as the patient's age, tumor characteristics as well as patient's preference. If patients underwent completion total thyroidectomy within 6 months of their initial thyroid surgery, it was considered part of initial surgery. However, if reoperations were performed for residual or nodal disease 6 months after diagnosis, it was considered to be a locoregional recurrence. Routine palpation and sampling of enlarged or suspicious lymph nodes in the central and lateral compartments were performed at the time of operation and were supplemented with the more frequent use of preoperative ultrasonography of the neck with or without fine needle aspiration cytology. A selective neck dissection, as defined as the clearance of cervical lymph nodes levels II to V while preserving internal jugular vein and accessory nerve, was performed for cytologically or histologically proven lateral lymph node metastasis.
Patients with at least one or more of the following risk factors would be considered for RAI ablation 4 to 6 weeks after surgical treatment by T4 withdrawal: tumor size >1 cm, lymph node metastasis, age older than 40 years, presence of extrathyroidal extension, macroscopic postoperative residual disease in the neck, and/or distant metastasis. Diagnostic whole-body I131 scans were performed at 8 to 12 weeks after RAI therapy. Three giga-Becquerels (GBq) or 80 millicuries (mCi) I131 would be administered as standard ablative dose while subsequent I131 therapy would be performed with 5.5 GBq (or 150 mCi). Additional 5.5 GBq I131 therapy would be administered periodically at 4- to 6-month intervals until uptake was no longer visible or disease progressed despite treatment. External local radiotherapy would be given to patients with extensive extrathyroidal tumor extension, incomplete resection, and/or extracapsular lymph node metastasis. Although the above protocol was strictly followed, individual patients' preference would be considered and respected.
Follow-up and Surveillance of Patients
Complete follow-up data were available for all patients. The median follow-up period for the cohort was 93 months (range, 60–497 months). All patients after surgery were followed up within 4 weeks in a specialized combined surgical oncology clinic where clinical oncologists and endocrine surgeons were present to discuss and decide on subsequent management. A follow-up visit was conducted at 3-month intervals in the first 2 years, 6 months for the subsequent 3 years, and annually thereafter. Clinical examinations, chest x-ray, ultrasonography of neck, and thyroglobulin levels (since 1989) were done during follow-up visits. Human recombinant TSH was not available during the study period at our institution. Radioactive scans were done in the presence of elevated thyroglobulin level and documented nodal recurrence or radiologic evidence of recurrence or metastases. The diagnosis of distant metastases on presentation was based on findings of histologic, radiologic, or scintigraphic evidence and not based on an elevated thyroglobulin level only. Locoregional recurrences were frequently diagnosed by ultrasound, CT, or MRI imaging and confirmed by fine needle aspiration cytology. Survival data including the cause of death were retrieved from the Hong Kong Hospital Authority territory-wide computerized medical system and from death certificates or postmortem examinations. The present study protocol was approved by the appropriate institutional review committee in accordance with the precepts established by the Helsinki Declaration.
Application of Staging Systems
Seventeen staging systems were identified from the computed-assisted MEDLINE search from 1965 to 2005 for either DTC or PTC and were potentially applicable to our PTC cohort. One additional staging system was purposely excluded from the analysis because it originated from and was applied specifically to FTC.30 Table 2 shows these 17 staging systems and their calculation method. The 6th edition of the TNM (2002) was chosen over the other editions because it was the latest version.15 Of the 17 systems, 14 were applicable to our PTC cohort. The 3 nonapplicable systems were the Age, Grade, Extent, Size (AGES),12 the DNA ploidy, Age, Metastases, Extent, Size (DAMES),31 and Sex, Age, Grade (SAG).32 All 3 systems included parameters which were not available at our institution (Table 2) and therefore were excluded from the present analysis. Parameters such as the grading of PTC (in AGES), DNA ploidy (in DAMES), and nuclear atypia (in SAG) were not routinely reported by the pathologists. The 14 different staging systems were applied to all 589 PTC patients in accordance to their original description.
TABLE 2. Staging Systems and Their Method of Tumor Risk Calculation

TABLE 2. (Continued)

TABLE 2. (Continued)

Statistical Analysis
For each staging system, CSS were calculated by the Kaplan-Meier method, and the difference between the stages and/or risk groups was compared by the log-rank test. Using Cox proportional hazards analysis, the relative importance of each staging system was determined by calculating the proportion of variation in survival time explained (PVE). PVE (%) ranges from 0 to 100 with large numbers suggesting better predictability. Therefore, the one with the largest PVE would suggest the best predictor on CSS. To determine PVE, a mathematical formula was used: PVE = 1 − exp (−G2/n), where G2 is the maximum likelihood ratio that is determined by analysis of χ2 associated with the null hypothesis (ie, that all predictor variables have coefficients of 0) and n is the total number of valid cases in the study.33 P < 0.05 was considered to indicate statistical significance. Statistical analyses were performed using the SPSS for Windows 11.0 computer software (SPSS Inc., Chicago, IL).
RESULTS
European Organization for Research and Treatment of Cancer (EORTC)11
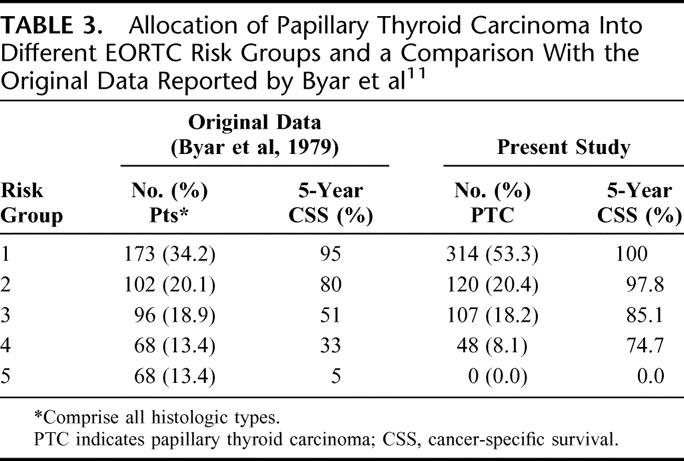
The EORTC was published in 1979 and was the first ever attempt at staging all histologic types of thyroid carcinoma (including medullary and anaplastic thyroid carcinomas) under one system. This system was developed from a multivariate analysis of 507 patients from 23 European hospitals with a median follow-up of 40 months. Under this system, a prognostic score was derived and stratified into 1 of 5 risk groups/stages (score <50, 50–65, 66–83, 84–108, and >108). Table 3 shows the allocation of patients into the 5 EORTC risk groups and a comparison with the original data reported by Byar et al.11
TABLE 3. Allocation of Papillary Thyroid Carcinoma Into Different EORTC Risk Groups and a Comparison With the Original Data Reported by Byar et al11
Lahey Clinic (Age, Metastases, Extent, Size or AMES)13
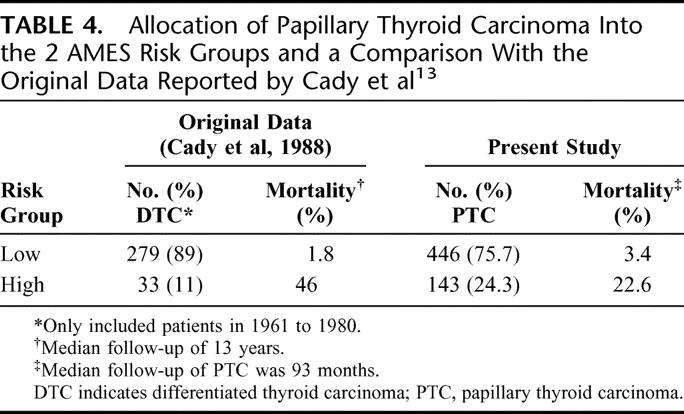
The AMES staging system was developed in 1980s from a cohort of 814 DTC patients. The prognostic factors were age, distant metastases, extrathyroidal invasion, and size. Both age and size were expressed as categorical variables; 5 cm was the cutoff point for size, but the cutoff point for age differed between the 2 sexes (41 years for men and 51 for women). Although it was developed from an expansion of previously defined risk groups, how the classification was derived remained unclear from the published reports. Table 4 shows the allocation of patients into the 2 risk groups and a comparison with the original data reported by Cady and Rossi.13
TABLE 4. Allocation of Papillary Thyroid Carcinoma Into the 2 AMES Risk Groups and a Comparison With the Original Data Reported by Cady et al13
University of Chicago (Clinical Class)34
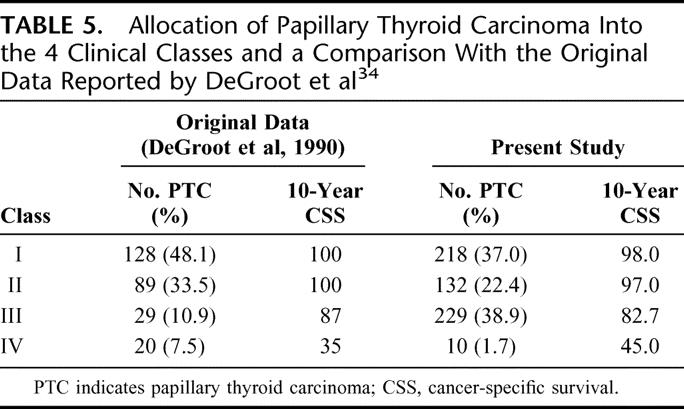
The Clinical Class system was developed in the 1980s from a cohort of 269 PTC patients and was initially intended for PTC only. Patients were categorized into 4 classes based on the anatomic extent of the primary tumor. It remained unclear how this system was derived and why age was not included in the system despite being a significant factor in the multivariate analysis. Table 5 shows the allocation of patients into the 4 classes and a comparison with the original data reported by DeGroot et al.34
TABLE 5. Allocation of Papillary Thyroid Carcinoma Into the 4 Clinical Classes and a Comparison With the Original Data Reported by DeGroot et al34
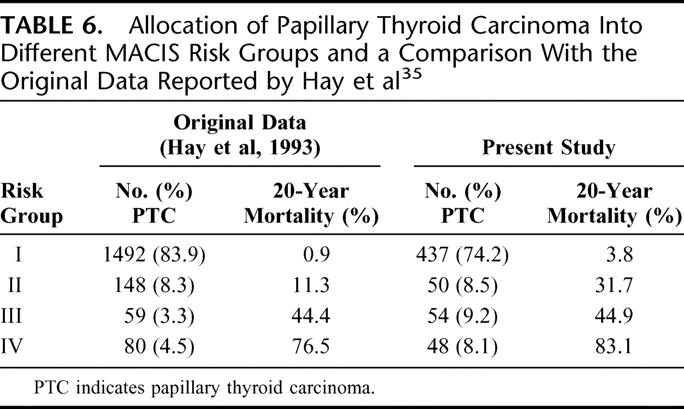
Mayo Clinic (Metastases, Age, Completeness of resection, Invasion, Size or MACIS)35
This system was developed as an alternative to the AGES system because grade for PTC was not available in most centers. It was based solely on PTC patients. The system was derived using a cohort of 1779 patients divided into 2 equal-sized groups based on the date of diagnosis: 1957–1972 and 1973–1988. A Cox model analysis using stepwise variable selection led to a prognostic model derived from the former cohort. The prognostic scoring system was validated with the latter cohort. Under this system, a prognostic score was derived and patients were stratified into 4 risk groups. Table 6 shows the allocation of patients into different MACIS risk groups and a comparison with the original data reported by Hay et al.35
TABLE 6. Allocation of Papillary Thyroid Carcinoma Into Different MACIS Risk Groups and a Comparison With the Original Data Reported by Hay et al35
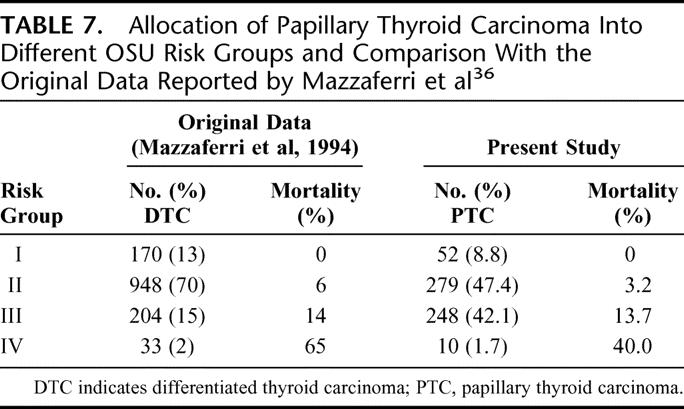
Ohio State University (OSU)36
This system was developed in 1994 from a multivariate analysis of 1355 DTC patients. Patients were divided into 4 stages based on the criteria of tumor size, lymph node involvement, multifocality, local tumor invasion, and distant metastases. Staging criteria were as follows: stage I, tumor smaller than 1.5 cm; stage II, tumor size between 1.5 to 4.4 cm or presence of cervical lymph node metastases or more than 3 intrathyroidal foci of tumor; stage III, tumor at least 4.5 cm or presence of extrathyroidal invasion; stage IV, distant metastases. Unlike most other systems, it uses multifocality as a prognostic factor. Table 7 shows the allocation of patients into different OSU risk groups and a comparison with the original data reported by Mazzaferri and Jhiang.36
TABLE 7. Allocation of Papillary Thyroid Carcinoma Into Different OSU Risk Groups and Comparison With the Original Data Reported by Mazzaferri et al36
Noguchi Thyroid Clinic Staging System (Noguchi)37
This system was published in 1994 after a multivariate analysis of 2192 PTC patients over a 24-year period. Patients were divided into 3 risk groups (excellent, intermediate, or poor) based on gender, age, tumor size, extrathyroidal extension, and gross lymph node metastases. It is unclear how these groups were derived from the multivariate analysis. The independent significant factors for the male sex were age and gross lymph node metastases whereas for the female sex, were age, gross lymph node metastases, tumor size, and extrathyroidal extension. Gross lymph node metastases were defined as those with macroscopic involvement at operation. The actual staging system appeared complicated. Table 8 shows the allocation of patients into different Noguchi risk groups and a comparison with the original data reported by Noguchi et al.37
TABLE 8. Allocation of Papillary Thyroid Carcinoma Into Different Noguchi Risk Groups and Comparison With the Original Data Reported by Noguchi et al37

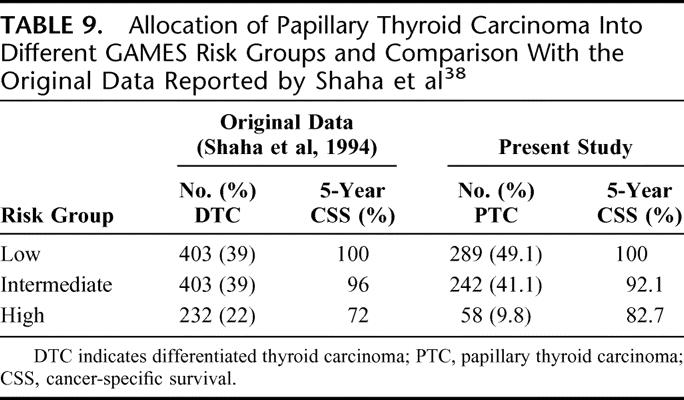
Memorial Sloan Kettering (Grade, Age, Metastases, Extent, Size or GAMES)38
It was published in 1994 after an analysis of 1038 DTC patients. Under this system, patients were stratified into low-, intermediate-, and high-risk categories. Age of 45 and size of 4 cm were the cutoff points for continuous variables. From the original article, it remains unclear how the actual stage groupings were determined. Table 9 shows the allocation of patients into different GAMES risk groups and a comparison with the original data reported by Shaha et al.38
TABLE 9. Allocation of Papillary Thyroid Carcinoma Into Different GAMES Risk Groups and Comparison With the Original Data Reported by Shaha et al38
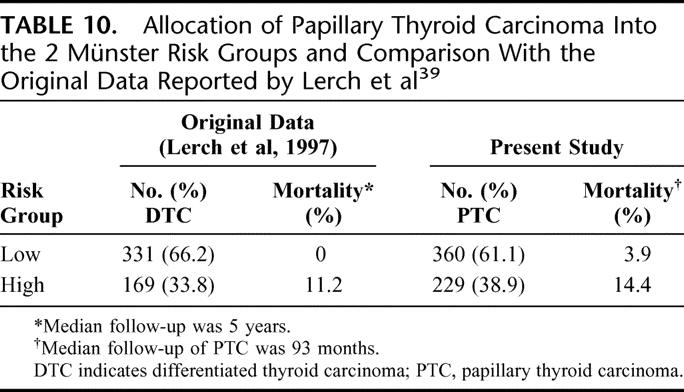
University of Münster (Münster)39
This system was published in 1995 after an analysis of 500 DTC patients. Of note, this series comprised a high proportion of FTC (almost 40%). Patients were stratified into the low- and high-risk groups. Those with extrathyroidal invasion and/or distant metastases would be classified as the high-risk group. The rest would be classified as the low-risk group. Table 10 shows the allocation of patients into the 2 Munster risk-groups and a comparison with the original data reported by Lerch et al.39
TABLE 10. Allocation of Papillary Thyroid Carcinoma Into the 2 Münster Risk Groups and Comparison With the Original Data Reported by Lerch et al39
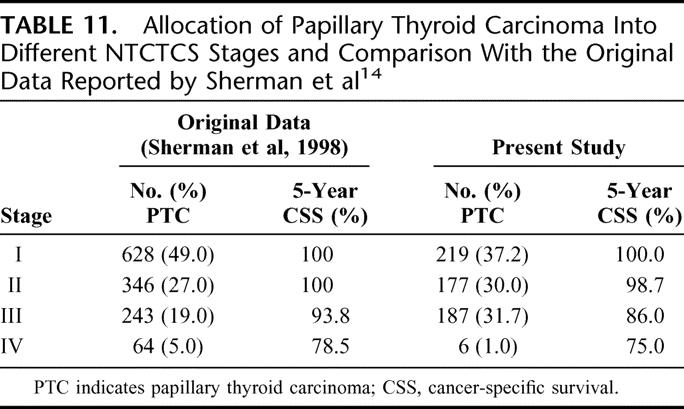
National Thyroid Cancer Treatment Cooperative Study (NTCTCS)14
The NTCTCS registry was a multicenter thyroid cancer registry established in 1986 with an aim of creating a broadly applicable staging classification in predicting outcome for all histologic types of thyroid carcinoma. Parameters selected in this system were age, tumor size, tumor type, extrathyroidal invasion, lymph node, and distant metastases. Several factors tended to predominate in the assignment of tumor stage for each histologic type. For PTC, significant factors include age, size, extrathyroidal invasion, and metastases. For FTC, they include age, size, distant metastases, and poor differentiation. Although it remains unclear how the actual staging system was derived, it was validated prospectively with 1607 patients recruited from 14 different U.S. institutions. Table 11 shows the allocation of patients into different NTCTCS stages and a comparison with the original data reported by Sherman et al.14
TABLE 11. Allocation of Papillary Thyroid Carcinoma Into Different NTCTCS Stages and Comparison With the Original Data Reported by Sherman et al14
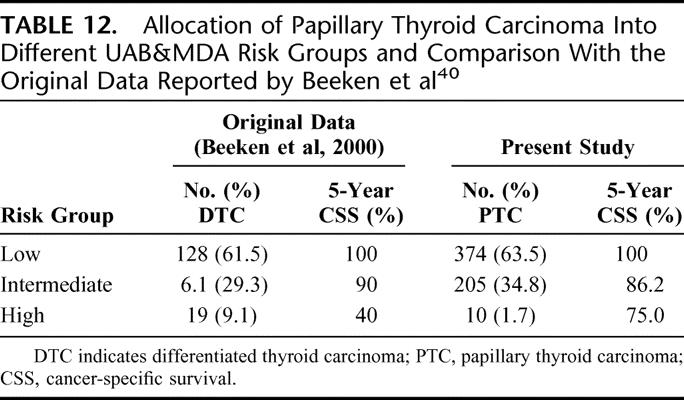
University of Alabama and M.D. Anderson (UAB&MDA)40
This system stratified PTC patients into low-, intermediate- and high-risk groups. Although 3 prognostic factors were found to be significant, only 2 prognostic factors (age and distant metastases) actually affected the final tumor stage. In the low-risk group, patients were below 50 years of age and without distant metastases. High-risk patients were those with distant metastases irrespective of age. Intermediate-risk group were those aged >50 years without metastases. Table 12 shows the allocation of patients into different UAB&MDA risk groups and a comparison with the original data reported by Beeken et al.40
TABLE 12. Allocation of Papillary Thyroid Carcinoma Into Different UAB&MDA Risk Groups and Comparison With the Original Data Reported by Beeken et al40
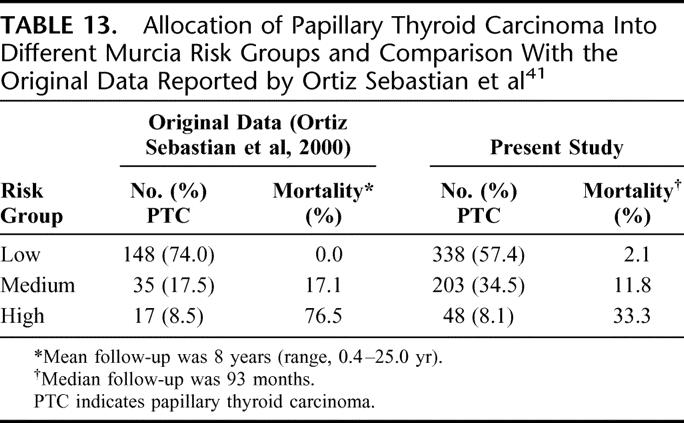
Virgen de la Arrixaca University at Murcia (Murcia)41
This system was developed at the University Hospital of Murcia in Spain. Univariate and multivariate analyses were carried out on a cohort of 200 PTC patients, and the authors came up with a prognostic index based on 4 prognostic factors. These factors include age (<50 and ≥50 years), tumor size (1–4 and >4 cm), extrathyroidal invasion (spread), and histologic variant of the PTC. Histologic variants such as solid, tall-cell, and poorly differentiated were considered to carry a poorer prognosis. It is uniquely different from other systems because it incorporated histologic variants in the prognostic model. As a result, this system is devised specifically for PTC. Table 13 shows the allocation of patient into different Murcia risk groups and a comparison with the original data reported by Ortiz Sebastian et al.41
TABLE 13. Allocation of Papillary Thyroid Carcinoma Into Different Murcia Risk Groups and Comparison With the Original Data Reported by Ortiz Sebastian et al41
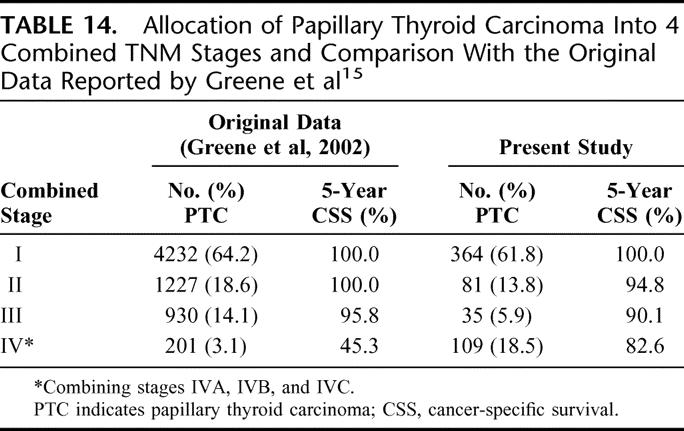
AJCC/UICC (6th edition) TNM Staging System (TNM)15
The TNM staging system was first described in the 1940s, and the 6th edition came into use in January 2003. Like its previous editions, the TNM is a system that describes the anatomic extent of the primary tumor (T), the involvement of regional lymph nodes (N), and distant metastasis (M). Although the system is applicable to all histologies of thyroid carcinoma, the stage grouping varies with different histologic types. PTC and FTC are being staged in the same way. It is the only staging system that regularly undergoes revision to keep up with prevailing changes in the field of thyroid carcinoma. Table 14 shows the allocation of patients into 4 combined TNM stages and a comparison with the original data reported by Greene et al.15
TABLE 14. Allocation of Papillary Thyroid Carcinoma Into 4 Combined TNM Stages and Comparison With the Original Data Reported by Greene et al15
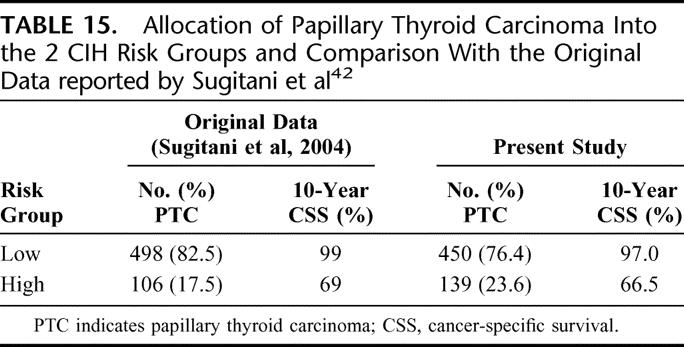
Cancer Institute Hospital in Tokyo (CIH)42
This system was derived from a multivariate analysis of 604 PTC patients, and there were 4 prognostic parameters incorporated into the system, namely, age (<50 years or ≥50 years), distant metastases, extrathyroidal extension, and large nodal metastases (≥3 cm). Under this system, patients ware stratified into 2 risk groups. The high-risk group are either those aged <50 but with distant metastases or those aged ≥50 and with at least one unfavorable prognostic factor such as large (≥3 cm) nodal metastases, extrathyroidal extension, or distant metastases. Table 15 shows the allocation of patients into the 2 CIH risk groups and a comparison with the original data reported by Sugitani et al.42
TABLE 15. Allocation of Papillary Thyroid Carcinoma Into the 2 CIH Risk Groups and Comparison With the Original Data reported by Sugitani et al42
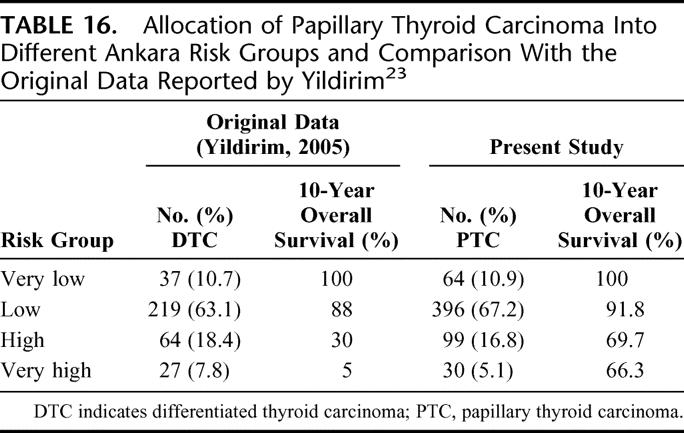
Ankara Oncology Training and Research Hospital (Ankara)23
This system was developed from a cohort of 347 DTC patients. Univariate and multivariate prognostic factor analyses were carried out and 4 risk groups (very low, low, high, and very high) were identified by the logistic regression equation. The proposed model was validated using the split sample method. The authors came up with 2 equations; the first included clinicopathologic factors only (the pretreatment formula) and the other included clinicopathologic as well as treatment factors (the post-treatment formula). However, they did not define risk groups in the post-treatment formula. Treatment factors included whether a patient has undergone a total thyroidectomy as opposed to subtotal and has received adjuvant RAI. It is the only staging system that incorporated treatment-related factors. Table 16 shows the allocation of patients into different Ankara risk groups and a comparison with the original data reported by Yildirim.23
TABLE 16. Allocation of Papillary Thyroid Carcinoma Into Different Ankara Risk Groups and Comparison With the Original Data Reported by Yildirim23
Evaluation and Comparison of Staging Systems
In terms of CSS, all 14 staging systems demonstrated highly significant differences between the different stages and/or risk groups (P < 0.001). Table 17 shows the 5-, 10-, and 15-year CSS of patients when being staged by each of the 14 staging systems. Table 18 shows the PVE and the relative ranking of the 14 applicable staging systems for PTC. In terms of PVE, the MACIS had the highest PVE value of 18.7%, and this was followed by the TNM (17.9%) and EORTC (16.1%). When analyzing only those patients who had undergone a total or near-total thyroidectomy followed by postoperative RAI (n = 136), the relative ranking of the top 3 systems remained the same, but the PVE for the MACIS, TNM, and EORTC increased to 28.2%, 27.8%, and 25.8%, respectively.
TABLE 17. Cancer-Specific Survival of Papillary Thyroid Carcinoma in Different Staging Systems
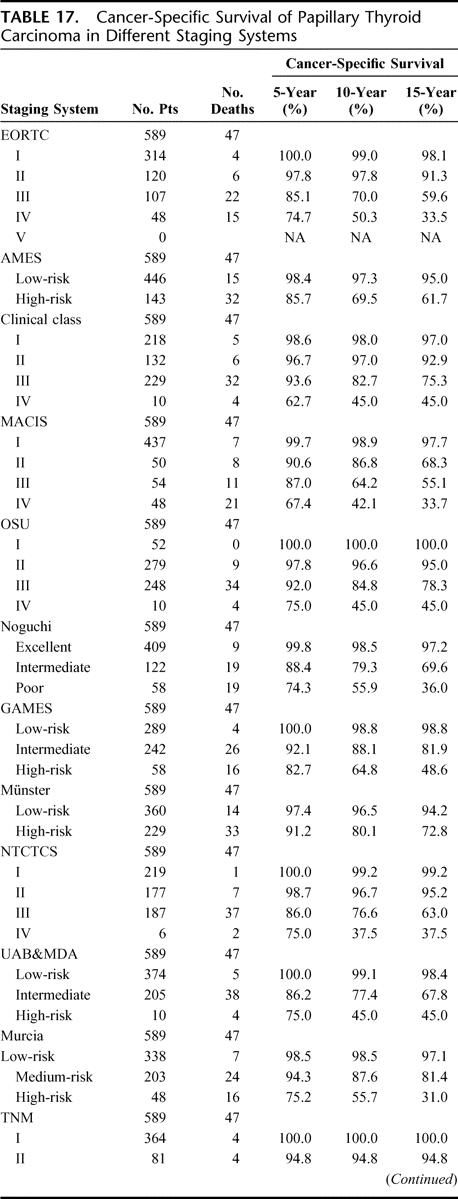
TABLE 17. (Continued)
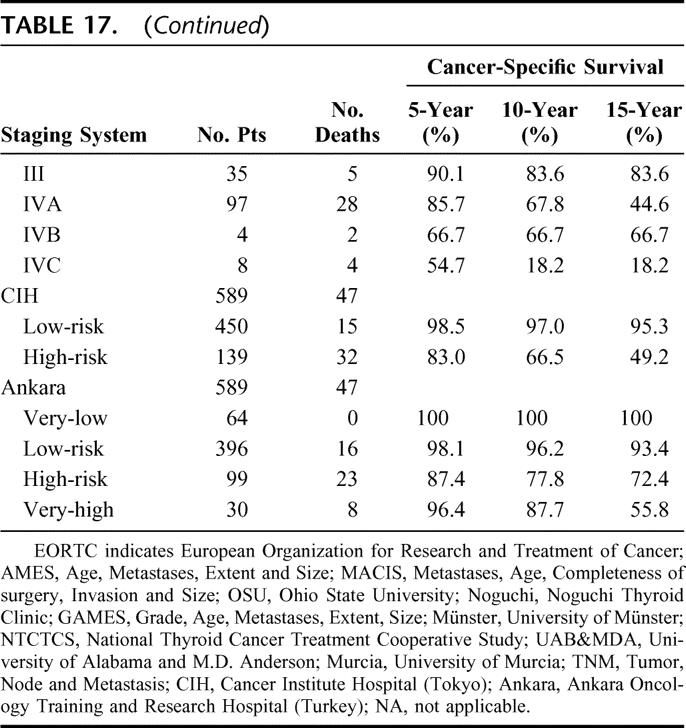
TABLE 18. Proportion of Variation Explained (PVE) and Ranking of All Staging Systems for Papillary Thyroid Carcinoma
DISCUSSION
Cancer staging is an essential and integral part of cancer management, and a predictive staging system not only provides accurate prognostic information to clinicians and their patients but also helps to facilitate exchange of cancer information between different medical centers.43,44 However, it remains unclear which of the currently available staging systems is most predictive for CSS in patients with PTC. From the MEDLINE search, there were a total of 17 different staging systems described for patients with thyroid carcinoma, with 8 of the these derived solely from one histologic type, namely, PTC. The AGES, Clinical Class, DAMES, MACIS, SAG, Noguchi, Murcia, and CIH were the only systems derived from PTC.12,31,32,34,35,37,41,42 The other 9 systems were either derived from 2 different histologic types (ie, PTC and FTC together or DTC)13,15,23,36,38–40 or from all histologic types of thyroid carcinoma, including medullary and anaplastic thyroid carcinoma.11,14 Interestingly, to our knowledge, only one system was solely derived from and specific to FTC.30 Perhaps this may be because the number of FTC within a single institution is relatively small as compared with that of PTC. This may account for the reason why a great number of staging systems including the current TNM system were developed from patients with either PTC or FTC and make no distinction in staging for PTC and FTC.
From the results, there were many similarities and differences noted in allocation of patients into different risk groups and CSS between those reported in the original article and those in the present study (Tables 3–16). However, these results should be interpreted cautiously as most of the original articles did not report survival data separately for PTC and FTC. As shown in previous studies, there were potential biases if PTC and FTC were not reported separately because of the relative dominance of PTC in DTC.2,36,45–47 Only the NTCTCS and 6th edition TNM systems reported 5-year actuarial survival data separately for PTC and FTC. In EORTC, the CSS of all histologic types were reported collectively as a group and, as expected, the CSS of their entire cohort were significantly worse than our PTC cohort in all risk groups because of the inclusion of medullary and anaplastic thyroid carcinoma, which are associated with a poorer outcome. Similarly in AMES, OSU, GAMES, Münster, and UAB&MDA, the CSS of DTC were also reported collectively as a group and this made comparison difficult and confusing because PTC and FTC exhibited different clinical behavior and outcome.2,36,45–47 Apart from this, some systems such as AMES, Clinical Class, OSU, Münster, and Murcia had only reported cancer-related mortality rate rather than actuarial CSS, and this again made it difficult for direct comparison because mortality rate also depends on the length of follow-up and the length of follow-up in these studies were significantly different from that of the present study. In Ankara, only actuarial overall survival rates were reported instead of the preferred actuarial CSS rates.
Although there had been numerous attempts at comparing predictability of staging systems for DTC, the majority of those studies so far had either compared a limited number of systems or failed to make use of an objective comparative measurement for predictability such as PVE.14,17,19,20,22–25 To date, only 2 comparisons had used an objective comparative measurement and, at the same time, included staging systems based on a systematic review of the literature.18,21 The first comparative study was conducted in the radiation oncology unit at the University of Toronto in Canada.18 Brierley et al were able to find 10 different staging systems in their 30-year MEDLINE search and applied 8 of these to their 382 DTC patients. Although, similar to the present study, they were not able to apply the SAG system because they did not have the VAN score available (Table 2), they were able to use the AGES system. Interestingly, Brierley et al18 found that the AGES, EORTC, MACIS, AMES, and TNM had equivalent predictability when measured by PVE for DTC as well as PTC. The second comparative study was carried out in the University of Vienna in Austria where the majority of patients came from an endemic goiter region.21 Passler et al21 were able to retrieve 14 staging systems in a 30-year MEDLINE search but could only apply 9 staging systems to their 440 DTC patients; Passler et al were not only unable to apply the AGES, DAMES, and SAG systems (like the present study) but also the NTCTCS and Murcia systems because of the unavailability of required variables at their center.21 Although the study was carried out in an endemic goiter area, their results concurred to those of the present study. Both Passler et al21 and the present study found that the MACIS was the most predictive system in PTC. Passler et al21 also found that the 5th edition TNM could only be ranked third for PTC behind the MACIS and EORTC, whereas in the present study, the 6th edition TNM was ranked higher to second behind the MACIS. Although the 6th edition TNM has been shown to have a better predictability than the 5th TNM for DTC, their relative performance in PTC requires further studies.48
Given the relatively low PVE values obtained in the present study, it is clear that all 14 staging systems had a less than perfect predictability for CSS in either histologic type. However, as compared with the 2 previous comparisons, these values were within the reported range.18,21 Indeed, one large multicenter study using PVE as a measurement had reported even lower values.14 Undoubtedly, there is room for improvement as none of the examined anatomic staging systems was able to account for a small proportion of cancer-related death in the so-called low-risk group. Perhaps more powerful prognostic biologic factors and molecular markers could be added to existing staging systems in the future for improving survival prediction.14,49
In recent years, papillary microcarcinoma have been increasingly diagnosed and treated in various parts of the world.4–8 As a result, in addition to the total number, the proportion of microcarcinomas relative to all type of PTC has significantly increased. None of the 17 staging systems considered microcarcinoma separately, although it has been shown that the behavior of microcarcinomas differs remarkably with the mode of clinical presentation.26 Clinically occult tumors are invariably incidental and indolent in behavior while patients with clinically overt microcarcinomas have more aggressive behavior. A staging system considering prognostic factors unique to microcarcinoma and stratifying this subtype separately from conventional PTC would be relevant in the future and may improve the predictability further.
To find out whether treatment could possibly affect the relative predictability of these staging systems, a subgroup analysis for those who had undergone a total thyroidectomy followed by RAI (n = 136) was performed for the 3 top-ranked staging systems (namely, the MACIS, TNM, and EORTC). The relative ranking of these 3 systems remained unchanged in the subgroup analysis. Therefore, although these staging systems, except the Ankara, calculate predicted risks based on preoperative and intraoperative findings only, their relative performance did not appear to be significantly altered by the actual treatment.
When choosing the most appropriate staging system for clinical application, apart from evaluating its predictability, practicality, reproducibility, and applicability are other important qualities that require further evaluation. As seen in the present and in other previous studies,18,21 staging systems that incorporated less widely accepted variables such as PTC grading, DNA analyses were generally not applicable. Also, staging systems such as the EORTC, MACIS, Noguchi, NTCTCS, and Ankara would appear complicated for daily clinical usage and so their practicality had been questioned.18,21 Although the current or 6th edition TNM may also appear complicated at first due to the increased number of pT and pN categories when compared with the 5th edition TNM, the new stage groupings have enhanced its usability and practicality.50
One of the limitations with the present study is that there is no universally accepted and objective measurement for predictability. Apart from PVE, a number of other statistical methods had been put forward, but none had been shown to be superior to PVE.18 To date, the PVE remained the most accepted measurement of predictability and had been used extensively in many recent comparative studies.22–24
CONCLUSION
Of the 17 staging systems currently available in the systematic review of the literature, 14 could be applied successfully to the PTC cohort and were able to predict CSS significantly in patients with PTC (P < 0.001). The 3 highest ranked staging systems by PVE were the MACIS, 6th edition TNM and EORTC. Given our finding, perhaps the MACIS should be the stratification system of choice for PTC in the future.
Footnotes
Reprints: Chung-Yau Lo, MS, FRCS (Edin), FACS, Division of Endocrine Surgery, Department of Surgery, Queen Mary Hospital, 102 Pokfulam Road, Hong Kong SAR, P.R. China. E-mail: cylo@hkucc.hku.hk.
REFERENCES
- 1.Sherman SI. Thyroid carcinoma. Lancet. 2003;361:501–511. [DOI] [PubMed] [Google Scholar]
- 2.Lang BH, Lo CY, Chan WF, et al. Prognostic factors in papillary and follicular thyroid carcinoma: their implications for cancer staging. Ann Surg Oncol. In press. [DOI] [PubMed]
- 3.Cancer incidence and mortality in Hong Kong from 1983 to 2002. Hong Kong Cancer Registry, Hong Kong. Available at: http://www3.ha.org.hk/cancereg/stat.asp. Accessed April 25, 2006.
- 4.Haselkorn T, Bernstein L, Preston-Martin S, et al. Descriptive epidemiology of thyroid cancer in Los Angeles County, 1972–1995. Cancer Causes Control. 2000;11:163–170. [DOI] [PubMed] [Google Scholar]
- 5.Hodgson NC, Button J, Solorzano CC. Thyroid cancer: is the incidence still increasing? Ann Surg Oncol. 2004;11:1093–1097. [DOI] [PubMed] [Google Scholar]
- 6.Reynolds RM, Weir J, Stockton DL, et al. Changing trends in incidence and mortality of thyroid cancer in Scotland. Clin Endocrinol (Oxf). 2005;62:156–162. [DOI] [PubMed] [Google Scholar]
- 7.Burgess JR, Tucker P. Incidence trends for papillary thyroid carcinoma and their correlation with thyroid surgery and thyroid fine-needle aspirate cytology. Thyroid. 2006;16:47–53. [DOI] [PubMed] [Google Scholar]
- 8.Davies L, Welch HG. Increasing incidence of thyroid cancer in the United States. JAMA. 2006;295:2164–2167. [DOI] [PubMed] [Google Scholar]
- 9.Mazzaferri EL, Kloos RT. Current approaches to primary therapy for papillary and follicular thyroid cancer. J Clin Endocrinol Metab. 2001;86:1447–1462. [DOI] [PubMed] [Google Scholar]
- 10.Eustatia-Rutten CF, Corssmit EP, Biermasz NR, et al. Survival and death causes in differentiated thyroid carcinoma. J Clin Endocrinol Metab. 2006;91:313–319. [DOI] [PubMed] [Google Scholar]
- 11.Byar DP, Green SB, Dor P, et al. A prognostic index for thyroid carcinoma: a study of the EORTC Thyroid Cancer Cooperative Group. Eur J Cancer. 1979;15:1033–1041. [DOI] [PubMed] [Google Scholar]
- 12.Hay ID, Grant CS, Taylor WF, et al. Ipsilateral lobectomy versus bilateral lobar resection in papillary thyroid carcinoma: a retrospective analysis of surgical outcome using a novel prognostic scoring system. Surgery. 1987;102:1088–1095. [PubMed] [Google Scholar]
- 13.Cady B, Rossi R. An expanded view of risk-group definition in differentiated thyroid carcinoma. Surgery. 1988;104:947–953. [PubMed] [Google Scholar]
- 14.Sherman SI, Brierley JD, Sperling M, et al. Prospective multicenter study of thyroid carcinoma treatment: initial analysis of staging and outcome. Cancer. 1998;83:1012–1021. [DOI] [PubMed] [Google Scholar]
- 15.Greene FL, Page DL, Fleming ID, et al, eds. AJCC Cancer Staging Handbook: TNM Classification of Malignant Tumors, 6th ed. New York: Springer-Verlag, 2002. [Google Scholar]
- 16.Shaha AR. Implications of prognostic factors and risk groups in the management of differentiated thyroid cancer. Laryngoscope. 2004;114:393–402. [DOI] [PubMed] [Google Scholar]
- 17.Davis NL, Bugis SP, McGregor GI, et al. An evaluation of prognostic scoring systems in patients with follicular thyroid cancer. Am J Surg. 1995;170:476–480. [DOI] [PubMed] [Google Scholar]
- 18.Brierley JD, Panzarella T, Tsang RW, et al. A comparison of different staging systems. Predictability of patient outcome: thyroid carcinoma as an example. Cancer. 1997;79:2414–2423. [PubMed] [Google Scholar]
- 19.Chaplin JM, O'Brien CJ, McNeil EB, et al. Application of prognostic scoring systems in differentiated thyroid carcinoma. Aust NZ Surg. 1999;69:625–628. [DOI] [PubMed] [Google Scholar]
- 20.Steinmuller T, Klupp J, Rayes N, et al. Prognostic factors in patients with differentiated thyroid carcinoma. Eur J Surg. 2000;166:29–33. [DOI] [PubMed] [Google Scholar]
- 21.Passler C, Prager G, Scheuba C, et al. Application of staging systems for differentiated thyroid carcinoma in an endemic goiter region with iodine substitution. Ann Surg. 2003;207:227–234. [DOI] [PMC free article] [PubMed] [Google Scholar]
- 22.D'Avanzo A, Ituarte P, Treseler P, et al. Prognostic scoring systems in patients with follicular thyroid cancer: a comparison of different staging systems in predicting the patient outcome. Thyroid. 2004;14:453–458. [DOI] [PubMed] [Google Scholar]
- 23.Yildirim E. A model for predicting outcomes in patients with differentiated thyroid cancer and model performance in comparison with other classification systems. J Am Coll Surg. 2005;200:378–392. [DOI] [PubMed] [Google Scholar]
- 24.Lo CY, Chan WF, Kam KY, et al. Follicular thyroid carcinoma: the role of histology and staging systems in predicting survival. Ann Surg. 2005;242:708–715. [DOI] [PMC free article] [PubMed] [Google Scholar]
- 25.Kjellman P, Zedenius J, Lundell G, et al. Predictors of outcome in patients with papillary thyroid carcinoma. Eur J Surg Oncol. 2006;32:345–352. [DOI] [PubMed] [Google Scholar]
- 26.Lo CY, Chan WF, Lang BH, et al. Papillary microcarcinoma: is there any difference between clinically overt and occult tumors. World J Surg. 2006;30:759–766. [DOI] [PubMed] [Google Scholar]
- 27.DeLellis RA, Lloyd RV, Heitz PU, et al., eds. World Health Organization Classification of Tumours: Pathology and Genetics of Tumours of Endocrine Organs. Lyon, France: IARC Press, 2004. [Google Scholar]
- 28.Lo CY, Chan WF, Lam KY, et al. Optimizing the treatment of AMES high-risk papillary thyroid carcinoma. World J Surg. 2004;28:1103–1109. [DOI] [PubMed] [Google Scholar]
- 29.Lang BH, Lo CY, Chan WF, et al. Classical and follicular variant of papillary thyroid carcinoma: a comparative study on clinicopathological features and long-term outcome. World J Surg. 2006;30:752–758. [DOI] [PubMed] [Google Scholar]
- 30.Brennan MD, Bergstralh EJ, van Heerden JA, et al. Follicular thyroid cancer treated at the Mayo Clinic, 1946 through 1970: initial manifestations, pathologic findings, and outcome. Mayo Clin Proc. 1991;66:11–22. [DOI] [PubMed] [Google Scholar]
- 31.Pasieka JL, Zedenius J, Auer G, et al. Addition of nuclear DNA content to the AMES risk-group classification for papillary thyroid carcinoma. Surgery. 1992;112:1154–1160. [PubMed] [Google Scholar]
- 32.Akslen LA. Prognostic importance of histologic grading in papillary thyroid carcinoma. Cancer. 1993;72:2680–2685. [DOI] [PubMed] [Google Scholar]
- 33.Schemper M, Stare J. Explained variation in survival analysis. Stat Med. 1996;15:1999–2012. [DOI] [PubMed] [Google Scholar]
- 34.DeGroot LJ, Kaplan EL, McCormick M, et al. Natural history, treatment, and course of papillary thyroid carcinoma. J Clin Endocrinol Metab. 1990;71:414–424. [DOI] [PubMed] [Google Scholar]
- 35.Hay ID, Bergstralh EJ, Goellner JR, et al. Predicting outcome in papillary thyroid carcinoma: development of a reliable prognostic scoring system in a cohort of 1779 patients surgically treated at one institution during 1940 through 1989. Surgery. 1993;114:1050–1058. [PubMed] [Google Scholar]
- 36.Mazzaferri EL, Jhiang SM. Long-term impact of initial surgical and medical therapy on papillary and follicular thyroid cancer. Am J Med. 1994;97:418–428. [DOI] [PubMed] [Google Scholar]
- 37.Noguchi S, Murakami N, Kawamoto H. Classification of papillary cancer of the thyroid based on prognosis. World J Surg. 1994;18:552–558. [DOI] [PubMed] [Google Scholar]
- 38.Shaha AR, Loree TR, Shah JP. Intermediate-risk group for differentiated carcinoma of the thyroid. Surgery. 1994;116:1036–1041. [PubMed] [Google Scholar]
- 39.Lerch H, Schober O, Kuwert T, et al. Survival of differentiated thyroid carcinoma studied in 500 patients. J Clin Oncol. 1997;15:2067–2075. [DOI] [PubMed] [Google Scholar]
- 40.Beeken S, Roye D, Weiss H, et al. Extent of surgery for intermediate-risk well-differentiated thyroid cancer. Am J Surg. 2000;179:51–56. [DOI] [PubMed] [Google Scholar]
- 41.Ortiz Sebastian S, Rodriguez Gonzalez JM, Parilla Paricio P, et al. Papillary thyroid carcinoma: prognostic index for survival including the histological variety. Arch Surg. 2000;135:272–277. [DOI] [PubMed] [Google Scholar]
- 42.Sugitani I, Kasai N, Fujimoto Y, et al. A novel classification system for patients with PTC: addition of the new variables of large (3cm or greater) nodal metastases and reclassification during the follow-up period. Surgery. 2004;135:139–148. [DOI] [PubMed] [Google Scholar]
- 43.Greene FL. Cancer staging, prognostic factors, and our surgical challenges. Am Surg. 2005;71:615–620. [PubMed] [Google Scholar]
- 44.Cooper DS, Doherty GM, Haugen BR, et al. Management guidelines for patients with thyroid nodules and differentiated thyroid carcinoma. Thyroid. 2006;16:109–142. [DOI] [PubMed] [Google Scholar]
- 45.Hundahl SA, Cady B, Cunningham MP, et al. Initial results from a prospective cohort study of 5583 cases of thyroid carcinoma treated in the United States during 1996. U.S. and German Thyroid Cancer Study Group. An American College of Surgeons Commission on Cancer Patient Care Evaluation Study. Cancer. 2000;89:202–217. [DOI] [PubMed] [Google Scholar]
- 46.Holzer S, Reiners C, Mann K, et al. Patterns of care for patients with primary differentiated carcinoma of the thyroid gland treated in Germany during 1996. U.S. and German Thyroid Cancer Group. Cancer. 2000;89:192–201. [DOI] [PubMed] [Google Scholar]
- 47.Chow SM, Law SC, Au SK, et al. Differentiated thyroid carcinoma: comparison between papillary and follicular carcinoma in a single institute. Head Neck. 2002;24:670–677. [DOI] [PubMed] [Google Scholar]
- 48.Lang BH, Lo CY, Chan WF, et al. Restaging of differentiated thyroid carcinoma by the 6th edition AJCC/UICC staging system: stage migration and predictability. Ann Surg Oncol. In press. [DOI] [PubMed]
- 49.Kebebew E, Peng M, Reiff E, et al. Diagnostic and extent of disease multigene assay for malignant thyroid neoplasms. Cancer. 2006;106:2592–2597. [DOI] [PubMed] [Google Scholar]
- 50.Wittekind C, Greene FL, Henson DE, et al., eds. TNM Supplement: A Commentary on Uniform Use, 3rd ed. New York: Wiley-Liss, 2003. [Google Scholar]