Abstract
Introduction:
The systemic inflammatory response syndrome (SIRS) occurs frequently in critically ill patients and presents similar clinical appearances despite diverse infectious and noninfectious etiologies. Despite similar phenotypic expression, these diverse SIRS etiologies may induce divergent genotypic expressions. We hypothesized that gene expression differences are present between sepsis and uninfected SIRS prior to the clinical appearance of sepsis.
Methods:
Critically ill uninfected SIRS patients were followed longitudinally for the development of sepsis. All patients had whole blood collected daily for gene expression analysis by Affymetrix Hg_U133 2.0 Plus microarrays. SIRS patients developing sepsis were compared with those remaining uninfected for differences in gene expression at study entry and daily for 3 days prior to conversion to sepsis. Acceptance criteria for differentially expressed genes required: >1.2 median fold change between groups and significance on univariate and multivariate analysis. Differentially expressed genes were annotated to pathways using DAVID 2.0/EASE analysis.
Results:
A total of 12,782 (23.4%) gene probes were differentially expressed on univariate analysis 0 to 48 hours before clinical sepsis. 626 (1.1%) probes met acceptance criteria, corresponding to 459 unique genes, 65 (14.2%) down and 395 (85.8%) up expressed. These genes annotated to 10 pathways that functionally categorized to 4 themes involving innate immunity, cytokine receptors, T cell differentiation, and protein synthesis regulation.
Conclusions:
Sepsis has a unique gene expression profile that is different from uninfected inflammation and becomes apparent prior to expression of the clinical sepsis phenotype.
In critically ill patients, sepsis induces changes in gene expression that are different from acute uninfected inflammation. These changes occur up to 48 hours prior to the onset of clinical sepsis.
Sepsis is the leading cause of death in intensive care units in the United States and Europe.1 By initiating a systemic inflammatory response, microorganisms trigger widespread activation of multiple pathophysiologic processes that result in either survival or death of patients. Noninfectious etiologies can trigger similar inflammatory processes. Despite diverse infectious and noninfectious etiologies, the systemic inflammatory response syndrome (SIRS) appears phenotypically and clinically similar irrespective of the initiating insult. Although SIRS is an integral component of sepsis, 71.5% of critically ill patients with SIRS are not infected.2 The diversity of the initiating insults and the similarity of inflammatory response suggest a diversity of recognition capabilities but a commonality of response pathways.
Functional genomics allows identification of complex pathways and interactions between gene expression products that provides insight into processes beyond their clinical appearance. Single cell signaling stimuli can define complex cellular pathways but multicellular and whole organism systems require an understanding of complex interrelationships, both structurally and temporally. These complex interrelationships are based on numerous individual components, diffuse interconnectivity between components, differences in spatio-temporal relations, and complexity in signaling network control interactions.3 A reductionist approach to cell signaling networks provides components. The broader analysis of interactions and relationships with other signaling pathways yields further understandings of functionality. Attempts at applying these techniques to sepsis have elucidated a highly complex but integrated response.4 Lacking is information on distinguishing pathways related to acute uninfected inflammation from those unique to sepsis.
The purpose of this study was to evaluate for differences in gene expression between critically ill SIRS patients who remain uninfected and those that become septic. We further sought to evaluate if those differences would occur prior to the clinical appearance of sepsis.
METHODS
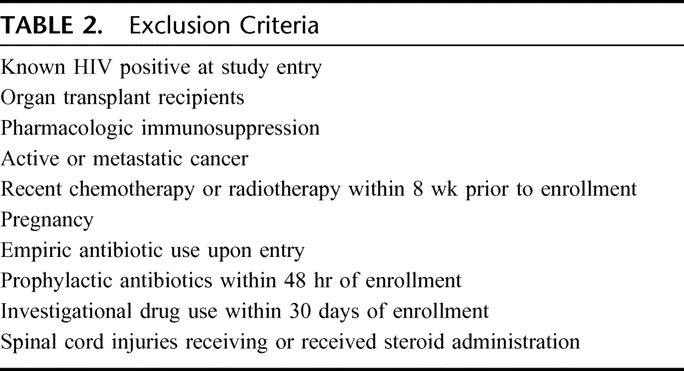
The study was approved by the Institutional Review Board of the University of Maryland School of Medicine. Adult critically ill uninfected trauma patients with at least 2 of 4 standard SIRS criteria5 (Table 1) were enrolled if they were not immunocompromised or receiving antibiotics (Table 2). These SIRS patients were prospectively evaluated for development of clinical sepsis and divided into 2 groups: 1) uninfected SIRS, SIRS patients who remained uninfected during the study; and 2) preseptic SIRS, SIRS patients who developed clinical sepsis during the study. Sepsis diagnoses were based on the standard clinical criteria for both SIRS and sepsis patients.6,7 Data on site of infection and type of organisms causing sepsis were collected, but the purpose of this study was to compare sepsis from all causes with uninfected sterile inflammation.
TABLE 1. Systemic Inflammatory Response Syndrome (SIRS) Criteria
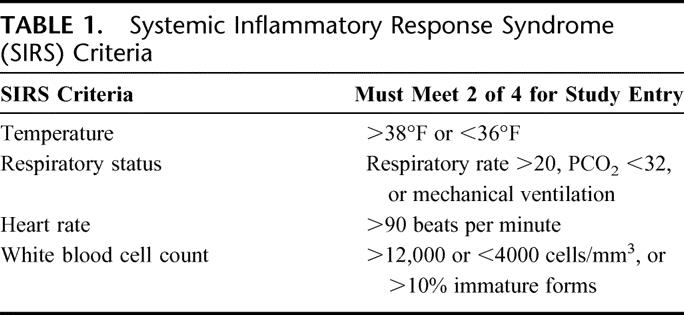
TABLE 2. Exclusion Criteria
For uninfected SIRS patients, blood was collected daily until ICU discharge (up to 14 days). For preseptic SIRS patients, blood was collected daily until 3 days after conversion to sepsis (up to 17 days). Whole blood was collected into PAXgene (PreAnalytiX, Switzerland) tubes. Standard RNA isolation was performed with whole blood samples and applied to a PAXgene RNA spin column, allowing RNA to bind to a silica-gel membrane. Protocol details are on manufacturer's website.8 After total RNA stabilization occurred, tubes were frozen at −80°C until analyzed. Patient demographics, sepsis risk factors, APACHE II and SOFA scores at time of entry, daily vital signs, complete blood counts, and concomitant medications were collected.
Patients assigned to the preseptic group required fulfillment of all the following criteria for the clinical diagnosis of sepsis: 1) the presence of an invasive infection as determined by either positive microbiologic culture in an otherwise sterile location or direct visualization of perforated or necrotic bowel; 2) the continued presence of 2 or more SIRS criteria; and 3) the invasive infection was considered sufficiently significant to require a clinical therapeutic intervention (antibiotics and/or surgical procedure) to be initiated as determined by consensus of an infectious disease attending, a surgery attending, and a critical care attending. This clinical diagnosis of sepsis for all sites of infection was based on the definition of clinical sepsis requiring significant microbiologic evidence, systemic manifestations, and a specific associated therapeutic intervention and was not dependent on specific site of infection definitions. To compare patients by similar severity of disease, and since preseptic patients converted to sepsis at varying time points after enrollment, all preseptic patients were retrospectively normalized, using their clinical conversion to sepsis as the normalization point (T0). Clinical sepsis conversion time (T0) was defined as the specific time point when the presence of an invasive infection in an otherwise sterile location was identified (by culture or direct visualization) that resulted in an associated therapeutic intervention. Blood obtained at 4 distinct time points prior to sepsis conversion were analyzed: day of study entry (DOE), 0 to 24 hours before sepsis conversion (T12), 25 to 48 hours before sepsis conversion (T36), and 49 to 72 hours before sepsis conversion (T60). For the SIRS patients who never converted to sepsis, samples were time matched to clinically similar preseptic patients, based on demographic information, continued presence of SIRS, and elapsed time in the study.
Gene Chip Expression Analysis
Blood samples were analyzed using the Affymetrix U133A 2.0 microarray. A globin blocking technique was used to counter globin mRNA signal suppression noted with PAXgene tubes and these microarrays.9,10 RNA isolation, hybridization, and microarray analysis were performed by GeneLogic (Gaithersburg, MD). Protocol details are available on their website.11 Data were quality controlled and analyzed using both RMA and MAS 5 programs.
Statistical Analysis of Data
Analyses were performed comparing the preseptic group to the SIRS group at each time point. Gene expression median fold changes underwent Box-Cox procedure transformation based on best score. Any missing variables were imputed using the imputation scheme implemented in the “pamr” package.12 Univariate analysis was performed by Wilcoxon rank sum test with P values adjusted for multiple comparisons using the Benjamini-Hochberg procedure.13 The adjusted P values represent the maximum false discovery rate for that variable. Multivariate predictive analysis was subsequently performed using 4 methods: Prediction Analysis for Microarrays (pamr)14 recursive partitioning (rpart),15 gradient boosting (gbm),16 and random forest.17 Each method provides a measure of variable importance. For each method, predictive accuracy was estimated by 10-fold cross-validation.
Assignment of Genes to Pathways
Pathway assignment was performed only on probes meeting strict acceptance criteria. Acceptance criteria required all of the following: 1) statistical significance on univariate analysis (false discovery rate corrected P value ≤0.025); 2) inclusion in at least one multivariate model; and 3) had a ≥1.2-fold change in median expression, increased or decreased, between the preseptic and uninfected groups. The 1.2-fold change threshold was chosen since this amount of change by the methods used was determined for selected genes to be associated with approximately 2.0-fold change by RT-PCR. Probes meeting acceptance criteria were uploaded into DAVID 2.018,19 for pathway inclusion and annotation to known KEGG20,21 and Biocarta22 pathways. Only pathways with genes overrepresented compared with random chance as identified using EASE analysis (significance at the P < 0.1 level) were selected.
RESULTS
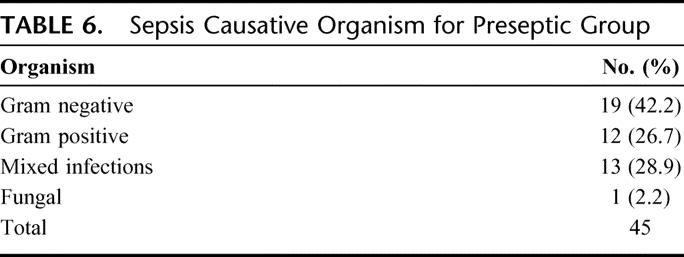
Ninety SIRS patients were enrolled in the study, 45 in each group of preseptic SIRS and uninfected SIRS. At study entry, all patients were in an intensive care unit and similar in age, gender, ethnicity, and APACHE II score (Table 3). The time from study entry to T0 was 7.15 ± 3.10 and 7.04 ± 3.45 days in the preseptic and uninfected groups, respectively. During the 24 hours prior to the T0, patients demonstrated the physiologic variables shown in Table 4. Pneumonia and bacteremia were the most common sites of infections (Table 5) and gram-negative bacteria were the most frequent organisms (Table 6).
TABLE 3. Demographics of SIRS Study Population at Entry
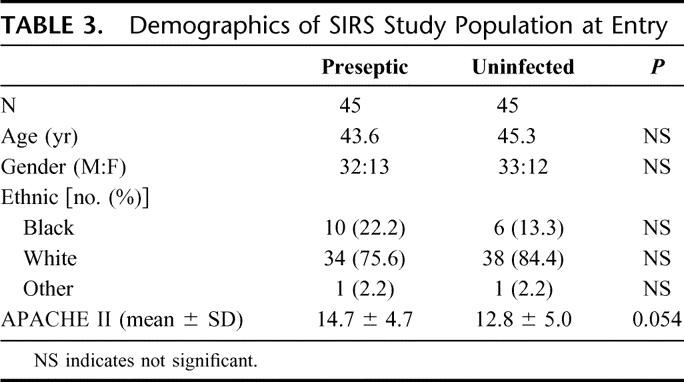
TABLE 4. Physiologic Variables During Time Period T12
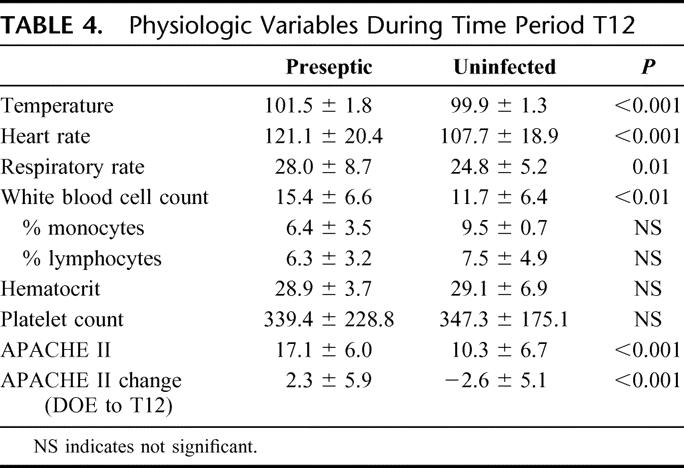
TABLE 5. Sites of Infection for Preseptic Group
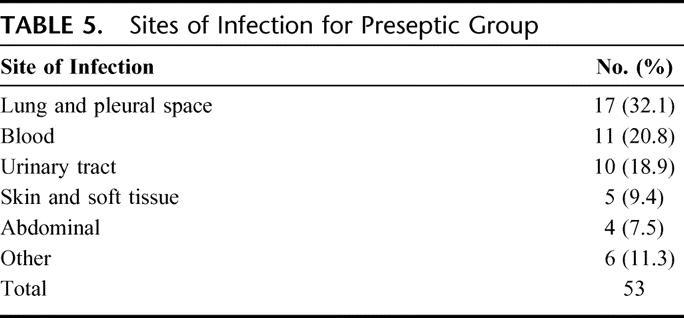
TABLE 6. Sepsis Causative Organism for Preseptic Group
Of the possible 54,613 probes evaluated by the Affymetrix microarray, 12,782 (23.4%) unique probes were significantly differentially expressed on univariate analysis between groups during the 0 to 48 hours prior to clinical sepsis (T12 and T36 time points). These 12,782 probes, representing 7453 unique genes, contained 626 probes that met all acceptance criteria. Using David 2.0 analysis, 578 (92.3%) probes representing 459 unique genes were amenable to annotation into specific pathways. Of the 459 unique genes, 65 (14.2%) were down-regulated (22 at T36 and 43 at T12), and 394 (85.8%) were up-regulated (34 at T36 and 360 at T12).
The 459 unique genes were annotated into 11 distinct pathways. Ten of these pathways are closely associated with inflammation and the 11th involved the ubiquitous nicotinate–nicotinamide metabolism pathway (EASE, P value = 0.09). By grouping the pathways involved in inflammation into common themes, 4 discernible themes became apparent:
Innate Immunity
There were 2 pathways and 24 unique genes found associated with innate immunity.
Toll-Like Receptor (TLR) Pathway
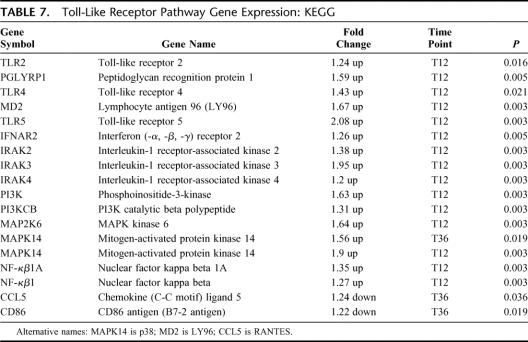
There were 17 differentially expressed genes in this pathway, 15 up-regulated and 2 down-regulated (EASE, P = 0.008) (Table 7). Genes involved with TLR2, TLR4, and TLR5 were differentially expressed up to 48 hours prior to the onset of clinical sepsis. Increased gene expression for key recognition receptors of both gram-negative (TLR4 and MD2) and gram-positive bacteria (TLR2 and PGLYRP1) was noted.
TABLE 7. Toll-Like Receptor Pathway Gene Expression: KEGG
Mitogen-Activated Protein Kinase (MAPK) Signaling Pathway
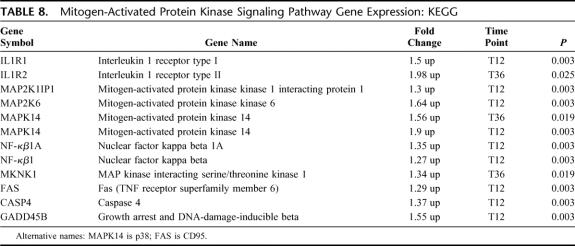
There were 11 differentially expressed genes in this pathway; all 11 were up-regulated (EASE, P = 0.07) (Table 8). All differential gene expression occurred at the T12 time point, except IL1R2 and MKNK1, which occurred only at T36. Up-regulation of the MAPK14 (p38) occurred at both T12 and T36 time points consistent with early and sustained activation.
TABLE 8. Mitogen-Activated Protein Kinase Signaling Pathway Gene Expression: KEGG
Cytokine Receptors
There were 3 pathways and 25 unique genes specifically associated with cytokine receptors.
IL-22 Soluble Receptor Signaling Pathway
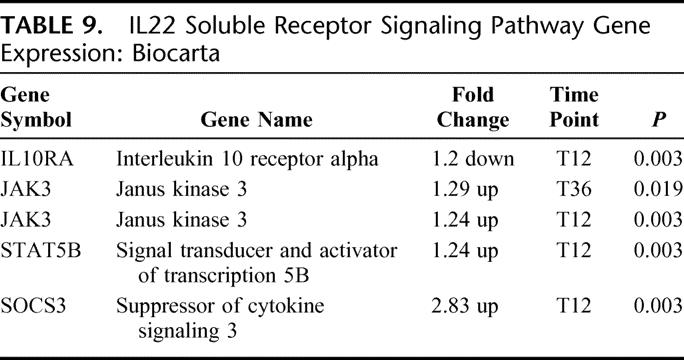
There were 4 differentially expressed genes in this pathway: 3 up-regulated and 1 down-regulated (EASE, P = 0.01) (Table 9). The IL-22 signaling pathway is closely associated with IL-10 signaling and shares common receptors. The gene expression for the IL-10 receptor was down-regulated. Increased downstream JAK/STAT pathway gene expression was noted beginning at T36 and continuing through T12. Marked increased gene expression for SOCS 3 was noted, suggesting attenuation of cytokine production.
TABLE 9. IL22 Soluble Receptor Signaling Pathway Gene Expression: Biocarta
Cytokine-Cytokine Receptor Interactions
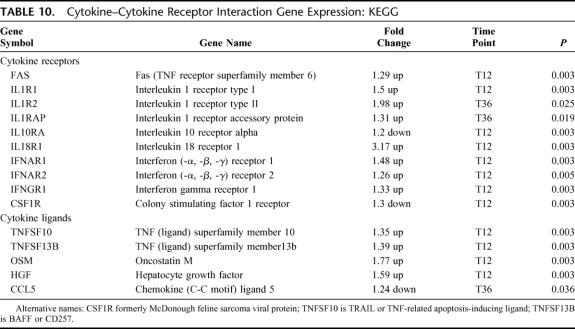
There were 15 differentially expressed genes in this pathway: 12 up-regulated and 3 down-regulated (EASE, P = 0.02) (Table 10). The broad pathway describing cytokines and their receptors was predominantly associated with up-regulation of cytokine receptors. Specifically increased gene expression for the IL-1/IL-18 receptor family and interferon receptors was present with IL-1 receptor gene expression manifested earliest at T36. Receptor down-regulation was only noted for IL10R and colony stimulating factor-1. Cytokine ligand gene expression was more diverse and unfocused. Ligands were up-regulated except for early down-regulation of the effector ligand, CCL5.
TABLE 10. Cytokine–Cytokine Receptor Interaction Gene Expression: KEGG
Signal Transduction Through IL-1R
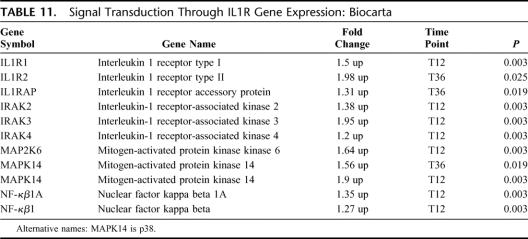
There were 10 differentially expressed genes in this pathway; all 10 were up-regulated (EASE, P = 0.03) (Table 11). This pathway involves the transmembrane IL-1 receptor and associated downstream intracellular signaling. As would be expected by the close association between TLR and IL-1R, similar gene expression for multiple overlapping intracellular signaling genes was found.
TABLE 11. Signal Transduction Through IL1R Gene Expression: Biocarta
T-Cell Differentiation
There were 3 pathways and 10 unique genes that were associated with T helper cell differentiation.
Chaperones Modulate Interferon Signaling Pathway
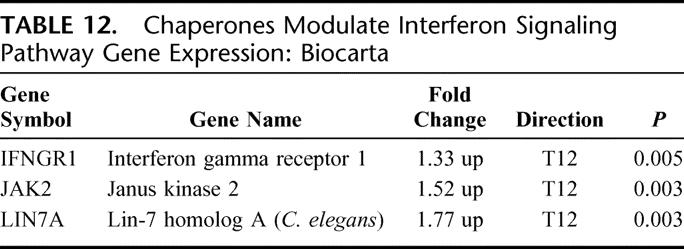
There were 3 differentially expressed genes in this pathway; all 3 were up-regulated (EASE, P = 0.03) (Table 12). Chaperones are intracellular proteins designed to conformationally transform and transport key signaling proteins to their appropriate structure and cellular location. Interferon receptors and the associated JAK 2 kinase were up-regulated as was the TAX binding scaffolding protein LIN 7A.
TABLE 12. Chaperones Modulate Interferon Signaling Pathway Gene Expression: Biocarta
TH1/TH2 Differentiation Pathway
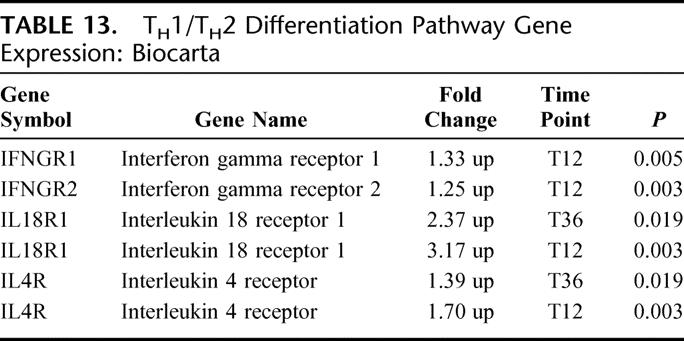
There were 4 differentially expressed genes in this pathway; all 4 were up-regulated (EASE, P < 0.05) (Table 13). The differentiation of naive T helper cells toward specific T helper cell subsets is dependent on key cytokines and cytokine receptors. Increased gene expression for interferon gamma receptors and interleukin 18 receptor are noted and consistent with TH1 cell differentiation, while increased IL 4 receptor gene expression is consistent with TH2 cell differentiation. IL-18 receptor and, to a lesser degree, IL-4 receptor gene expression, was increased at the T12 and T36, suggesting preferential TH1 cell differentiation.
TABLE 13. TH1/TH2 Differentiation Pathway Gene Expression: Biocarta
IL-12 and STAT4 Dependent Signaling Pathway in TH1 Development
There were 5 differentially expressed genes in this pathway; all 5 were up-regulated (EASE, P = 0.05) (Table 14). Consistent with other pathways promoting TH1 development, gene expression was up-regulated for this pathway, occurring as early as T36 hours for MAPK14 and IL18R1. Although neither IL-12R nor STAT4 was differentially expressed, other components of the pathway, including JAK2, MAP2K6, MAPK14, and STAT5, were up-regulated. Activation of this pathway leads to increased IL-18R expression, which was noted at both T12 and T36 time points.
TABLE 14. IL12 and STAT4 Dependent Signaling Pathway in TH1 Development Gene Expression: Biocarta
Protein Synthesis Regulation
There were 2 pathways and 25 unique genes associated with protein synthesis.
Apoptosis Pathway
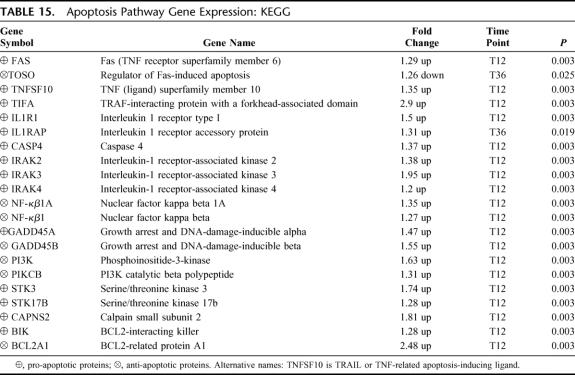
There were 21 differentially expressed genes in this pathway: 20 up-regulated and 1 down-regulated (EASE, P = 0.01) (Table 15). The complexity of cell death and survival, highlighted by the largest number of genes represented, demonstrates paradoxical pro-apoptotic and anti-apoptotic gene expression. Increased pro-apoptotic gene expression occurred with death domain receptor activation (FAS/TNFSF10 ligand, TIFA, IL-1R/IRAK, STKs, caspase) and direct activation of pro-apoptotic proteins (GADD45A, Calpain, BIK). Increased anti-apoptotic gene expression was related to NF-κβ1 (including GADD45B) and PI3K. All apoptosis pathway genes were up-regulated at T12 except the apoptosis inhibitor, TOSO, which was the only down-regulated gene and the only gene differentially expressed at T36.
TABLE 15. Apoptosis Pathway Gene Expression: KEGG
Regulation of eIF-4E and p70 S6 Kinase Pathway
There were 6 differentially expressed genes in this pathway; all 6 were up-regulated (EASE, P = 0.06) (Table 16). This pathway has an important role in mRNA translational regulation. The eIF-4E and eIF-4G subunits comprise the functional eIF-4F translational protein and both had increased expression. Activation of eIF components is via PI3K and MAPK14/MKNK1, which were up-regulated.
TABLE 16. Regulation of eIF4E and p70 S6 Kinase Gene Expression: Biocarta
RT-PCR Confirmation
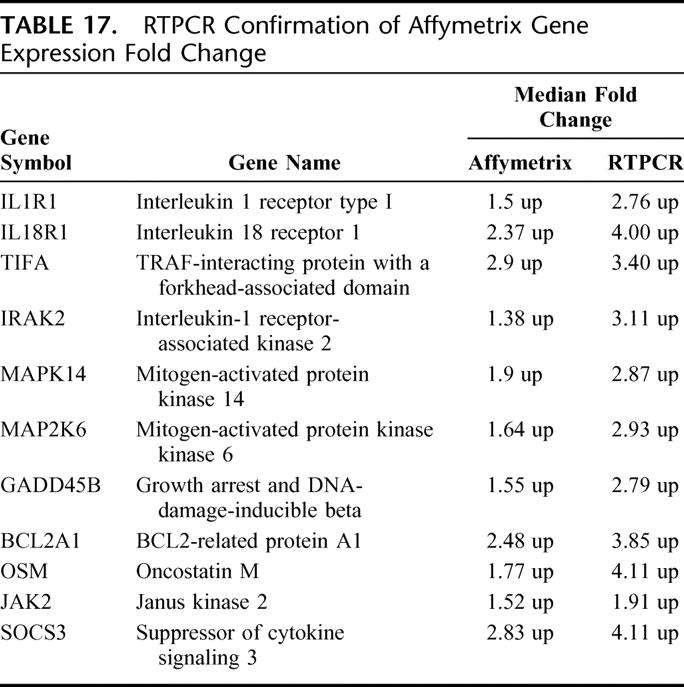
Among the unique genes annotated to pathways, select genes underwent RT-PCR confirmation to validate expression concordance. All demonstrated directional expression concordance, but variance in magnitude existed. Not surprisingly, RT-PCR demonstrated a greater magnitude of fold change than the Affymetrix gene chip analysis for every gene examined. The mean magnitude difference was 1.58 ± 0.36-fold greater for RT-PCR (Table 17).
TABLE 17. RTPCR Confirmation of Affymetrix Gene Expression Fold Change
DISCUSSION
Sepsis has been characterized as the presence of the SIRS in response to invasive infection. However, the clinical manifestations of SIRS can result from diverse etiologies, including but not limited to, infections, trauma, pancreatitis, ischemia-reperfusion injury, and burns. These clinical manifestations represent a hyperinflammatory physiologic derangement that is nonspecific to the initiating disease and can present diagnostic and therapeutic challenges. These challenges are not without consequences; the mortality of sepsis is nearly twice that of uninfected SIRS.2 Furthermore, the nonspecific SIRS phenotypic expression belies the possible complex interactions of unique underlying pathophysiologic processes specific to the initiating disease. The purpose of this study was to determine if a unique septic genotypic profile exists that is different from acute noninfectious inflammation and if it occurs prior to expression of the septic phenotypic profile. We were able to identify specific genes and pathways that could be functionally categorized and form the basis of the earliest specific human responses to pathogens.
There are numerous gene expression differences between septic patients and normal volunteers. Calvano et al4 demonstrated differential gene expression for 3714 unique genes in human volunteers given a single dose of LPS. Both up- and down-regulation of gene expression was noted between groups. Spatio-temporal changes were evident as a classic inflammatory “ebb and flow” response occurred over time following LPS injection, ultimately abating by 24 hours postinjection. Using univariate analysis, we found 12,783 or 23.4% of the analyzed gene probes corresponding to 7453 unique genes were differentially expressed between septic and uninfected SIRS patients prior to the appearance of clinical sepsis. Since both groups of patients demonstrated a hyperinflammatory response, these differences could be attributable to pathogen initiated processes. Assuming the human genome contains 30,000 genes,23 approximately 20% to 25% are uniquely expressed in response to pathogens. The large number of differentially expressed genes may relate to the clinical focus of our study; the stimuli were live bacteria and not exogenously administered toxin. Using a single dose of purified toxin versus continued stimulation by intact microbes may impact the gene expression changes observed. Wang et al demonstrated that monocyte gene expression is different depending if peptidoglycan or live Staphylococcus aureus was administered.24 Polymicrobial infections in intensive care units may also have contributed to increased differences in gene expression since differences are known to occur for gram-positive versus gram-negative infections.25
We expected that a large number of differentially expressed genes may in part be related to an implicit false discovery incidence. Therefore, prior to pathway annotation, we applied very strict acceptance criteria involving univariate and multivariate analysis coupled with minimum criteria for median fold change. The P value for each variable represents the false discovery probability for that variable by univariate analysis. By applying minimum threshold acceptance criteria, additional multivariate probability analysis, and subsequent pathway annotation, the false discovery rate was reduced to essentially nil while increasing the possible false negative rate. Using this high specificity approach, we demonstrated that 459 unique genes were differentially expressed prior to clinical sepsis. These 459 unique genes formed the basis of our subsequent pathway analysis. Functional annotation of these genes using DAVID 2.0/EASE provided pathways that were overrepresented relative to random distribution. This approach resulted in a high degree of certainty that genes and pathways identified were indeed present. Based on this approach, 11 functional pathways were identified, of which 10 were closely associated with inflammation and response to infection. As an indication that our process was accurate, we did not find any pathways related to cancer, cardiovascular disease, or development. The 10 identified inflammatory pathways could be grouped into 4 distinct themes: innate immunity, cytokine receptors, T cell differentiation, and protein synthesis regulation.
Innate immunity is a teleologically primitive, highly conserved early response to pathogens. Pathogens are recognized by specific pathogen recognition receptors, of which the TLRs are the best characterized.26,27 There are currently 11 TLR identified, with TLR-2 and TLR-4 recognizing gram positive and gram negative bacteria, respectively.28 We observed that increased expression of TLR-2, TLR-4, and TLR-5 occurred up to 24 hours prior to clinical sepsis. In addition, the accessory proteins for gram-negative and gram-positive pathogen recognition and processing, MD2 and peptidoglycan recognition protein, respectively, were also up-regulated at this time point. Closely associated with TLR gene up-regulation was the up-regulation of genes involved with intracellular signal transduction via the IRAK and MAPK pathways. The IRAK family is involved in MyD88-dependent TLR signaling29 and IRAK-4 deficient mice are unresponsive to TLR activation.30,31 Signal transduction via the IRAKs leads to NF-κβ activation and subsequent cytokine production.32 Interestingly, downstream effector genes (CCL5 and CD86) were down-regulated at T36 but not at the T12 time point suggesting normalization of early downstream down-regulation.
A major mechanism for intracellular signal transduction involves the mitogen-activated protein kinase (MAPK) canonical pathways. By repetitive protein phosphorylation, this trio of signaling cascade pathways are critical for the transmission of activated cell surface receptor signals to invoke multiple regulated intracellular processes. MAPK14 (p38) is the terminal MAP kinase involved in the p38/HOG pathway and is closely associated with MAPK kinase 6 (MAP2K6). Upon activation, p38 translocates from the cytosol to the nucleus where it is responsible for regulating the expression of multiple cytokines, cell surface receptors, and transcription factors.33 Up-regulation of MAPK14 (p38) occurred up to 48 hours prior to clinical sepsis and was the predominant MAPK pathway activated and consistent with innate immunity activation. This is similar to the finding of increased p38 activity early after cecal ligation and puncture induced sepsis observed by Maitra et al.34 Based on our findings, it is apparent that sepsis increases gene expression for TLRs and p38 MAPK pathways compared with uninfected inflammation and these changes occur early, prior to clinical sepsis.
The ability of cytokines to induce functional changes is dependent on the presence of transmembrane receptors capable of initiating intracellular signaling in response to binding of an appropriate ligand.35 Regulation of the intracellular signaling can be ligand and/or receptor oriented. Ligands can be available systemically, but receptors are only expressed on specific cells or clonal lines. Therefore, differential receptor regulation can allow highly specific and localized cellular activations. This would be important when attempting to compartmentalize an invasive infection.36 Consistent with this concept, but unlike others comparing sepsis with normal patients,37,38 we found no significant increase in common inflammatory cytokines (TNF, IL-1, IL-2, IL-6, IL-10, etc.) between uninfected and infected SIRS patients. The cytokine ligands differentially expressed appeared unfocused and associated with diverse functions including ligands related to apoptosis (TNFSF10/TRAIL), B cell survival (TNFSF13B/BAFF), and extracellular matrix degradation (oncostatin M). Sepsis induces changes in the extracellular matrix (ECM) by increasing matrix metalloproteinase-9 and reducing tissue inhibitor of metalloproteinase-1.39,40 Oncostatin M, an IL-6 family cytokine, increases MMP-9 and degrades the ECM,41 suggesting a role in early sepsis induced ECM changes.
As opposed to diffuse cytokine ligand activation, a more focused group of cytokine receptors, including the IL-1R family of receptors and the interferon receptors, were differentially expressed. Similar to others, we noted up-regulation of the IL-1 receptor family (IL-1R1, IL1R2, TLR, IL-18R) with downstream IRAK, MAPK, and NF-κβ gene expression up-regulation.42 Specific downstream intracellular signaling gene expression up-regulation was observed for IL-22 receptor pathway activation, which involves the Jak/STAT signal transduction cascade but also the inhibitor of cytokine signaling (SOCS3). SOC3 attenuates pro-inflammatory signaling and inhibits the expression of MHC II molecules.43 The observations of our study support the concept that receptor, more than ligand, regulation and expression are critical early in complex and highly specialized processes such as sepsis.
T helper cells can be divided into 3 subsets (TH0, TH1, TH2) depending on their cytokine production profile and immunologic response. TH1 cells are characterized by increased interferon, IL-12, and IL-18 with a cell-mediated immunity response preferentially directed at intracellular organisms. TH1 cells depend on T-bet and JAK/STAT (STAT1, 3, 4, 5) signaling pathways for cytokine production and differentiation.44,45 MAP2K6 and p38/MAPK pathway play important signaling roles in IL-12 induced STAT4 activation.46 TH2 cells are characterized by increased IL-4, IL-5, and IL-13 with an allergic immune response, especially against parasitic infections. TH2 cells depend on GATA3 and STAT6 for cytokine production and differentiation. TH0 cells are naive T helper cells with potential to differentiate into either TH1 or TH2 cells depending on cytokine influences.47 Our data support the preferential differentiation of TH0 cells into TH1 cells based on up-regulation of interferon receptors, IL-18 receptors, and p38/MAPK and JAK/STAT pathway components.
The role of apoptosis is fundamental to multiple normal and pathologic conditions. Apoptosis is the process of programmed cell death characterized by an inherent lack of inflammation.48 Multiple interacting pathways with complex, often paradoxical, patterns are the hallmark of apoptosis. Fundamental is the balance between pro-apoptotic mediators (FAS, Caspases, and Bax) and anti-apoptotic or cell survival mediators (BCL-2, PI3K, and NF-κβ).49 Early pro-apoptotic cell surface activation was demonstrated by increased gene expression for FAS (CD95), TNFSF10A (TRAIL), and TIFA with down-regulation of the FAS inhibitor, TOSO. FAS and TRAIL separately activate initiator caspases, such as caspase 4, via the FAS associated death domain.50 Decreased expression of TOSO, an inhibitor of apoptosis, is consistent with pro-apoptosis. The serine/threonine kinases (STK3, STK17b) are associated with both caspase-dependent and caspase-independent apoptosis, providing a bypass of caspase activation as well as amplification of caspase-induced apoptosis.51 Alternative pathways for apoptosis activation are via calpain mediated increased intracellular Ca++ concentration, and GADD45A (but not GADD45B) induced translocation of the pro-apoptotic protein BIM into mitochondria.52 We noted increased gene expression for STK3, STK17B, CAPNS2, and GADD 45A as evidence that pro-apoptosis activity was present by caspase-dependent and caspase-independent mechanisms.
We also found evidence of up-regulated anti-apoptotic gene expression, most notably for NF-κβ. NF-κβ favors cell survival by decreasing apoptosis53,54 and has been associated with SIRS, sepsis, and organ dysfunction.46,55 Indirectly, NF-κβ decreases apoptosis by suppressing JNK/MAPK pathway via GADD45B (but not GADD45A) inhibition of MKK7/JNKK2.56 Increased GADD45B gene expression in our study might explain the absence of JNK signaling gene expression. An additional mechanism for anti-apoptotic activity was up-regulation of PI3K signaling pathway. PI3K signaling via PDK1 induces AKT activity, thereby promoting cell survival under apoptotic conditions.57,58 Finally, BCL-2A is a key component of cell survival and was strongly up-regulated. Our study suggests that sepsis has increased expression of multiple anti-apoptotic genes that support cell survival. We could not, however, distinguish whether apoptosis or cell survival predominated, which is probably related to preferential development of specific cell lineages. Both pro-apoptotic and anti-apoptotic pathways were up-regulated prior to clinical sepsis.
Functionality of gene expression requires transcription products to undergo translation into proteins. Both p38/MAPK14 and PI3K pathways are involved with activation of translation proteins. A key step in the initiation of translation is the formation of eIF-4F from eIF-4G and eIF-4E, a process dependent on MKNK1 phosphorylation.59 These provide bonding between the 5′ cap and RNA helicase for subsequent protein synthesis. Our findings are consistent with early activation of protein synthesis machinery necessary for translation of RNA transcripts.
CONCLUSION
Using high-throughput oligonucleotide microarray analysis of critically ill SIRS patients, we demonstrated that sepsis has a unique gene expression profile that is different from uninfected systemic inflammation. These differences appear in themes embracing innate immunity, cytokine receptors, T helper cell differentiation, and protein synthesis. Furthermore, these genotypic differences occur prior to clinically apparent phenotypic changes and therefore may provide early diagnostic capabilities.
ACKNOWLEDGMENTS
The authors thank Carinda Field, PharmD, Bill Keating, MBA, Craig Whiteford, PhD, Bill Nussbaumer, Michael Towns, MD, Kelly Bochicchio, and the entire Critical Care Clinical Research Program at the University of Maryland in the performance of this study.
Footnotes
Reprints: Steven Bradley Johnson, MD, Division of Surgical Critical Care, University of Maryland School of Medicine, R. Adams Cowley Shock Trauma Center, 22 South Greene Street, Baltimore, MD 21201. E-mail: sbjohnson@umm.edu.
REFERENCES
- 1.Parrillo JE, Parker MM, Natanson C, et al. Septic shock in humans. Ann Int Med. 1990;113:227–242. [DOI] [PubMed] [Google Scholar]
- 2.Sprung CL, Sakr Y, Vincent J-L, et al. An evaluation of systemic inflammatory response syndrome signs in the sepsis occurrence in acutely ill patients (SOAP) study. Intensive Care Med. 2006;32:421–427. [DOI] [PubMed] [Google Scholar]
- 3.Papain JA, Hunter T, Palsson BO, et al. Reconstruction of cellular signaling networks and analysis of their properties. Nature Rev Mol Cell Biol. 2005;6:99–111. [DOI] [PubMed] [Google Scholar]
- 4.Calvano SE, Xiao W, Richards DR, et al. A network based analysis of systemic inflammation in humans. Nature. 2005;437:1032–1037. [DOI] [PubMed] [Google Scholar]
- 5.American College of Chest Physician/Society of Critical Care Medicine Consensus Conference. Definitions for sepsis and organ failure and guidelines for the use of innovative therapies in sepsis. Crit Care Med. 1992;20:864–874. [PubMed] [Google Scholar]
- 6.Bone RC, Sprung CL, Sibbald WJ. Definitions for sepsis and organ failure. Crit Care Med. 1992;20:724–726. [DOI] [PubMed] [Google Scholar]
- 7.Levy MM, Fink MP, Marshall JC, et al. SCCM/ESICM/ACCP/ATS/SIS International Sepsis Definitions Conference: 2003. Crit Care Med. 2001;31:1250–1256. [DOI] [PubMed] [Google Scholar]
- 8.www.preanalytix.com/RNA.asp
- 9.Feezor RJ, Baker HV, Mindrinos M, et al. Whole blood and leukocyte RNA isolation for gene expression analysis. Physiol Genomics. 2004;19:247–254. [DOI] [PubMed] [Google Scholar]
- 10.Cobb JP, Mindronos MN, Miller-Graziano CL, et al. Application of genome-wide expression analysis to human health and disease. Proc Nat Acad Sci USA. 2005;102:4801–4806. [DOI] [PMC free article] [PubMed] [Google Scholar]
- 11.Application Note: “Blocking of Globin Reverse Transcription to Enhance Whole Blood Gene Expression Profiling” available at http://www.genelogic.com
- 12.Troyanskaya O, Cantor M, Sherlock G, et al. Missing value estimation methods for DNA microarrays. Bioinformatics. 2001;17:520–525. [DOI] [PubMed] [Google Scholar]
- 13.Benjamini Y, Hochberg Y. Controlling the false discovery rate: a practical and powerful approach to multiple testing. J Royal Stat Soc B. 1995;57:289–300. [Google Scholar]
- 14.Tibshirani R, Hastie T, Narasimhan B, et al. Diagnosis of multiple cancer types by shrunken centroids of gene expression. Proc Nat Acad Sci USA. 2002;99:6567–6572. [DOI] [PMC free article] [PubMed] [Google Scholar]
- 15.Breiman L, Friedman J, Olshen R, et al. Classification and Regression Trees. New York: Chapman and Hall, 1984. [Google Scholar]
- 16.Friedman JH. Stochastic gradient boosting. Comput Stat Data Anal. 2002;38:367–378. [Google Scholar]
- 17.Breiman L. Random forests. Machine Learning. 2001;45:5–32. [Google Scholar]
- 18.Dennis G Jr, Sherman BT, Hosack DA, et al. DAVID: Database for Annotation, Visualization, and Integrated Discovery. Gen Bio. 2003;4:P3. [PubMed] [Google Scholar]
- 19.Hosack DA, Dennis G, Sherman BT, et al. Identifying biological themes within lists of genes with EASE. Gen Biol. 2003;4:P4. [DOI] [PMC free article] [PubMed] [Google Scholar]
- 20.Kanehisa M, Goto S. KEGG: Kyoto Encyclopedia of Genes and Genomes. Nucleic Acids Res. 2000;28:27–30. [DOI] [PMC free article] [PubMed] [Google Scholar]
- 21.Kanehisa M, Goto S, Hattori M, et al. From genomics to chemical genomics: new developments in KEGG. Nucleic Acids Res. 2006;34:D354–D357. [DOI] [PMC free article] [PubMed] [Google Scholar]
- 22.Biocarta Pathways available at http://www.biocarta.com/genes/index.asp.
- 23.International Human Genome Sequencing Consortium. Initial sequencing and analysis of the human genome. Nature. 2001;409:860–921. [DOI] [PubMed] [Google Scholar]
- 24.Wang ZM, Liu C, Dziarski R. Chemokines are the main proinflammatory mediators in human monocytes activated by Staphylococcal aureus, peptidogylcan, and endotoxin. J Biol Chem. 2000;275:20260–20267. [DOI] [PubMed] [Google Scholar]
- 25.Feezor RJ, Oberholzer C, Baker HV, et al. Molecular characterization of the acute inflammatory response to infections with gram-negative versus gram-positive bacteria. Infect Immun. 2003;71:5803–5813. [DOI] [PMC free article] [PubMed] [Google Scholar]
- 26.Beutler B. Key inflammatory and stress pathways in critical illness: the central role of Toll-like receptors. Crit Care. 2003;7:39–46. [DOI] [PMC free article] [PubMed] [Google Scholar]
- 27.Hallman M, Ramet M, Ezekowitz RA. Toll-like receptors as sensors of pathogens. Pediatr Res. 2001 50:315–321. [DOI] [PubMed] [Google Scholar]
- 28.Takeda K, Kaisho T, Akira S. Toll-like receptors. Annu Rev Immunol. 2003;21:335–376. [DOI] [PubMed] [Google Scholar]
- 29.Medzhitov R. MyD88 is an adaptor protein in the hToll/IL-1 receptor family signaling pathways. Mol Cell. 1998;2:253–258. [DOI] [PubMed] [Google Scholar]
- 30.Suzuki N, Suzuki S, Duncan GS, et al. Severe impairment of interleukin-1 and Toll-like receptor signaling in mice lacking IRAK-4. Nature. 2002;416:750–756. [DOI] [PubMed] [Google Scholar]
- 31.Moynagh PN. TLR signaling and the activation of IRFs: revisiting old friends from the NF-κβ pathway. Trends Immunol. 2005;26:469–476. [DOI] [PubMed] [Google Scholar]
- 32.Rudolph D, Yeh WC, Wakeham A, et al. Severe liver degeneration and lack of NF-κβ activation in NEMO/IKK deficient mice. Genes Dev. 2000;14:854–862. [PMC free article] [PubMed] [Google Scholar]
- 33.Ono K, Han J. The p38 signal transduction pathway: activation and function. Cell Signal. 2000;12:1–13. [DOI] [PubMed] [Google Scholar]
- 34.Maitra SR, Chen E, Rosa D, et al. Modulation of signal transduction pathways during sepsis and the effects of insulin and mifepristone. Acad Emerg Med. 2003;10:1–8. [DOI] [PubMed] [Google Scholar]
- 35.Grotzinger J. Molecular mechanisms of cytokine receptor activation. Biochim Biophys Acta. 2002;1592:215–223. [DOI] [PubMed] [Google Scholar]
- 36.LePoul E, Loison C, Struyf S, et al. Functional characterization of human receptors for short chain fatty acids and their role in polymorphonuclear cell activation. J Biol Chem. 2003;278:25481–25489. [DOI] [PubMed] [Google Scholar]
- 37.Van der Poll T, Lowry SF. Tumor necrosis factor in sepsis: mediator of multiple organ failure or essential part of host defense? Shock. 1995;3:1–12. [DOI] [PubMed] [Google Scholar]
- 38.Ulloa L, Tracey K. The cytokine profile: a code for sepsis. Trends Mol Med. 2005;11:56–63. [DOI] [PubMed] [Google Scholar]
- 39.Pagenstecher A, Stalder AK, Kincaid CL, et al. Regulation of matrix metalloproteinases and their inhibitor genes in lipopolysaccharide-induced endotoxemia in mice. Am J Pathol. 2000;157:197–210. [DOI] [PMC free article] [PubMed] [Google Scholar]
- 40.Johnson SB, Bochicchio G, Shanholtz C, et al. Uninfected systemic inflammatory response syndrome (SIRS) or future sepsis? Differences in extracellular matrix modulators prior to onset of clinical sepsis. Chest. 2005;128(suppl):221. [Google Scholar]
- 41.Nagata T, Kai H, Shibata R, et al. Oncostatin M, an interleukin-6 family cytokine, upregulates matrix metalloproteinase-9 through the mitogen-activated protein kinase kinase-extracellular signal-regulated kinase pathway in cultured smooth muscle cells. Arterioscler Thromb Vasc Biol. 2003;23:588–593. [DOI] [PubMed] [Google Scholar]
- 42.Martin MU, Wesche H. Summary and comparison of the signaling mechanisms of the Toll/interleukin-1 receptor family. Biochim Biophys Acta. 2002;1592:265–280. [DOI] [PubMed] [Google Scholar]
- 43.Jo D, Liu D, Yao S, et al. Intracellular protein therapy with SOCS3 inhibits inflammation and apoptosis. Nat Med. 2005;11:892–898. [DOI] [PubMed] [Google Scholar]
- 44.Rogge L, Barberis-Maino L, Biffl M, et al. Selective expression of an interleukin-12 receptor component by human helper 1 cells. J Exp Med. 1997;185:825–831. [DOI] [PMC free article] [PubMed] [Google Scholar]
- 45.Uddin S, Lekmine F, Sassano A, et al. Role of STAT5 in type I interferon signaling and transcriptional regulation. Biochem Biophys Res Commun. 2003;308:325–330. [DOI] [PubMed] [Google Scholar]
- 46.Visconti R, Gadina M, Chiariell M. Importance of the MKK6/p38 pathway for IL-12 induced STAT4 serine phosphorylation and transcriptional activity. Blood. 2000;96:1844–1852. [PubMed] [Google Scholar]
- 47.Farrar JD, Asnagli, Murphy KM. T helper subset development: roles of instruction, selection, and transcription. J Clin Invest. 2002;109:431–435. [DOI] [PMC free article] [PubMed] [Google Scholar]
- 48.Power C, Fanning N, Redmond HP. Cellular apoptosis and organ injury in sepsis. Shock. 2002;19:197–211. [DOI] [PubMed] [Google Scholar]
- 49.Siegel RM. Caspases at the crossroads of immune-cell life and death. Nat Immunol Rev. 2006;6:308–317. [DOI] [PubMed] [Google Scholar]
- 50.Peter ME, Krammer PH. The CD95 (APO-1/FAS) DISC and beyond. Cell Death Differ. 2003;10:26–35. [DOI] [PubMed] [Google Scholar]
- 51.Lee K-K, Ohyama T, Yajima N, et al. MST, a physiological caspase substrate, highly sensitizes apoptosis both upstream and downstream of caspase activation. J Biol Chem. 2001;276:19276–19285. [DOI] [PubMed] [Google Scholar]
- 52.Tong T, Ji J, Jin S, et al. GADD45A expression induces Bim dissociation from the cytoskeleton and translocation to mitochondria. Mol Cell Biol. 2005;25:4488–4500. [DOI] [PMC free article] [PubMed] [Google Scholar]
- 53.Kam PCA, Ferch NI. Apoptosis: mechanisms and clinical implications. Anaesthesia. 2000;55:1081–1093. [DOI] [PubMed] [Google Scholar]
- 54.Kucharczak JK, Simmons MJ, Fan Y, et al. To be, or not to be: NF-κβ is the answer – role of Rel/NF-κβ in the regulation of apoptosis. Oncogene. 2003;22:8961–8982. [DOI] [PubMed] [Google Scholar]
- 55.Cobb JP, Hotchkiss RS, Karl IE, et al. Mechanisms of cell injury and death. Br J Anaesth. 1996;77:3–10. [DOI] [PubMed] [Google Scholar]
- 56.Papa S, Zazzeroni F, Bubici C, et al. GADD45B mediates the NF-κβ suppression of JNK signaling by targeting MKK7/JNKK2. Nat Cell Biol. 2004;6:146–153. [DOI] [PubMed] [Google Scholar]
- 57.Franke TF, Hornik CP, Segev L, et al. PI3K/Akt and apoptosis: size matters. Oncogene. 2003;22:8983–8998. [DOI] [PubMed] [Google Scholar]
- 58.Toker A, Newton AC. Cellular signaling: pivoting around PDK-1. Cell. 2000;103:185–188. [DOI] [PubMed] [Google Scholar]
- 59.Herbert TP, Kilhams GR, Batty IH, et al. Distinct signaling pathways mediate insulin and phorbol ester stimulated eukaryotic initiation factor 4F assembly and protein synthesis in HEK 293 cells. J Biol Chem. 2000;275:11249–11256. [DOI] [PubMed] [Google Scholar]


