Abstract
PDCD10 (programmed cell death 10, TFAR15), a novel protein associated with cell apoptosis has been recently implicated in mutations associated with Cerebral Cavernous Malformations (CCM). Yeast two-hybrid screening revealed that PDCD10 interacts with MST4, a member of Ste20-related kinases. This interaction was confirmed by coimmunoprecipitation and colocalization assays in mammalian cells. Furthermore, the co-overexpression of PDCD10 and MST4 promoted cell proliferation and transformation via modulation of the extracellular signal-regulated kinase (ERK) pathway. Potent short interfering RNAs (siRNAs) against PDCD10 (siPDCD10) and MST4 (siMST4) were designed to specifically inhibit the expression of PDCD10 and MST4 mRNA, respectively. The induction of siPDCD10 or siMST4 resulted in decreased expression of endogenous PDCD10 or MST4, which was accompanied by reduced ERK activity and attenuated cell growth and anchorage-independent growth. On the other hand, siMST4 had similar effects in PDCD10-overexpressed cells. And more importantly, we confirmed that either overexpressing or endogenous PDCD10 can increase the MST4 kinase activity in vitro. Our results demonstrated that PDCD10 modulation of ERK signaling was mediated by MST4, and PDCD10 could be a regulatory adaptor necessary for MST4 function, suggesting a link between cerebral cavernous malformation pathogenesis and the ERK-MAPK cascade via PDCD10/MST4.
INTRODUCTION
Programmed cell death 10 (PDCD10) gene, also named TFAR15 (TF-1 cell apoptosis-related gene 15), was initially cloned in our laboratory utilizing a human myeloid cell line, TF-1, in which apoptosis was induced by deprivation of granulocyte macrophage colony-stimulating factor (GM-CSF; Wang et al., 1999). PDCD10, a 50-kb gene, was mapped to 3q26.1 and was bracketed by HDR49 and SERPINI1. Three alternative transcripts have been identified as encoding the same protein, differing only in their 5′ untranslated regions (GenBank accession numbers NM_007217, NM_145859, and NM_145860). The coding portion of the cDNA encodes a 212-aa predicted protein (http://www.ncbi.nlm.nih.gov/entrez/dispomim.cgi?id = 609118). Database searches confirmed that PDCD10 is highly conserved from nematode to human. Analysis of protein databases (ExPASy Proteomics Server) suggested that the PDCD10 Homo sapiens coding sequence did not contain a signal peptide (http://www.cbs.dtu.dk/services/SignalP/), a transmembrane domain (http://www.cbs.dtu.dk/services/TMHMM/), or any known functional domain (http://myhits.isb-sib.ch/cgi-bin/motif_scan, http://elm.eu.org/, http://www.expasy.org/tools/scanprosite/).
Previous research has suggested that the PDCD10 protein may be associated with cell apoptosis and tumors. The PDCD10 gene was found to be up-regulated in denervated skeletal muscle atrophy, and recombinant PDCD10 inhibited natural cell death in fibroblast cell lines (with the exception of TF-1) exposed to specific apoptosis inducers, such as staurosporine, cycloheximide, or TNF-a (Wang et al., 1999; Wu et al., 2002; Lu et al., 2004). These preliminary data showed PDCD10 can function as an antiapoptotic gene. Moreover, gene chip data suggested that it may play a role in tumor signaling, as it was shown to be up-regulated in pancreatic adenocarcinomas (Aguirre et al., 2004), metastatic colon cancer cells resistant to cisplatin-induced apoptosis (Huerta et al., 2003), laryngeal squamous cell carcinoma (Chen et al., 2001), apoptotic hepatic cancer Q-GY27703 cells mediated by antitumor agent cantharidin (Hu et al., 2003), and hepatocellular carcinoma HepG2 cells transduced with the interferon-γ gene (Jiang et al., 2001). Additionally, inhibition of the nematode PDCD10 ortholog was lethal in 40% of embryos and resulted in a dumpy phenotype in viable postembryonic embryos (Kamath et al., 2003). However, the pathways and mechanisms of action that lead to these phenotypic features have not been fully elucidated. Although recent research suggested mutations within the PDCD10 gene were responsible for cerebral cavernous malformations (CCM; Bergametti et al., 2005; Guclu et al., 2005), little is known about the role of PDCD10 in cellular functions or in angiogenesis and/or remodeling of cerebral vessels.
MST4 (H. sapiens Mst3 and SOK1-related kinase [MASK]), a member of the protein family that shares similarity with sterile-20 (Ste20), a budding yeast serine/threonine kinase, was cloned and characterized by three independent research groups (Qian et al., 2001; Lin et al., 2001; Dan et al., 2002). Northern blot analysis indicated that MST4 was ubiquitously distributed and its gene was localized to a disease-rich associated region in chromosome Xq26. It was also suggested that MST4 played a role in mitogen-activated protein kinase (MAPK) signaling during cytoskeletal rearrangement, morphogenesis, apoptosis, and other diverse cellular events (Dan et al., 2002). There is also evidence indicating that MST4 influences cell growth and transformation by modulating a ras/raf-independent extracellular signal-regulated kinase (ERK) pathway (Lin et al., 2001). Recent research demonstrated that the Ste20 kinases, MST4 and YSK1, were targeted to the Golgi apparatus via the Golgi matrix protein GM130, a scaffold protein and activator of MST kinases and that binding to GM130 activated YSK1 and MST4. Activated YSK1 phosphorylated 14-3-3ζ and potentially other downstream targets needed for normal cell migration, whereas MST4 acted via an uncharacterized pathway (Preisinger et al., 2004), suggesting that signals from the Golgi matrix played an important part in cell motility by allowing reorientation of the Golgi toward the direction of movement (Mellor, 2004). Additional research suggested a role for MST4 in tumor formation because MST4 expression in prostate carcinoma tumor samples and cell lines was correlated with tumorigenicity and AR status, whereas its overexpression induced anchorage-independent growth and tumorigenesis; these findings are consistent with the possibility that MST4 may modulate signal transduction during prostate cancer progression (Sung et al., 2003). Although the mechanism of MST4 regulation and distribution is not yet clear, it was reported that phosphorylation and dimerization regulated nucleocytoplasmic shuttling of mammalian STE20-like kinases (Lee and Yonehara, 2002). Moreover, MST3, a member of the mammalian Ste20 kinase family closely related to MST4, might contain a bipartite-like nuclear localization sequence (NLS) at the C-terminus of its kinase domain (residues 278–292), a sequence found to be highly conserved between MST3 and MST4 (Lee et al., 2004).
In the present study, yeast two-hybrid screening data indicated that PDCD10 interacted with MST4, and the interaction was confirmed by coimmunoprecipitation and colocalization in cell lines. Our data also demonstrated that PDCD10 interacted with MST4 to promote cell growth and transformation by modulating the ERK pathway.
MATERIALS AND METHODS
Cell Lines and Reagents
Human embryonic kidney cell line HEK293, human cervix carcinoma cell line HeLa, and human prostate cancer cell line PC-3 were obtained from the American Type Culture Collection (Manassas, VA). HEK293 and HeLa were cultured (37°C, 5% CO2 humidified atmosphere) in DMEM (Invitrogen, Carlsbad, CA) containing 10% FBS (Hyclone, Logan, UT) and supplemented with, 2 mM l-glutamine (Invitrogen). PC-3 cells were cultured (37°C, 5% CO2) in RPMI 1640 (Invitrogen) supplemented with 10% fetal bovine serum and 2 mM l-glutamine. Polyclonal rabbit-antibody against ERK and phosphorylated-ERK were obtained from KangChen Bio-tech (Shanghai, China); monoclonal mouse-antibody against β-actin and c-myc from Sigma (Sigma-Aldrich, St. Louis, MO); TRITC-conjugated goat anti-mouse immunoglobulin from Zhongshan Co. (Beijing, China); IRD Fluor 780–labeled IgG secondary antibodies from Odyssey (Lincoln, NE); DAPI from Sigma and transfection reagent Lipofectamine 2000 from Invitrogen.
Preparation of mAb against PDCD10
The GST-PDCD10 plasmid was constructed by inserting the open reading frame (ORF) of PDCD10 into a pGEX4T-3 expression vector (Amersham Pharmacia Biotech, Little Chalfont, United Kingdom). GST-fusion proteins were expressed in Escherichia coli BL21 in the presence of 0.5 mM isopropyl-1-thio-b-galactopyranoside and then purified. BALB/c mice were immunized with recombinant human PDCD10 protein, and spleen cells were fused with mouse myeloma Sp2/0 in the presence of polyethylene glycerol using standard techniques. Hybridoma cell lines producing antibodies were screened by indirect ELISA. One clone, named 5G1, was subcloned by limiting dilution and ascites fluid was prepared using pristine primed BALB/c mice; 5G1 IgG was purified with Hitrap1 protein G (Amersham Pharmacia Biotech) and used in Western blotting and knockdown analysis of PDCD10.
Yeast Two-Hybrid Screening
The two-hybrid screening system has been previously described (Ito et al., 2000). Briefly, the library consisted of 1500 known genes associated with cell apoptosis, cell proliferation, and cell cycles. Each ORF was amplified by PCR using Pfu DNA polymerase and cloned into pGBK-RC, a Gal4 DNA-binding domain-based bait vector, and pGAD-RC, a Gal4 activation domain-based prey vector, following the MATCHMAKER GAL4 Two-Hybrid System 3 and Libraries User Manual PT3247-1 (PR94575)” protocol (Clontech, Mountain View, CA). Plasmids with inserts of expected sizes were confirmed by colony PCR followed by agarose gel electrophoresis. PDCD10 bait vector and prey vectors were cotransfected in yeast Y190 and spread into SD/-T-L-H. Formed colonies were picked out, cracked in liquefacient nitrogen, and subsequently utilized in colony lift filter assays.
Coimmunoprecipitation
The c-Myc epitope (EQKLISEEDL) was inserted at the amino termini of Y2H positive clones by PCR mutagenesis, using a Stratagene Robocycler with Hot-Top assembly (Amsterdam, Holland) as described by Nelson and Long (1989). The FLAG epitope (DYKDDDDK) was inserted, by a similar procedure, into the amino termini of PDCD10. PCR products were cloned into the eukaryotic expression vector pCDEF (Invitrogen) using standard techniques (Davis et al., 1994). Inserts were confirmed by DNA sequencing. Transient transfection of HEK-293 cells with the epitope-tagged constructs was performed by calcium phosphate–mediated gene transfer as previously described (Chen and Okayama, 1988). After transfection (48 h) cells were washed three times in phosphate-buffered saline (PBS), harvested by scraping, and centrifuged (5 min, 500 × g). Pelleted cells were homogenized in cell lysis buffer (1 ml, 4°C, Sigma-Aldrich) utilizing a 20-gauge syringe needle. Homogenates were centrifuged (20 min, 14,000 × g, 4°C), and supernatants were combined with 12.5 μl (packed gel) of either anti-c-Myc or anti-FLAG M2 affinity agarose (Sigma-Aldrich), and then mixed overnight (4°C). Immunoadsorbents were recovered by centrifugation (5 min, 700 × g) and washed three times by resuspension and centrifugation (5 min, 700 × g) in cell lysis buffer and twice in 50 mM Tris (pH 7.5) containing 0.1% (wt/vol) SDS and 150 mM NaCl. Samples were eluted into 60 μl of SDS loading buffer (Sigma-Aldrich).
For endogenous coimmunoprecipitation assay, 1 × 10⁷ HeLa cells were collected and resuspended in 0.5 ml of lysis buffer (50 mM Tris, pH 8, 0.4% Nonidet P-40, 300 mM NaCl, 10 mM MgCl2, 2.5 mM CaCl2) supplemented with protease inhibitors (Complete EDTA free; Roche Diagnostics, Alameda, CA) and DNase (10 U/μl; Roche) and incubated for 10 min on ice. One-tenth of the lysate was saved for immunoblotting, and the rest was used for two parallel immunoprecipitations followed by immunoblotting. We used the mouse anti-PDCD10 antibody, and the rabbit anti-MST4 antibody, respectively. Immunoprecipitation was performed with protein G beads (for anti-HA) for 2 h at 4°C, followed by three washes with wash buffer (50 mM Tris, pH 8, 150 mM NaCl, 5 mM MgCl2, 0.4% Nonidet P-40). Bound proteins were loaded on SDS-polyacrylamide gel electrophoresis gels. Western blotting was performed by standard procedures and revealed by the LI-COR Infrared Imaging System (Odyssey, Cincinnati, OH) and analyzed with Odyssey software.
Cell Transfection and Microscopy
Transfection of HEK293, HeLa, and PC-3 cells was performed by electroporation utilizing pCDEF (Invitrogen), pCDEF-flag-PDCD10, and pCDEF-myc-MST4 plasmids. Cells (2 × 10⁶) were mixed with 10 μg DNA in 400 μl serum-free medium and then electroporated with a 120-V, 20-ms pulse using a BTX T820 square-wave electroporator in a 2-mm cuvette (BTX, San Diego, CA). Transfection efficiency was monitored by a pEGFP-N1 plasmid (Clontech). Cells with more than 75% transfection efficiency were used for further experiments. To obtain stable transfections, plasmids were linearized by BspHI before transfection, and 800 μg/ml geneticin was added to cultures 36 h after transfection. Cell clones stably transfected with empty vector, PDCD10, and MST4 expression vector were then picked.
Cells were transiently transfected with pEGFP-C3-PDCD10 and pDsred-N1-MST4 and then plated on glass coverslips and cultured 24 h before processing for immunofluorescence microscopy. Cells were fixed (30 min, room temperature, 3% PFA, wt/vol), quenched (10 min, 50 mM ammonium chloride), and permeabilized (5 min, 0.1% Triton X-100, vol/vol). All solutions were made in PBS. Coverslips mounted in 10% (wt/vol) Moviol 4-88, 1 μg/ml DAPI, 10% (wt/vol) glycerol in PBS. Fluorescence microscopy mages were collected with an Axioskop-2 microscope (Olympus, Tokyo, Japan), a 40× NA 0.75 Plan Apochromat oil immersion objective, standard filter sets (Leika MicroImaging, Mannheim, Germany), a 1300 × 1030 pixel-cooled CCD camera (model CCD-1300-Y; Princeton Instruments, Trenton, NJ), and Metavue software (Visitron Systems, Puchheim, Germany).
For the endogenous immunofluorescence microscopy of PDCD10 and MST4, the HeLa cells were plated on glass coverslips and cultured 24 h before processing. Cells were fixed, quenched, and permeabilized in the same manner. Then cells were costained with anti-PDCD10 antibody and fluorescein isothiocyanate (FITC)-conjugated goat anti-mouse IgG, anti-MST4 antibody, and tetramethylrhodamine isothiocyanate (TRITC)-conjugated bovine anti-rabbit IgG in turn. Afterward the coverslips were handled, and the cells were detected in the same manner.
PDCD10 and MST4 Small Interfering RNAs Synthesis, Construction of shRNA, Electroporation, and Transfection
Double-stranded small interfering RNAs (siRNAs) were designed, chemically synthesized, and PAGE-purified, free of RNase contamination, according to manufacturer's instructions (Genechem, Shanghai, China; Table 1). A BLAST search confirmed the nonsilencing siRNA had no matches with the complete human genome (www.ncbi.nlm.nih.gov). The siRNAs were dissolved to a concentration of 20 μM with buffer containing 20 mM KCl, 6 mM HEPES, pH 7.5, and 0.2 mM MgCl2. Cell culture medium was renewed before each experiment. Cell density was adjusted to 1 × 10⁶/350 μl, and indicated amounts of siRNAs, alone or combined with plasmid, were added before electroporation (20-ms pulse length, 120 V). Cells were allowed to recuperate (room temperature, 10 min) before platting and were cultured in the corresponding complete cell culture medium for the indicated time. Nonsilencing siRNA and siPDCD10-1 were inserted into pGCsi-U6 vectors for colony forming and anoikis assay.
Table 1.
Sense sequences of indicated siRNAs
| siRNA | Targeting sequence |
|---|---|
| siPDCD10-1 | 5′-GGCAAUAAAUGUGUUCGUA-3′ |
| siPDCD10-2 | 5′-GUGCCAACCGACUAAUUCA-3′ |
| siMST4-1 | 5′-CCAGAUUGCUACCAUGCUA-3′ |
| siMST4-2 | 5′-GAAGCCUGAUCCAAAGAAA-3′ |
| GFP siRNA | 5′-GCAAGCUGACCCUGAAGUUC-3′ |
| Nonsilencing siRNA | 5′-UUCUCCGAACGUGUCACGU-3′ |
RT-PCR analysis
Cells were collected at indicated time points, RNA was prepared using TRIzol reagent (Invitrogen) and reverse transcription (RT) was performed with ThermoSCRIPT RT-PCR System (Invitrogen), according to the manufacturer's protocol. Total RNA (1 μg) was used for the first-strand cDNA synthesis using oligo(dT)15–18 primers and PCR amplification primers and conditions as follows: PDCD10 forward: 5′-ATGAGGATGACAATGGAAGAGATG -3′; reverse: 5′- TCAGGCCACAGTTTTGAAGGT -3′, one cycle (94°C, 5 min), 30 cycles (94°C, 30 s; 55°C, 60 s; 72°C, 30 s) followed by an extension cycle (72°C, 7 min). For GAPDH (internal control) primers were, forward: 5′-CCACCCATGGCAAATTCCATGGCA-3′; reverse: 5′-TCTAGACGGCAGGTCAGGTCAGGTCCACC-3′, and PCR reaction was performed at an annealing temperature of 56°C for 25 cycles. PCR products were separated utilizing a 1.0% agarose gel electrophoresis and visualized by ethidium bromide staining.
Fluorescence Microscopy and Flow Cytometry Analysis of the Effects of siRNAs against PDCD10 or MST4
To determine the transfection efficiency and the inhibitory effect of siRNAs, cells transfected with both pEGFP-PDCD10 plasmid and nonsilencing siRNA or siRNA against PDCD10 (siPDCD10-1, -2), were plated in 24-well plates. Growth medium was changed once (10 h later) to ensure optimal cell survival. At 24 h after transfection, cells expressing GFP-PDCD10 fusion protein were observed by fluorescence microscopy (Olympus, Melville, NY) and images were captured utilizing a CCD camera. Then cells were harvested, washed twice with PBS, resuspended in 500 μl PBS, and immediately analyzed by FACS (fluorescence-activated cell sorting) Calibur (1 × 10⁴ cells) and CELLQuest software (BD Bioscience, San Jose, CA). Similar experiments were carried out for siRNA against MST4 (siMST4-1, -2).
Proliferation Assays
Cells (1000 cells/well) were seeded in 96-well plates for MTT (3-(4,5-dimethyldiazol-2-yl)-2,5 diphenyl tetrazolium bromide) colorimetric assay. At the indicated time points, MTT solution (Sigma-Aldrich) was added, and samples were incubated (4–6 h). Formazan dye was then solubilized and the absorbance was measured at 570 nm. DNA synthesis was assessed utilizing [3H]thymidine ([3H]TdR), which was added (1 μCi/ml) at the indicated time points; samples were incubated (6 h), and cells were harvested by a TOMTEC Harvester 96R onto a 96-well Filtermat (Perkin Elmer-Cetus, Torrance, CA). The incorporation of 3H-TdR was determined (n = 3 per experiment) with MicroBeta Windows Workstation software (Perkin Elmer-Cetus).
Colony-forming Assay
The assay was performed as previously described (Srikantan et al., 2002). In brief, PC-3 cells transfected with PDCD10, MST4, pGC-PDCD10 expression vector, or empty vector were plated (200 or 400 cells/35-mm dish) and 800 μg/ml geneticin was added 48 h after transfection, with the medium changed every 3 d. Geneticin-resistant colonies were fixed, on day 15, with 2% PFA/PBS and counted after crystal violet staining.
Anoikis Assay and Flow Cytometry Analysis
Anoikis assays were performed as described by Frisch and Francis (1994). Tissue culture plates were coated twice with Poly-HEME (4 mg/ml in ethanol; Sigma) and rinsed extensively with PBS. Stable cells (1 × 10⁶) transfected with various overexpression vectors of PDCD10, MST4, siRNA against PDCD10 and MST4, and with pCDEF vector plasmid (10 μg) and nonsilencing siRNA as mock, were resuspended in RPMI 1640 and plated on Poly-HEME plates. Cells were harvested 24 h after transfection, washed twice with PBS, resuspended in 200 μl annexin-V binding buffer (10 mM HEPES, 140 mM NaCl, 2 mM MgCl2, 5 mM KCl, 2.5 mM CaCl2, pH 7.4) and incubated (20 min, in the dark, room temperature) with FITC-conjugated annexin V (10 μl, Beijing Biosea Biotechnology, Beijing, China). Binding buffer (400 μl) was then added, and samples were immediately analyzed by FACS Calibur (1 × 10⁴ cells) and CELLQuest software (BD Bioscience).
Dual-Luciferase Reporter Assay
Cells were transfected (24 h) with pRL-TK vector, 5× gal-luciferase reporter gene and Gal4-ELK1 (Stratagene, La Jolla, CA) and expression vectors PDCD10 and MST4, with pCDEF as the blank control and then serum-starved (24 h) before harvesting of cell lysates with lysis buffer, as described above. Relative luciferase activity (firefly luciferase for reporter and renilla luciferase activity for normalization of transfection efficiency) was measured following manufacturer's instructions (Promega, Madison, WI). Reporter assays (n = 3 per experiment) were performed after treatment (12 h) with PD98059 (5 μM, Calbiochem, Darmstadt, Germany), C-Jun N-terminal kinase (JNK) inhibitor II (0.1 μM, Calbiochem), or SB202190 (10 μM, Calbiochem).
Western Blot Analysis
Treated cells were pelleted by centrifugation and lysed in lysis buffer (10 mM HEPES, pH 7.4, 0.15 M NaCl, 1 mM EDTA, 1 mM EGTA, 1% Triton X-100, 0.5% NP-40, 0.05% SDS with proteinase inhibitor cocktail freshly added) for 30 min on ice. Cell lysates were centrifuged (18,000 × g, 20 min, 4°C), and total supernatant protein concentration was measured using a BCA protein assay kit (Pierce, Rockford, IL) with bovine serum albumin as standard. Total protein (30 μg) was separated by 12.5% SDS-PAGE, transferred to nitrocellulose membranes (Hybond, ECL, Amersham Pharmacia), blocked with Tris-buffered saline containing 0.1% Tween-20 (TBS-T) and 5% nonfat milk (2 h, room temperature), incubated with corresponding primary antibody (overnight, 4°C), washed with TBS-T (3 times, 10 min), and incubated with corresponding IRD Fluor 780-labeled IgG secondary antibody (in the dark, 1 h, room temperature). Membranes were then washed with TBS-T (3 times, 10 min) and IR-fluorophores on the membrane were excited at 780 nm and emission (at 820 nm) was quantified using channel 800 of the LI-COR Infrared Imaging System (Odyssey) and analyzed with Odyssey software.
In Vitro Kinase Assay
The kinase assays were performed according to the protocol of the HTScan Mst4 kinase assay kit (Cell Signalling, Danvers, MA). The brief operations were described as follows. Expression vectors and siRNAs of PDCD10 were transfected into HeLa cells. After 48 h, cells were lysed and precleared with protein G beads for 1 h and then incubated with anti-PDCD10 mAb for 2 h at 4°C. To perform the kinase reaction, the immunoprecipitates were incubated with 10 Units Mst4 kinase and 200 μM cold ATP with substrate, Ezrin (Thr567)/Radixin (Thr564)/Moesin (Thr558) Biotinylated Peptide for 30 min at 25°C, and stopped by the equal volume 50 mM EDTA. Then the reaction products were 1:4 diluted in coating buffer (0.05 M NaHCO3, pH 8.6) to coat a pretreated ELISA plate (Costar, Cambridge, MA), incubating at 37 C for 1 h. Afterward the ELISA plate was shaken with coating solution, washed twice with PBST (PBS/0.05% Tween 20), and added primary Ezrin (Thr567)/Radixin (Thr564)/Moesin (Thr558) Biotinylated Peptide antibody preparation diluted 1:1000 in 1% BSA/PBST, 100 μl per well, incubating at 37 C for 2 h. After washing five times, the ELISA plate was added to HRP conjugated anti-rabbit IgG antibody (at 1:10000 in 1% BSA/PBST) 100 μl per well, incubating at 37 C for 1 h, and then washed five times, and 50 μl TMB substrate solution (TMB Substrate Kit, Pierce) per well was added. After developing at room temperature, the absorbance was measured at 450 nm at 10 min.
RESULTS
PDCD10 Interacted with MST4 in Yeast Cells
PDCD10 was used as bait for Y2H analysis, given that it was demonstrated not to have autonomous transactivation and promoter binding activities. PDCD10 transforming efficiency in Y2H screening reached to 4 × 10³ colonies/μg library plasmids, meeting the requirement for library screening. Plasmids of positive yeast colonies were extracted and transformed into E. coli. Preys fished by PDCD10 contained library plasmids MST4. To exclude false-positive results, we retested the interaction by simultaneously transforming Y190 with the bait plasmid (PDCD10) and the prey plasmid (MST4) with pGBT9 vector+MST4 and pGBT7-Lam+MST4 used as negative controls. Data from colony lift filter assays confirmed that PDCD10 was able to bind to MST4 in yeast cells (data not shown). Further research, however, is needed determine whether PDCD10 binds to other members of the Ste20-related kinase family.
PDCD10 Interacts with MST4 in 293T Cells by Coimmunoprecipitation Analysis
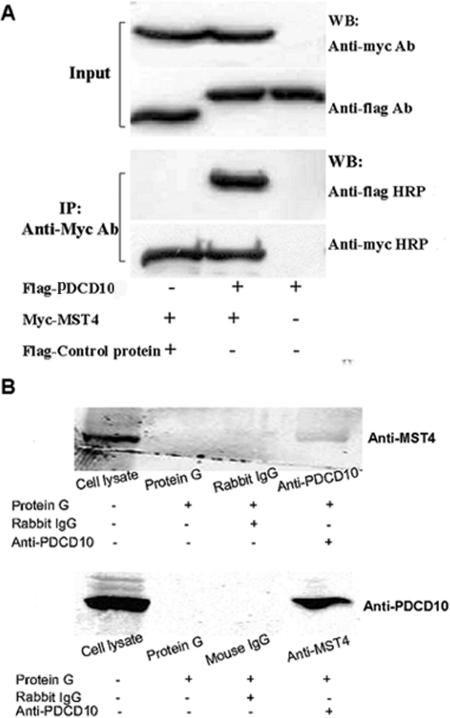
Traditional Y2H analysis is generally performed with cDNA library tissue, resulting in a high rate of false-positive results. For example, the ORF fused to the GAL4 AD domain often conflicts with the bona fide ORF. Consequently, in our study, we used the full-length cDNA library, greatly decreasing false-positive results. However, protein interactions between yeast cells and mammalian cells, belonging to various hereditary lineages, were still investigated to further exclude any false-positive results. As shown in Figure 1A, all Flag-tagged PDCD10 and myc-tagged MST4 were expressed in 293T cells. Additionally, immunoprecipitation results demonstrated that myc-tagged MST4 pulled down Flag-tagged PDCD10, whereas the empty Flag control plasmid did not, suggesting PDCD10 was able to bind to MST4 in mammalian cells, and the endogenous coimmunoprecipitation analysis further validated that PDCD10 could bind to MST4 in physiological status, as shown in Figure 1B.
Figure 1.
PDCD10 interacted with MST4 in situ both overexpression and the endogenous proteins. (A) Cell lysates transfected with the indicated constructs were immunoprecipitated with the FLAG antibody to precipitate FLAG-PDCD10 and FLAG control protein. An MYC antibody was used to detect MST4 proteins in the immunoprecipitate. PDCD10 coimmunoprecipitated with MST4 proteins in 293T cells, whereas the control pCDEF-flag vector did not. (B) HeLa cell lysates in normal culture were immunoprecipitated with the rabbit-derived anti-MST4 antibody and the mouse-derived anti-PDCD10 antibody to precipitate corresponding proteins, respectively. Then the other antibodies were used to detect corresponding proteins in the immunoprecipitates. PDCD10 coimmunoprecipitated with MST4 proteins in HeLa cells, whereas the control mouse-derived IgG did not; on the other hand, MST4 coimmunoprecipitated with PDCD10 proteins in HeLa cells, whereas the control rabbit-derived IgG did not.
Colocalization of PDCD10 and MST4 in HeLa Cells
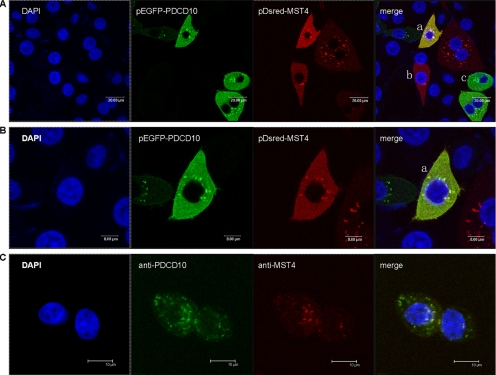
To confirm the intracellular interaction between PDCD10 and MST4, we constructed fluorescent plasmids pEGFP-C3-PDCD10 (green) and pDsred-N1-MST4 (red) and cotransfected them into HeLa cells. Cell nucleus morphology was observed by DAPI staining. As shown in Figure 2, A (low magnification) and B (high magnification), either pEGFP-C3-PDCD10 or pDsred-N1-MST4 localized to the cytoplasm with some highly concentrated spots around the nucleus, and the distribution of MST4 entirely overlapped with PDCD10. Figure 2A also shows cells expressing the single plasmid, which suggested that the binding of PDCD10 to MST4 did not result in changes in their cytoplasmic distribution each other. Figure 2C shows that the endogenous subcellular location of PDCD10 and MST4, which exhibited that either PDCD10 or MST4 localized around the nucleus as highly concentrated spots, and the distribution of MST4 entirely overlapped with PDCD10. These data confirmed the interaction between PDCD10 and MST4 and suggested they may form a complex and function in cytoplasm.
Figure 2.
Colocalization of PDCD10 and MST4 in HeLa cells. (A) Confocal microscopy images of cells cotransfected with pEGFP-C3-PDCD10 (green) and pDsred-N1-MST4 (red) plasmids, with coexpression in yellow. Cell nucleus morphology was observed by DAPI staining (blue). a, b, and c represented three different cells. Cell b was transfected with pDsred-N1-MST4 plasmid and cell c with pEGFP-C3-PDCD10; however, cell a was cotransfected with both plasmids. It showed that either pEGFP-C3-PDCD10 or pDsred-N1-MST4 localized to the cytoplasm with some concentrated spots around the nucleus, and the distribution did not changed when cotransfected PDCD10 and MST4. (B) The same layer with 2× magnification of A, which showed that the distribution of MST4 entirely overlapped with PDCD10. (C) The HeLa cells costained by anti-PDCD10 antibody and FITC-conjugated goat anti-mouse IgG, anti-MST4 antibody, and TRITC-conjugated bovine anti-rabbit IgG in turn, for the endogenous immunofluorescence microscopy of PDCD10 and MST4. It exhibited that either PDCD10 or MST4 localized around the nucleus as highly concentrated spots, and the distribution of MST4 overlapped with PDCD10. Experiments were performed in triplicate, with similar results.
Expression Pattern of PDCD10 in Cell Lines
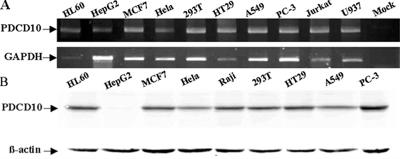
RT-PCR and Western blot were used to examine the expression pattern of the PDCD10 transcript in human multicell lines. Although PDCD10 was ubiquitously expressed (Figure 3, A and B), with higher levels detected in PC-3 (prostate cancer cell line), lower expression levels were noted in some cell lines such as HeLa (cervical cancer cell line). PDCD10 protein was nearly undetectable in HepG2 (hepatocellular carcinoma cell line) line (Figure 3B). Consequently, HeLa cells and PC-3 cells were selected for further studies.
Figure 3.
Expression levels of endogenous PDCD10 in human multicell lines by RT-PCR and immunoblotting.
Transfection of siPDCD10-1 or siPDCD10-2 Inhibited PDCD10 Expression at Both the mRNA and Protein Level
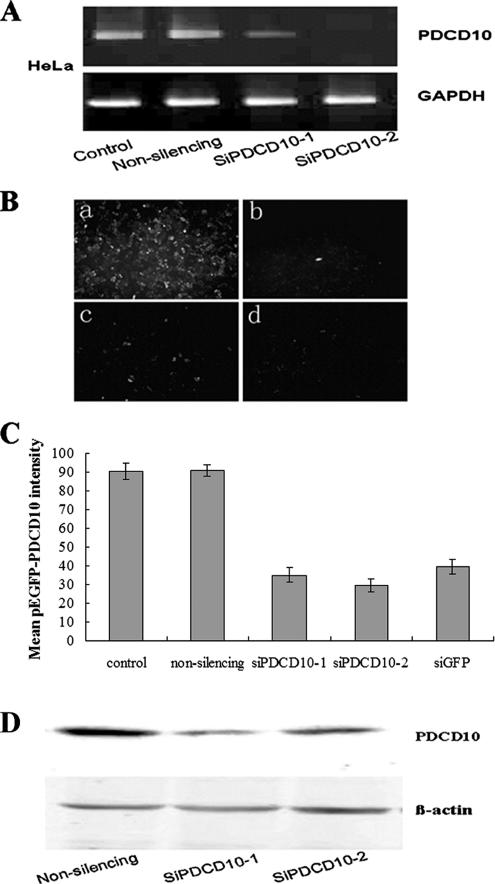
Nonsilencing siRNA or the two siRNAs against PDCD10 (siPDCD10-1 and siPDCD10-2) were transfected into HeLa and PC-3 cell lines either alone or combined with a plasmid encoding for pEGFP-PDCD10. Our RT-PCR data suggested that 24 h after transfection, PDCD10 mRNA levels were significantly decreased in cells transfected with both siPDCD10-1 and siPDCD10-2 (Figure 4A). Images of fluorescence microscopy (Figure 4B) and analysis of FACS Calibur (Figure 4C) showed that GFP-PDCD10 protein levels were knocked down by siRNA. In contrast, no effects were noted with nonsilencing siRNA. The immunoblotting results showed that endogenous PDCD10 protein expressions could be down-regulated by siPDCD10-1 or siPDCD10-2, respectively (Figure 4D). Consequently, siPDCD10-1 was inserted into pGCsi-U6 vectors and named as pGC-PDCD10 for subsequent experiments of colony formation and anoikis assay.
Figure 4.
Transfection of siPDCD10-1 or siPDCD10-2 inhibited PDCD10 expression at both mRNA and protein levels. (A) RT-PCR PDCD10 mRNA expression data. PC-3 cells, which express high levels of PDCD10, were transfected with nonsilencing siRNA or the indicated siRNAs against PDCD10. At 24 h after transfection, total RNAs were extracted and RT-PCR experiments were performed as described (see Materials and Methods). Both siPDCD10-1 and siPDCD10-2 showed much stronger inhibitory effects for PDCD10 mRNA expression than nonsilencing siRNA. (B) Effects of siRNAs against PDCD10 on the expression of GFP PDCD10 fusion protein. PC-3 and HeLa cells were cotransfected with pEGFP-PDCD10 plasmid and siPDCD10-1 (c) and siPDCD10-2 (d), respectively. Plasmids encoding pEGFP-PDCD10 were also transfected into PC-3 and HeLa cells cotransfected with nonsilencing siRNA (a) as negative control, as well as siRNA against pEGFP (b) as positive control. At 24 h after transfection, cells were observed by fluorescence microscopy. siPDCD10-1 and -2–transfected cells show far fainter fluorescence than cells transfected with nonsilencing siRNA. Then cells were harvested and immediately analyzed by FACS Calibur (1 × 10⁴ cells) and CELLQuest software (BD Bioscience). Mean GFP-PDCD10 fluorescence intensity was quantificationally shown in C. (D) Immunoblot assessment on the effects of siPDCD10 on endogenous PDCD10 protein expression. HeLa cells were transfected with nonsilencing siRNA or siPDCD10. At 24 h after transfection, a significant decrease in the expression of endogenous PDCD10 was observed in siPDCD10–transfected cells, whereas no decrease was noted in nonsilencing siRNA transfected cells. β-actin was used as the internal control.
Coexpression of PDCD10 and MST4 Protein Promoted Cell Proliferation
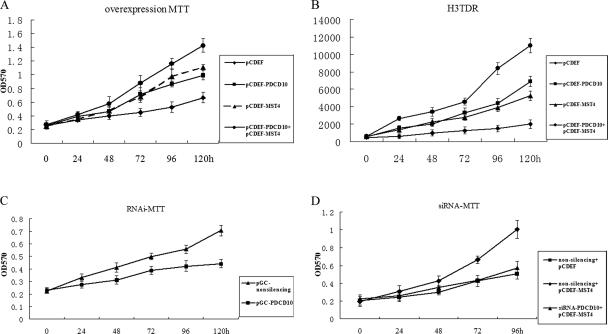
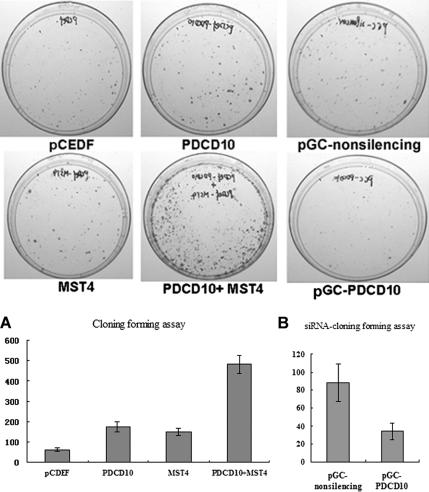
PC-3 cells were transiently transfected with expression vectors PDCD10 and MST4 (see Materials and Methods) followed by MTT, 3H-TdR and colony-forming assays measuring cell proliferation. As shown in Figure 5, A and B, an increase in cell proliferation was noted, during a 5-d period, in cells transfected with either PDCD10 or MST4, compared with mock-transfected cells. Coexpression of PDCD10 and MST4 resulted in even greater cell proliferation, suggesting that an interaction between PDCD10 and MST4 might accelerate cell growth. Similar results were also obtained in HeLa cells (data not shown), indicating that the biological effect of MST4 was not cell-specific. Coexpression of PDCD10 and MST4 in PC-3 cells also resulted in a remarkable increase in the number and size of colonies in the colony-forming assay (Figure 6A).
Figure 5.
PDCD10 modified normal and MST4-induced cellular growth. PC-3 and HeLa cells were transiently transfected with expression vectors PDCD10 and MST4. Cells proliferation was measured by MTT and 3H-TdR assays at indicated time points. (A) MTT assay for overexpression of PDCD10, MST4, and PDCD10 with cotransfected MST4 (B) 3H-TdR assay for overexpression of PDCD10, MST4, and PDCD10 with cotransfected MST4. (C) MTT assay for PDCD10 knockdown by double-stranded siRNAs. (D) MTT assay for PDCD10 knockdown by double-stranded siRNAs with overexpression of MST4. Error bars, SEM. Data are one representation of three separate experiments.
Figure 6.
PDCD10 modified normal and MST4-induced cellular growth in colony forming assays. (A) Left two panels, PC-3 cells transfected with pCDEF-PDCD10, pCDEF-MST4, pCDEF-PDCD10, and pCDEF-MST4 or vector control in monolayer culture and selected with G418. Quantitative analyses of colony numbers are shown in the right panel (n = 3). (B) Representative sample of inhibition of colony formation in monolayer culture by siPDCD10. Right panel, PC-3 cells transfected with pGC-PDCD10, or nonsilencing control in monolayer culture. Quantitative analyses of colony numbers are shown in the right panel.
Transfection of siPDCD10 Inhibited Normal and MST4-induced Cell Growth
To further elucidate the effects in cell proliferation resulting from the interaction between PDCD10 and MST4, double-stranded siRNAs were designed to knock down endogenous expression of PDCD10, and cell proliferation was subsequently assayed by MTT. As shown in Figures 5 and 6, pGC-PDCD10 resulted in a decrease in PC-3 cell proliferation compared with control (Figure 5C), and cotransfection siPDCD10-1 reversed the effect of MST4-promoted cell growth (Figure 5D). Growth curves obtained from normal cultured cells were similar to nonsilencing siRNA transfected cells, suggesting that nonsilencing siRNA transfection did not significantly affect cell proliferation. These data were confirmed by colony-forming assays (Figure 6B). Our data demonstrated that transient knocking-down of PDCD10 protein expression inhibited natural and MST4-induced cell proliferation, suggesting that PDCD10 protein might play an important role in MST4-mediated cell growth.
Overexpression or Knockdown of PDCD10 Influenced Cellular Transformation
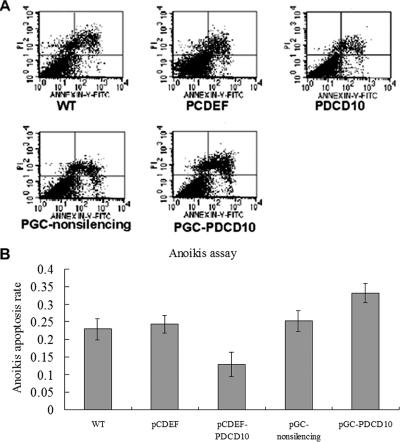
An important hallmark of cellular transformation is anchorage-independent growth. Normal cells are often polarized and viability requires a solid substratum on which to survive and proliferate. Coating of tissue culture plates with Poly-HEME prevents cell attachment, and results in apoptosis, known as “anoikis” (Gottardi et al., 2001). MST4 conferred cellular transformation in soft agar colony-forming assays. To test whether PDCD10 contributed to cell growth, regardless of cell attachment status, we utilized prostate cancer cells to measure the rate of anoikis in transfected cells overexpressing or knockdown of PDCD10. As illustrated in Figure 7A, overexpression of PDCD10 inhibited anoikis compared with the empty vectors (11.9, 24.8%, respectively). In contrast, an increase of apoptosis was observed after treatment with a PDCD10 siRNA compared with nonsilencing siRNA (34.3, 25.6%, respectively, Figure 7B). These studies strongly suggested that PDCD10 conferred cellular transformation.
Figure 7.
PDCD10-induced protection from anoikis. Cells transfected with pCDEF-PDCD10, pGC-PDCD10, with pCDEF vector plasmid (10 μg), and nonsilencing siRNA as mock were resuspended in RPMI 1640 and plated on the Poly-HEME plates. At 24 h after transfection, cells were harvested and stained with annexin V and propidium iodide (PI), and analyzed by FACS (n = 3). Apoptotic cells are expressed as a percentage of total cells. (A) Overexpression of PDCD10 inhibited anoikis compared with empty vectors (11.9, 24.8%, respectively). (B) An increase in apoptosis was observed after treatment with PDCD10 siRNA compared with nonsilencing (34.3, 25.6%, respectively).
Transfection of siMST4-1 or siMST4-2 Inhibited MST4 Expression at Both the mRNA and Protein Level
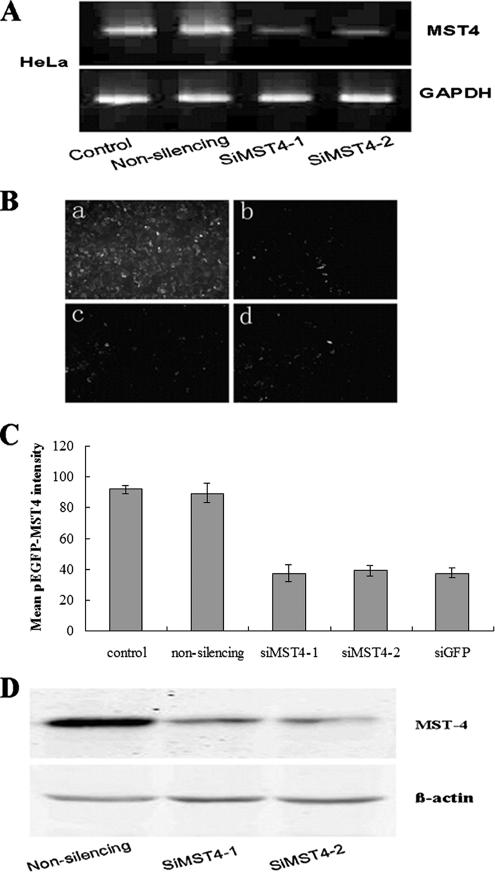
Nonsilencing siRNA or the two siRNAs against MST4 (siMST4-1 and siMST4-2) were transfected into HeLa and PC-3 cell lines either alone or combined with pEGFP-MST4. Our RT-PCR data showed that MST4 mRNA levels were significantly decreased in cells transfected with siMST4-1 or siMST4-2 after 24-h transfection (Figure 8A). Images of fluorescence microscopy (Figure 8B) and analysis of FACS Calibur (Figure 8C) showed that GFP-MST4 protein levels were knocked down by siRNA. In contrast, no effects were noted with nonsilencing siRNA. The immunoblotting results showed that endogenous MST4 protein expressions could be down-regulated by siMST4-1 or siMST4-2 (Figure 8D). Consequently, siMST4-1 was selected for anoikis analysis.
Figure 8.
Transfection of siMST4-1 or siMST4-2 inhibited MST4 expression at both mRNA and protein levels. (A) RT-PCR MST4 mRNA expression data. HeLa cells, which express MST4, were transfected with nonsilencing siRNA or the indicated siRNAs against MST4. At 24 h after transfection, total RNAs were extracted, and RT-PCR experiments were performed as described (see Materials and Methods). Both siMST4-1 and siMST4-2 showed strong inhibitory effects for MST4 mRNA expression, whereas MST4 mRNA expression was not inhibited by nonsilencing siRNA. (B) Effects of siRNAs against MST4 on the expression of GFP-MST4 fusion protein. HeLa cells were cotransfected with pEGFP-MST4 plasmid and siMST4-1 (c), siMST4-2 (d), respectively. Plasmids encoding pEGFP-MST4 were also transfected into HeLa cells cotransfected with nonsilencing siRNA (a) as negative control, as well as siRNA against pEGFP (b) as positive control. At 24 h after transfection, cells were observed by fluorescence microscopy. Both siMST4-1 and siMST4-2 transfected cells show far fainter fluorescence than cells transfected with nonsilencing siRNA. Then cells were harvested and immediately analyzed by FACS Calibur (1 × 10⁴ cells) and CELLQuest software (BD Bioscience). Mean GFP-MST4 fluorescence intensity was quantificationally shown in C. (D) Immunoblot assessment on the effects of siMST4 on endogenous MST4 protein expression. HeLa cells were transfected with nonsilencing siRNA or siMST4. At 24 h after transfection, a significant decrease in the expression of endogenous MST4 was observed in both siMST4-1 or siMST4-2–transfected cells, whereas no decrease was noted in nonsilencing siRNA transfected cells. β-actin was used as the internal control.
Transfection of siMST4-1 or siMST4-2 Inhibited Normal and PDCD10-induced Cell Growth
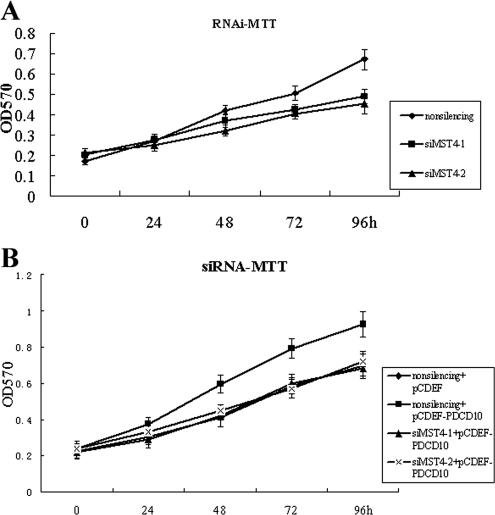
To further verify the interaction between PDCD10 and MST4, as well as the effects in cell proliferation, double-stranded siRNAs were designed to knock down endogenous expression of MST4, and the cell proliferation was subsequently assayed by MTT. As shown in Figure 9A, knockdown of MST4 resulted in a decrease in HeLa cell proliferation compared with control, and cotransfection either siMST4-1 or siMST4-2 also reversed the effect of PDCD10-promoted cell growth (Figure 9B). Our data demonstrated that transient knocking-down of MST4 protein expression inhibited natural and PDCD10-induced cell proliferation, demonstrating that there is a functional interaction between MST4 and PDCD10.
Figure 9.
RNAi of MST4 modified normal and PDCD10-induced cellular growth. HeLa cells were transiently transfected with expression vectors PDCD10 and MST4 siRNA. Cells proliferation was measured by MTT assays at indicated time points. (A) MTT assay for MST4 knockdown by double-stranded siRNAs in normal culture cells. (B) MTT assay for MST4 knockdown by double-stranded siRNAs with overexpression of PDCD10. Error bars, SEM. Data are one representation of three separate experiments.
Transfection of siMST4-1 Inhibited PDCD10-induced Cellular Transformation
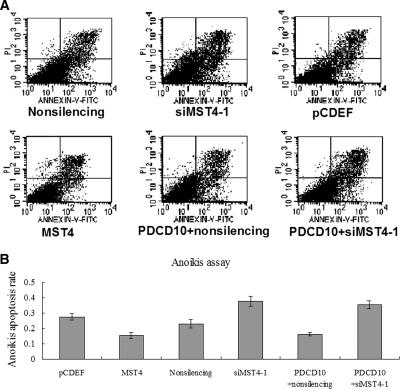
MST4 conferred cellular transformation in soft agar colony-forming assays (Sung et al., 2003). To test the effects of MST4 on PDCD10-induced cellular transformation, we utilized HeLa cells to measure the rate of anoikis in cells transfected siMST4-1 with overexpressing PDCD10. As illustrated in Figure 10A, an increase of apoptosis was observed after treatment with siMST4-1 compared with nonsilencing siRNA (37.6%, 24.7%, respectively), as well as overexpression of MST4 inhibited anoikis compared with the empty vectors (16.8%, 27.5%, respectively). However, after cotransfection of siMST4-1 and pCDEF-PDCD10, an increase of apoptosis was also observed compared with cotransfection of nonsilencing and pCDEF-PDCD10 (36%, 15.2%, respectively, Figure 10B). These studies strongly suggested that siMST4-1 inhibited PDCD10-induced cellular transformation.
Figure 10.
The effect of MST4 RNAi on the protection from anoikis induced by PDCD10. Cells transfected with overexpression vectors of PDCD10 and siRNA against MST4, with pCDEF vector plasmid (10 μg) and nonsilencing siRNA as mock were resuspended and plated on the Poly-HEME plates. (A) At 24 h after transfection, cells were harvested and stained with annexin V and PI, and analyzed by FACS (n = 3). (B) Apoptotic cells are expressed as a percentage of total cells. An increase of apoptosis was observed after treatment with siMST4-1 compared with nonsilencing siRNA (37.6%, 24.7%, respectively), as well as overexpression of MST4 inhibited anoikis compared with the empty vectors (16.8%, 25.5%, respectively). After cotransfection of siMST4-1 and pCDEF-PDCD10, an increase of apoptosis was also observed compared with cotransfection of nonsilencing and pCDEF-PDCD10 (36%, 15.2%, respectively).
Interaction between PDCD10 and MST4 Modulated ERK Kinases Activity
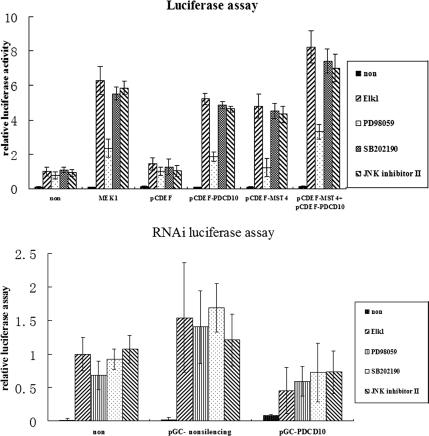
An ERK-dependent Elk1 activation reporter gene assay was used to investigate ERK kinase activity. Expression vectors and a reporter gene, driven by an Elk1-dependent promoter, were transiently transfected into PC-3 cell lines, with the thymidine kinase promoter-Renilla luciferase reporter plasmid (pRL-TK) used as an internal control. Consistent with the above-mentioned results, overexpression of either PDCD10 or MST4 conferred a five- to sixfold activation of the reporter gene, and co-overexpression conferred a more than eightfold activation (Figure 11A), after adjustment for Renilla luciferase activity. The activation was abolished by PD98059, an inhibitor of MEK1, but not by SB202190, a p38 inhibitor, or JNK-inhibitor II, a JNK inhibitor. In contrast, PDCD10 RNAi resulted in an inhibition of Elk1-dependent luciferase activity compared with nonsilencing vectors (Figure 11B). These findings suggested that PDCD10, in conjunction with MST4, mediated cell growth and transformation by modulation of the ERK pathway.
Figure 11.
A reporter gene assay of ERK dependent Elk1 activation was used to investigate the role of PDCD10 and MST4 in the ERK MAPK cascade by dual-luciferase reporter assays. Expression vectors and a reporter gene driven by Elk1-dependent promoter were transiently transfected into PC-3 cell lines, with the thymidine kinase promoter-Renilla luciferase reporter plasmid (pRL-TK) used as an internal control. Cells were lysed and the relative luciferase activity was measured (firefly luciferase for reporter and renilla luciferase activity for normalization of transfection efficiency). Reporter assays were performed after treatment with ERK specific inhibitor PD98059 (5 mM), p38 MAPK inhibitor SB20219 (10 mM), or JNK MAPK inhibitor JNK inhibitor II (0.1 μM), respectively. ELK1 represents the Gal4-ELK1 fusion expression vector. (A) The overexpression of PDCD10 and MST4 conferred a higher activation of the reporter gene. (B) Knockdown of PDCD10 showed inhibition of Elk1-dependent luciferase activity compared with nonsilencing vectors. Error bars, SEM; n = 3 per experiment.
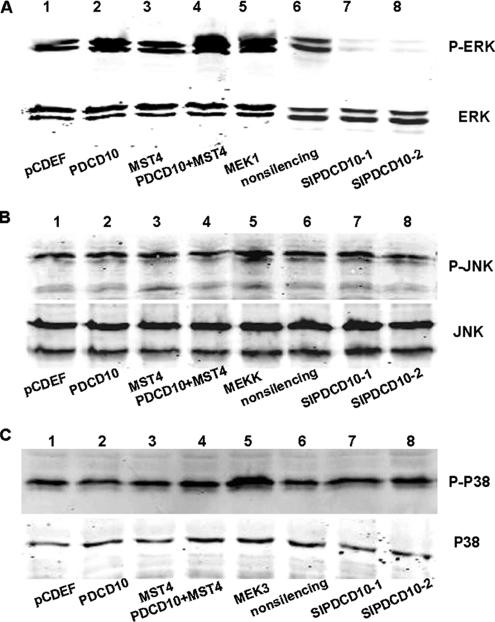
To further confirm these results, Western blot analysis was used to test the effect of overexpression and knockdown of PDCD10 by RNAi on the activation of ERK pathways. As shown in Figure 12A, overexpressed PDCD10 increased ERK activity at levels similar to those conferred by the constitutively active form of MST4, in agreement with dual-luciferase assay results. Co-overexpressed PDCD10 also accelerated MST4-induced ERK activation. In contrast, knockdown of PDCD10 significantly decreased ERK activity, compared with the nonsilencing control. Phosph-ERK of normal cultured cells was similar to that of nonsilencing siRNA transfected cells, indicating that nonsilencing siRNA transfection did not significantly affect the ERK pathway. Similar findings obtained in HeLa (Figure 12A) and PC-3 (data not shown) cells suggested that the biological effects of PDCD10 were not cell-type specific. Moreover, Figure 12, B and C, shows that either overexpressed PDCD10 (co-overexpressed with MST4 or single transfected) or siPDCD10 did not influence activities of JNK and P38, which confirmed that both PDCD10 and MST4 specifically modulated ERK kinases activity, but not JNK or p38 MAPK.
Figure 12.
Interaction between PDCD10 and MST4 modulated ERK activity, but not JNK and P38 as measured by Western blot. HeLa cells were transfected with expression vectors, with pCDEF and nonsilencing siRNA as blank controls. Cell lysates were separated by SDS-PAGE and immunoblotted with anti-ERK, anti-JNK and anti-P38, as well as anti-phospho-ERKs, anti-phospho-JNK and anti-phospho-P38 rabbit polyclonal antibodies, respectively. And the positive control were MEK1 for ERK-MAPK, MEKK for JNK-MAPK, and MEK3 for P38-MAPK. (A) showed that overexpressed PDCD10 or MST4 increased ERK activity at similar levels. Co-overexpressed PDCD10 accelerated MST4-induced ERK activation significantly. In contrast, knockdown of PDCD10 significantly decreased ERK activity. (B and C) Either overexpressed PDCD10 or siPDCD10 did not influence JNK and P38 activity, as well as MST4.
Transfection of siMST4-1 or siMST4-2 Inhibited PDCD10-induced ERK Kinases Activity
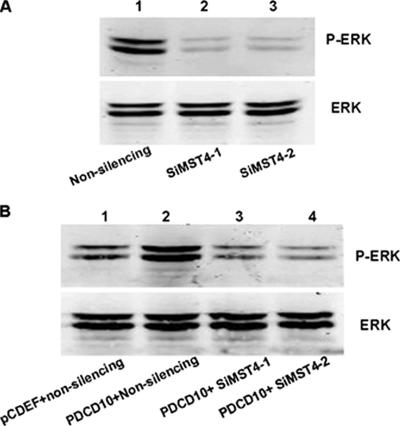
To further reveal whether RNAi of MST4 could inhibit PDCD10-induced ERK kinases activity, Western blot analysis was used. As shown in Figure 13A, siMST4-1 or siMST4-2 significantly decreased ERK activity, compared with the nonsilencing siRNA. Furthermore, Figure 13B shows that overexpressed PDCD10 increased ERK activity; however, knockdown of MST4 strongly attenuated PDCD10-induced ERK activation compared with the control.
Figure 13.
RNAi of MST4 inhibited normal and PDCD10-induced ERK kinases activity. HeLa cells were transfected with RNAi of MST4, with nonsilencing as blank controls. Cell lysates were separated by SDS-PAGE and immunoblotted with anti-ERK and anti-phospho-ERK rabbit polyclonal antibodies, respectively. (A) Knockdown of MST4 significantly decreased ERK activity. (B) Overexpressed PDCD10 increased ERK activity, which was attenuated by effective siMST4, with nonsilencing as noneffective control.
Overexpressing and Down-Regulating PDCD10 Affected MST4 Kinase Activity In Vitro
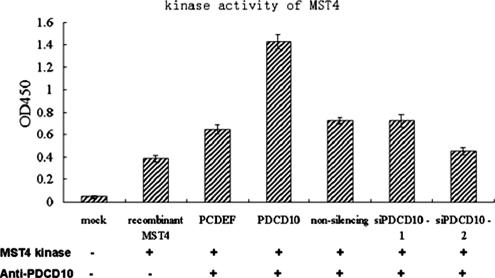
We then sought to determine whether PDCD10 could affect MST4 intrinsic kinase activity. Cell lysates either overexpressing or down-regulating PDCD10 was immunoprecipitated from HeLa cells with PDCD10 antibody and subjected to an in vitro MST4 kinase assay using the Ezrin (Thr567)/Radixin (Thr564)/Moesin (Thr558) Biotinylated Peptides as substrates. The substrate could be phosphorylated by the recombinant MST4 kinase (provided in HTScan Mst4 kinase assay kit), but not by the kinase buffer or other associated kinase. As shown in Figure 14, the endogenous PDCD10 immunoprecipitated by antibody, were able to increase the MST4 kinase activity on the substrate, which suggested that PDCD10 may has effect on the MST4 kinase activity physiologically. Consistent with the results, when overexpressing PDCD10, the immunoprecipitates significantly increased the MST4 kinase activity by more than threefold. In contrast, when PDCD10 was down-regulated by siRNA, the kinase activity of MST4 was slightly decreased. All these confirmed that PDCD10 could play an important role in MST4 intrinsic kinase activity and suggested that PDCD10 could be a regulatory adaptor necessary for MST4 kinase function.
Figure 14.
The MST4 kinase activity assays in vitro. The kinase assays were performed according to the protocol of the HTScan Mst4 kinase assay kit. The reaction system included 10 Units recombinant Mst4 kinase and 200 μM cold ATP with substrate, Ezrin (Thr567)/Radixin (Thr564)/Moesin (Thr558) Biotinylated Peptide. The HeLa cells overexpressing and down-regulating PDCD10 were lysed and immunoprecipitated with anti-PDCD10 mAb and protein G beads. After incubating with the reaction system for 30 min at 25°C, the patterns were performed with directed ELISA and detected the absorbance at 450 nm.
DISCUSSION
This study is, to our knowledge, the first demonstration that PDCD10 interacted with MST4, a member of the Ste20 kinase family. The interaction was demonstrated by Y2H screening and confirmed by overexpression coimmunoprecipitation and colocalization assays. Furthermore, we validated that the interaction was endogenous, and both endogenous proteins located as the perinuclear highly concentrated speckles, as well as the distribution of MST4 entirely overlapped with PDCD10. All these suggested the interaction be physiological and important.
Our data also suggested that transfection of PDCD10 stimulated cell growth and mediated anchorage-independent transformation, and these effects were increased by cotransfection with MST4. On the other hand, knockdown of PDCD10 suppressed normal and MST4-induced cell growth. Similarly, induction of siRNA of MST4 decreased normal and PDCD10-induced cell growth and transformation. Similar findings were obtained in HeLa and PC-3 cells, regardless of endogenous PDCD10 expression levels, suggesting that the biological effects of PDCD10 were not cell-type specific. In a word, our results strongly demonstrated that PDCD10 was an important positive regulator of MST4. Because the off-target effects of RNAi experiments were reported by some researchers (Saxena et al., 2003; Jackson et al., 2003; Scacheri et al., 2004), we could not absolutely exclude the possibility of these effects in our study. Although we have optimized our designs of siRNA, more efficient evaluation methods need to be developed in the future.
Our data also suggested that MST4 specifically activated the ERK pathway, but not the JNK and p38 MAPK pathways, consistent with previous reports (Lin et al., 2001). Dual-luciferase reporter assay data indicated that PDCD10 activated Elk1 and that this effect was blocked by PD98059, but not by SB202190 or JNK-inhibitor II. Western blot data showed that co-overexpressed PDCD10 and MST4 resulted in the highest intensity of activated ERK bands, whereas the weakest phosphorylated bands were seen after knockdown of PDCD10 by siPDCD10; moreover, knockdown of MST4 by siMST4 could obviously decrease the phosphorylated ERK level caused by overexpression of PDCD10. And more importantly, we confirmed that either overexpressing or endogenous PDCD10 can increase the MST4 kinase activity. These findings suggested that PDCD10 exerted its effect through interaction with MST4, via modulation of the ERK pathway, by increasing the activated form of ERK. The ERK MAPK pathway has been implicated as one of the most important regulators of cell proliferation, and several key growth factors and proto-oncogenes transduce signals promote growth and differentiation through this cascade. There is growing evidence suggesting that activation of the ERK MAPK pathway is also involved in the pathogenesis, progression, and oncogenic behavior of human cancers. MST4 was suggested to have a potential role in prostate cancer progression (Sung et al., 2003), and previous research has demonstrated that PDCD10 protein was associated with cell apoptosis and tumor processes (Wang et al., 1999; Chen et al., 2001; Jiang et al., 2001; Hu et al., 2003; Huerta et al., 2003; Aguirre et al., 2004). In present study, overexpression of either PDCD10 or MST4 contributed to prostate cancer cell growth, regardless of attachment status, suggesting that PC-3 cells acquired enhanced ability of anchorage-independent growth. Moreover, interaction between PDCD10- and MST4-activated ERK kinases promoted cell growth, suggesting a role in prostate cancer progression.
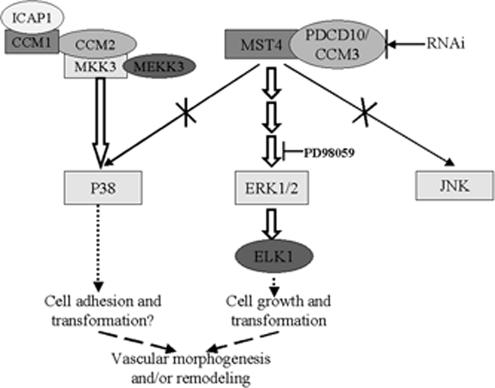
PDCD10 has been identified as the third CCM related gene (CCM3; Bergametti et al., 2005; Guclu et al., 2005). PDCD10 is a functionally important gene, although mutations in PDCD10 are uncommon in CCM (Verlaan et al., 2005), and low frequency of PDCD10 mutations were identified in a panel of CCM3 probands (Liquori et al., 2006). CCMs are hamartomatous vascular malformations characterized by abnormally enlarged capillary cavities without intervening brain parenchyma. The most common symptoms are seizures and neurological deficits that result from focal hemorrhages (OMIM 116860). Both CCM1 (KRIT1) and CCM2 (MGC4607) are in a complex that likely involves both the p38 MAPK and integrin signaling pathways (Zawistowski et al., 2005). It remains to be determined whether CCM3/PDCD10 will be a member of the CCM1/2 protein complex as it has been defined thus far. It is well established that p38 signaling plays an important role during angiogenesis and CCM2 acts as a scaffold for Rac/MEKK3/MKK3 in the p38 MAPK module (Uhlik et al., 2003). In another study, targeted disruption of the p38α (MAPK14) gene was lethal to mice embryos due to placental defects, specifically the lack of vascularization and increased apoptosis, as well as abnormal angiogenesis in the embryo (Mudgett et al., 2000). Furthermore, embryos null for MEKK3 died from impaired blood vessel development (Yang et al., 2000). Reduced p38 activation in response to cellular stress in cells deficient for CCM2 might influence downstream p38-specific transcriptional activation, which is critical for the organization of new vessels and for maintenance of the existing vessel architecture, and may ultimately contribute to the formation of the closely packed, malformed vessels of the cavernous malformation. Similarly, recent research suggested that knockdown of the nematode PDCD10 ortholog, 2K896, was lethal to 40% of the embryos and resulted in a dumpy phenotype in postembryonic viable embryos (Kamath et al., 2003). Our studies confirmed that interaction between PDCD10 and MST4 regulated ERK, but not the P38 and JNK MAPK cascade, and the ERK activation by PDCD10 depended on MST4, and PDCD10 can increase the MST4 kinase activity. Further research, however, is needed to determine whether PDCD10 plays a role during angiogenesis and vascular morphogenesis through the interaction with MST4. We speculate that PDCD10 interacted with MST4 and increase the MST4 kinase activity, then activating the ERK MAPK cascade, as shown in Figure 15, although more research is needed to fully elucidate the process.
Figure 15.
PDCD10/MST4 signaling pathway and CCM protein function. The CCM1/2 complex may modulate integrin-mediated cell adhesion via association with ICAP1 in the cytoplasm, as well as organize a p38 MAPK signaling complex (Zawistowski et al., 2005). However, it has been reported that MST4 activated MEK-1/ERK via a Ras/Raf independent pathway (Lin et al., 2001). These data, and ours, confirmed that PDCD10 (CCM3) interacted with MST4 and modulated the ERK MAPK cascade, but not P38 and JNK, resulting in growth induction and cellular transformation.
In addition to the MAPK signaling pathway, integrin signaling may participate in CCM pathogenesis. Previous research has suggested that CCM1 and CCM2 played a role in CCM pathogenesis via a CCM1/ICAP1 interaction (Zawistowski et al.,2005). Results of our laboratory and others (Lin et al., 2001; Sung et al., 2003), demonstrated that MST4 and PDCD10 promoted anchorage-independent cell growth (AIG), and knockdown either MST4 or PDCD10 obviously restrained AIG; what's more, knockdown of MST4 can almost block AIG caused by overexpression of PDCD10. AIG is an important hallmark of cellular transformation, mediated by cell adhesion–integrin signaling pathways. Further study is also needed to elucidate the relationship between integrin signaling pathways related to PDCD10 and the pathogenesis of CCM.
In summary, our study confirmed that either overexpressing or endogenous PDCD10, a protein antiapoptosis and associated with CCM pathogenesis, interacted with the Ste20-related kinase MST4. The interaction is physiological, and PDCD10 can increase the MST4 kinase activity. This interaction promoted cell growth and transformation via modulation of the ERK pathway, which was inhibited by RNAi of PDCD10 or MST4. These data suggested that PDCD10 functioned as a positive regulator of MST4, establishing a link between CCM pathogenesis and the ERK-MAPK cascade, as well as the integrin signaling pathway and also suggested a role for PDCD/MST4 in CCMs pathogenesis, tumor angiogenesis, and progression.
ACKNOWLEDGMENTS
We thank Dr. Yanan Liu, Lina Chen, and Ting Zhang of Peking University Center for Human Disease Genomics for their excellent technical assistance. This work was supported by grants from the National Natural Science Foundation of China (30300308) and the National High Technology Research and Development Program of China (2002BA711A01).
Footnotes
This article was published online ahead of print in MBC in Press (http://www.molbiolcell.org/cgi/doi/10.1091/mbc.E06-07-0608) on March 14, 2007.
REFERENCES
- Aguirre A. J. High-resolution characterization of the pancreatic adenocarcinoma genome. Proc. Natl. Acad. Sci. USA. 2004;101:9067–9072. doi: 10.1073/pnas.0402932101. [DOI] [PMC free article] [PubMed] [Google Scholar]
- Bergametti F. Mutations within the Programmed Cell Death 10 gene cause cerebral cavernous malformations. Am. J. Hum. Genet. 2005;76:42–51. doi: 10.1086/426952. [DOI] [PMC free article] [PubMed] [Google Scholar]
- Chen C. A., Okayama H. Calcium phosphate-mediated gene transfer: a highly efficient transfection system for stably transforming cells with plasmid DNA. BioTechniques. 1988;6:632–638. [PubMed] [Google Scholar]
- Chen J. X., Fan J. P., Yin G. K., Sun A. H., Liao J. C., Tan G. R., Huan G. Y., Li Y., Xie Y., Mao Y. M. Study of differentially expressed genes in laryngeal squamous cell carcinoma by cDNA microarray. Chin. Acad. J. Sec. Mil. Med. Univ. 2001;22:519–522. [Google Scholar]
- Dan I., Ong S. E., Watanabe N. M., Blagoev B., Nielsen M. M., Kajikawa E., Kristiansen T. Z., Mann M., Pandey A. Cloning of MASK, a novel member of the mammalian germinal center kinase III subfamily, with apoptosis-inducing properties. J. Biol. Chem. 2002;277:5929–5939. doi: 10.1074/jbc.M110882200. [DOI] [PubMed] [Google Scholar]
- Davis L. G., Kuehl W. M., Battey J. F. Basic Methods in Molecular Biology. Norwalk, CT: Appleton & Lange; 1994. [Google Scholar]
- Frisch S. M., Francis H. Disruption of epithelial cell-matrix interactions induces apoptosis. J. Cell Biol. 1994;124:619–626. doi: 10.1083/jcb.124.4.619. [DOI] [PMC free article] [PubMed] [Google Scholar]
- Gottardi C. J., Wong E., Gumbiner B. M. E-cadherin suppresses cellular transformation by inhibiting beta-catenin signaling in an adhesion-independent manner. J. Cell Biol. 2001;153:1049–1060. doi: 10.1083/jcb.153.5.1049. [DOI] [PMC free article] [PubMed] [Google Scholar]
- Guclu B., Ozturk A. K., Pricola K. L., Bilguvar K., Shin D., O'Roak B. J., Gunel M. Mutations in apoptosis-related gene, PDCD10, cause cerebral cavernous malformation. Neurosurgery. 2005;57:1008–1013. doi: 10.1227/01.neu.0000180811.56157.e1. [DOI] [PubMed] [Google Scholar]
- Hu H. P., Zhang J. P., Yin G. K., Xiao Z. Y., Wu H. M., Mao Y. M., Wu M. C. Gene microarrays in detecting molecular mechanisms of cantharidin-mediated cytotoxicity on human hepatic cancer cells. Chin. Acad. J. Sec. Mil. Med. Univ. 2003;24:645–649. [Google Scholar]
- Huerta S., Harris D. M., Jazirehi A., Bonavida B., Elashoff D., Livingston E. H., Heber D. Gene expression profile of metastatic colon cancer cells resistant to cisplatin-induced apoptosis. Int. J. Oncol. 2003;22:663–670. [PubMed] [Google Scholar]
- Ito T., Tashiro K., Muta S., Ozawa R., Chiba T., Nishizawa M., Yamamoto K., Kuhara S., Sakaki Y. Toward a protein-protein interaction map of the budding yeast: a comprehensive system to examine two-hybrid interactions in all possible combinations between the yeast proteins. Proc. Natl. Acad. Sci. USA. 2000;97:1143–1147. doi: 10.1073/pnas.97.3.1143. [DOI] [PMC free article] [PubMed] [Google Scholar]
- Jackson A. L., Bartz S. R., Schelter J., Kobayashi S. V., Burchard J., Mao M., Li B., Cavet G., Linsley P. S. Expression profiling reveals off-target gene regulation by RNAi. Nat. Biotechnol. 2003;21:635–637. doi: 10.1038/nbt831. [DOI] [PubMed] [Google Scholar]
- Jiang X. L., Yang J. S., Zhang T. F., Chen S. S. Study on the difference of genotype and gene expression profile of human hepatocellular carcinoma cell HepG1 transduced with interferon-r gene. Chin. J. Gastroenterol. 2001;6:211–214. [Google Scholar]
- Kamath R. S. Systematic functional analysis of the Caenorhabditis elegans genome using RNAi. Nature. 2003;421:231–236. doi: 10.1038/nature01278. [DOI] [PubMed] [Google Scholar]
- Lee K. K., Yonehara S. Phosphorylation and dimerization regulate nucleocytoplasmic shuttling of mammalian STE20-like kinase (MST) J. Biol. Chem. 2002;277:12351–12358. doi: 10.1074/jbc.M108138200. [DOI] [PubMed] [Google Scholar]
- Lee W. S., Hsu C. Y., Wang P. L., Huang C. Y., Chang C. H., Yuan C. J. Identification and characterization of the nuclear import and export signals of the mammalian Ste20-like protein kinase 3. FEBS Lett. 2004;572:41–45. doi: 10.1016/j.febslet.2004.07.007. [DOI] [PubMed] [Google Scholar]
- Lin J. L., Chen H. C., Fang H. I., Robinson D., Kung H. J., Shih H. M. MST4, a new Ste20-related kinase that mediates cell growth and transformation via modulating ERK pathway. Oncogene. 2001;20:6559–6569. doi: 10.1038/sj.onc.1204818. [DOI] [PubMed] [Google Scholar]
- Liquori C. L. Low frequency of PDCD10 mutations in a panel of CCM3 probands: potential for a fourth CCM locus. Hum. Mutat. 2006;27:118. doi: 10.1002/humu.9389. [DOI] [PubMed] [Google Scholar]
- Lu L., Ying K., Wei S., Liu Y., Lin H., Mao Y. Dermal fibroblast-associated gene induction by asiaticoside shown in vitro by DNA microarray analysis. Br. J. Dermatol. 2004;151:571–578. doi: 10.1111/j.1365-2133.2004.06146.x. [DOI] [PubMed] [Google Scholar]
- Mellor H. Cell motility: Golgi signalling shapes up to ship out. Curr. Biol. 2004;14:R434–R435. doi: 10.1016/j.cub.2004.05.038. [DOI] [PubMed] [Google Scholar]
- Mudgett J. S., Ding J., Guh-Siesel L., Chartrain N. A., Yang L., Gopal S., Shen M. M. Essential role for p38 alpha mitogen-activated protein kinase in placental angiogenesis. Proc. Natl. Acad. Sci. USA. 2000;97:10454–10459. doi: 10.1073/pnas.180316397. [DOI] [PMC free article] [PubMed] [Google Scholar]
- Nelson R. M., Long G. L. A general method of site-specific mutagenesis using a modification of the Thermus aquaticus polymerase chain reaction. Anal. Biochem. 1989;180:147–151. doi: 10.1016/0003-2697(89)90103-6. [DOI] [PubMed] [Google Scholar]
- Preisinger C., Short B., De Corte V., Bruyneel E., Haas A., Kopajtich R., Gettemans J., Barr F. A. YSK1 is activated by the Golgi matrix protein GM130 and plays a role in cell migration through its substrate 14-3-3zeta. J. Cell Biol. 2004;164:1009–1020. doi: 10.1083/jcb.200310061. [DOI] [PMC free article] [PubMed] [Google Scholar]
- Qian Z., Lin C., Espinosa R., LeBeau M., Rosner M. R. Cloning and characterization of MST4, a novel Ste20-like kinase. J. Biol. Chem. 2001;276:22439–22445. doi: 10.1074/jbc.M009323200. [DOI] [PubMed] [Google Scholar]
- Srikantan V., Valladares M., Rhim J. S., Moul J. W., Srivastava S. HEPSIN inhibits cell growth/invasion in prostate cancer cells. Cancer Res. 2002;62:6812–6816. [PubMed] [Google Scholar]
- Saxena S., Jonsson Z. O., Dutta A. Small RNAs with imperfect match to endogenous mRNA repress translation. J. Biol. Chem. 2003;278:44312–44319. doi: 10.1074/jbc.M307089200. [DOI] [PubMed] [Google Scholar]
- Scacheri P. C., et al. Short interfering RNAs can induce unexpected and divergent changes in the levels of untargeted proteins in mammalian cells. Proc. Natl Acad. Sci. USA. 2004;101:1892–1897. doi: 10.1073/pnas.0308698100. [DOI] [PMC free article] [PubMed] [Google Scholar]
- Sung V., Luo W., Qian D., Lee I., Jallal B., Gishizky M. The Ste20 kinase MST4 plays a role in prostate cancer progression. Cancer Res. 2003;63:3356–3363. [PubMed] [Google Scholar]
- Uhlik M. T., Abell A. N., Johnson N. L., Sun W., Cuevas B. D., Lobel-Rice K. E., Horne E. A., Dell'Acqua M. L., Johnson G. L. Rac-MEKK3-MKK3 scaffolding for p38 MAPK activation during hyperosmotic shock. Nat. Cell Biol. 2003;5:1104–1110. doi: 10.1038/ncb1071. [DOI] [PubMed] [Google Scholar]
- Verlaan D. J., Roussel J., Laurent S. B., Elger C. E., Siegel A. M., Rouleau G. A. CCM3 mutations are uncommon in cerebral cavernous malformations. Neurology. 2005;65:1982–1983. doi: 10.1212/01.wnl.0000188903.75144.49. [DOI] [PubMed] [Google Scholar]
- Wang Y. G., Liu H. T., Zhang Y. M., Ma D. L. cDNA cloning and expression of an apoptosis-related gene, human TFAR-15 gene. Science in China C Life Sci. 1999;29:331–336. doi: 10.1007/BF03183610. [DOI] [PubMed] [Google Scholar]
- Wu Z., Jin H., Gu Y. Changes of gene expression in atrophic muscle induced by brachial plexus injury in rats. Chin. J. Traumatol. 2002;18:357–360. [Google Scholar]
- Yang J., Boerm M., McCarty M., Bucana C., Fidler I. J., Zhuang Y., Su B. Mekk3 is essential for early embryonic cardiovascular development. Nat. Genet. 2000;24:309–313. doi: 10.1038/73550. [DOI] [PubMed] [Google Scholar]
- Zawistowski J. S., Stalheim L., Uhlik M. T., Abell A. N., Ancrile B. B., Johnson G. L., Marchuk D. A. CCM1 and CCM2 protein interactions in cell signaling: implications for cerebral cavernous malformations pathogenesis. Hum. Mol. Genet. 2005;14:2521–2531. doi: 10.1093/hmg/ddi256. [DOI] [PubMed] [Google Scholar]


