Abstract
Reactive oxygen species (ROS) have been implicated in both cell signaling and pathology. A major source of ROS in endothelial cells is NADPH oxidase, which generates superoxide (O2.−) on the extracellular side of the plasma membrane but can result in intracellular signaling. To study possible transmembrane flux of O2.−, pulmonary microvascular endothelial cells were preloaded with the O2.−-sensitive fluorophore hydroethidine (HE). Application of an extracellular bolus of O2.− resulted in rapid and concentration-dependent transient HE oxidation that was followed by a progressive and nonreversible increase in nuclear HE fluorescence. These fluorescence changes were inhibited by superoxide dismutase (SOD), the anion channel blocker DIDS, and selective silencing of the chloride channel-3 (ClC-3) by treatment with siRNA. Extracellular O2.− triggered Ca2+ release in turn triggered mitochondrial membrane potential alterations that were followed by mitochondrial O2.− production and cellular apoptosis. These “signaling” effects of O2.− were prevented by DIDS treatment, by depletion of intracellular Ca2+ stores with thapsigargin and by chelation of intracellular Ca2+. This study demonstrates that O2.− flux across the endothelial cell plasma membrane occurs through ClC-3 channels and induces intracellular Ca2+ release, which activates mitochondrial O2.− generation.
INTRODUCTION
Reactive oxygen species (ROS) have been implicated in cellular signaling processes as well as a cause of oxidative stress (Taniyama and Griendling, 2003). It is now appreciated that a major source of ROS in the vasculature is through one or more isoforms of the phagocytic enzyme NADPH oxidase, a membrane-localized protein which generates the superoxide (O2.−) anion on the extracellular surface of the plasma membrane (Lambeth, 2004). As a charged and short-lived anion, it is believed that O2.− flux is insufficient to initiate intracellular signaling due to the combination of poor permeability through the phospholipid bilayer (Tanabe et al., 2005) and a rapid dismutation to its uncharged and more stable derivative, hydrogen peroxide (Finkel, 2003). However, recent evidence has indicated discrete signaling roles for both O2.− and H2O2 (Madesh and Hajnoczky, 2001; Devadas et al., 2002). In our studies, we have found that extracellular O2.−, but not H2O2, leads to Ca2+ signaling and apoptosis in pulmonary endothelial cells (Madesh et al., 2005). This indicates that extracellular O2.− produced by NADPH oxidase or other sources either crosses the plasma membrane or modifies cell surface proteins to mediate cell signaling.
Previous studies of erythrocytes and amniotic cells have provided evidence for O2.− transport through anion channels, which could be effectively blocked by 4,4′-diisothiocyanostilbene-2,2′-disulfonic acid (DIDS; Lynch and Fridovich, 1978; Ikebuchi et al., 1991). DIDS also effectively blocked release of O2.− from mitochondria into the cytosol (Han et al., 2003) without affecting ROS production (Korchak et al., 1980). Despite these reports, whether O2.− crosses the cell membrane to elicit a discrete intracellular signal remains controversial (Babior, 1999; Mikkelsen and Wardman, 2003).
The present study evaluated the response of pulmonary microvascular endothelial cells (PMVECs) to extracellular O2.−. Our findings using a fluorophore trap demonstrate that O2.− enters the cell through a chloride channel-3 (ClC-3)-dependent mechanism. Further, extracellular O2.−, through a Ca2+-mediated signaling event, stimulates the production of O2.− by the mitochondria. This observation provides a model by which extracellular O2.− can propagate intracellular ROS signaling.
MATERIALS AND METHODS
Materials
Hydroethidine (HE), MitoSOX Red, propidium iodide (PI), rhodamine 123, Fluo-4/AM, and BAPTA-AM were purchased from Invitrogen (Carlsbad, CA). The Basic Nucleofector Kit for primary mammalian endothelial cells was purchased from Amaxa Biosystems (Gaithersburg, MD). Silencer Predesigned ClC-3 (ID 60947 and 60858), negative control 1, and Cy3-labeled GAPDH small interfering RNA (siRNA) were purchased from Ambion (Austin, TX). Primers for β-actin, ClC-3, and ClC-4 were obtained from Operon Biotechnologies (Huntsville, AL). Rabbit polyclonal anti-ClC-3 antibody was obtained from Santa Cruz Biotechnology (Santa Cruz, CA). pEYFP-Mito was purchased from Clontech (BD Biosciences, Mountain View, CA). KO2, apocynin, angiotensin II, thapsigargin, and all other chemicals were purchased from Sigma (St. Louis, MO). Mice were obtained from The Jackson Laboratory (Bar Harbor, ME).
Cell Culture
Immortalized human pulmonary microvascular endothelial cells (HPMVEC clone ST1.6R) were generated as described previously (Krump-Konvalinkova et al., 2001) and cultured in Medium-199 supplemented with 15% FBS, glutamax, antibiotics, and endothelial cell growth supplement. Isolation, characterization, and propagation of mouse pulmonary microvascular endothelial cells (MPMVEC) from wild-type (C57BL/6) and gp91phox gene-targeted mice have been previously described (Milovanova et al., 2006). Primary cells were cultured in DMEM supplemented with 10% FBS, nonessential amino acids, endothelial cell growth supplement, and antibiotics and used between passages 6 and 20. For some experiments cells were transfected with various DNA constructs by electroporation (Amaxa Biosystems, Gaithersburg, MD) using programs T-23 or S-05 according to the manufacturer's instructions.
Imaging of O2.− Flux
PMVECs cultured on 0.2% gelatin-coated 25-mm diameter glass coverslips were loaded with the O2.−-sensitive dye HE (10 μM) in DMEM for 10 min at 37°C. Cells were then placed on a temperature-controlled stage, and images were recorded every 5 s for 5 min using LaserSharp software (Bio-Rad Laboratories, Hercules, CA) on a Bio-Rad Radiance 2000 imaging system (Bio-Rad Laboratories) equipped with a Kr/Ar-ion laser source at 568- and 605-nm excitation and emission, respectively, using a 60× oil objective. A bolus of KO2 was added after 1 min of baseline recording. KO2 was prepared in a 1.8 mM concentration as described previously (Reiter et al., 2000). KO2 was not directly applied to the image field to avoid alterations in microscope focus. For inhibitor studies, DIDS (200 μM) was present during HE loading and KO2 addition. Antioxidant enzymes were added immediately before imaging and mitochondrial inhibitors were added similarly as KO2. HE fluorescence was quantified by nuclear masking of all cells in the field. For angiotensin II (Ang II) and thrombin experiments, HPMVECs were cultured on coverslips, and the medium was replaced with M-199 containing 2% FBS 18 h before study. HPMVECs were pretreated with DIDS (300 μM) or apocynin (Apo; 2 μM) for 10 min before addition of 2 μM Ang II or 0.5 U/ml thrombin. For imaging, cells were loaded with HE (10 μM) and five independent fields were recorded by confocal microscopy.
Cell-free HE Oxidation Measurement
HE fluorescence (40 μM) in a 2 ml solution of PBS was monitored in a multiwavelength-excitation dual wavelength-emission fluorimeter (Delta RAM, PTI, Birmingham, NJ) using 510- and 568-nm excitation and emission, respectively. Briefly, KO2 or the xanthine/xanthine oxidase (X/XO; X-100 μM; XO-50 mU/ml) O2.−-generating system was added to the solution after 60 s of baseline recording. Total recording time was 3 min. DMSO, H2O2, and KOH were added in a similar manner. For dismutation studies, KO2 was added to a solution of PBS containing 1000 U superoxide dismutase (SOD), mixed briefly, and then added to the HE solution. Results were normalized to the baseline fluorescence before addition of O2.−. The stable oxidation product was assessed in intact MPMVECs loaded with HE. Briefly, cells were treated for 20 min with either antimycin A or a 10 μM bolus of KO2 and a spectral scan of emission wavelengths was performed using an excitation wavelength of 494 nm.
O2.− -induced HE Fluorescence and Mitochondrial ROS Production
PMVECs cultured on coverslips were loaded with HE and mounted on a confocal microscope stage as described earlier. After measurement of HE baseline fluorescence, KO2 (10 μM) or X/XO (X-100 μM; XO-20 mU/ml) was added to the medium evenly across the coverslip and gently agitated to mix the solution. After 20 min, five fields were chosen for imaging and quantitation. To measure O2.− in mitochondria, MPMVECs were transfected with 2 μg/ml pEYFP-Mito (Clontech, BD Biosciences) and cultured in complete medium. Colonies were selected and passaged to increase the number of green fluorescent protein (GFP)-positive cells and plated on gelatin-coated coverslips. Cells after loading with the mitochondrial-O2.−–sensitive fluorophore MitoSOX Red (Molecular Probes; 1.25 μM) were exposed to KO2, Tg, and DIDS as described above. In some experiments, MPMVECs were pretreated with BAPTA-AM (50 μM) for 30 min before KO2 application.
ClC-3 Knockdown
Confluent MPMVECs (5 × 10⁶) were washed and placed in serum-free DMEM before transfection by electroporation with 250 pmol of either ClC-3 or negative control siRNA. To establish transfection efficiency, PMVECs were also transfected with Cy3-labeled GAPDH siRNA. Cells were then transferred to the appropriate culture vehicle and cultured in RPMI medium supplemented with 10% FBS, essential amino acids, endothelial cell growth supplement, and antibiotics. To confirm transfection, cells at 24 h after transfection were counterstained with the nuclear marker DAPI and images were acquired using MetaMorph software (Molecular Devices, Downingtown, PA) via epifluorescence microscopy (TE2000U, 10× objective; Nikon, Melville, NY). After 24 h, medium was replaced with standard growth medium and changed daily for an additional 48 h. Cells at 60 h after transfection were lysed and evaluated for ClC-3 mRNA by RT-PCR or imaged via confocal microscopy, respectively. Cells at 72 h after transfection were lysed and ClC-3 protein level was assessed by Western blotting using a rabbit polyclonal anti-ClC-3.
Total RNA Extraction and RT-PCR
Total RNA was prepared from wild-type and siRNA transfected MPMVECs using an RNeasy Mini Kit (Qiagen, Valencia, CA). The Transcriptor first-strand cDNA synthesis kit (Roche Applied Science, Indianapolis, IN) was used to reverse transcribe cDNA from 2 μg of RNA using both random hexamer and anchored-oligo(dT)18 primers. For ClC-3, the forward and reverse primers were GCGTGAGAACCGCGTTACT and GCTTTCAGGAGAGGTTACGT, respectively. For ClC-4, the forward and reverse primers were GATGGGCATTATTTTGAGAAG and CAGTAGCATGCGAATACCCC, respectively. For β-actin, the forward and reverse primers were ATGGATGACGATATCGCTGC and CTTCTGACCCATACCCACCA, respectively. The PCR amplification profile consisted of an initial denaturation at 95°C for 2 min followed by 35 cycles of a 30-s denaturation at 95°C 30 s, annealing at 55°C for 30 s, and 1-min extension at 72°C, followed by a final 10-min extension step at 72°C using GoTaq DNA Polymerase (Promega, Madison, WI). PCR products were separated by electrophoresis on a 2% agarose/TBE gel and visualized by ethidium bromide staining.
Mitochondrial Membrane Potential
Cells cultured on coverslips were incubated with the cationic potentiometric fluorescent dye rhodamine 123 (25 μM) for 20 min at 37°C. After dye loading, the cells were washed and resuspended in DMEM. Images were recorded every 5 s for 5 min using the Bio-Rad Radiance 2000 imaging system with excitation at 488 nm. A decrease in mitochondrial membrane potential (ΔΨm) results in loss of rhodamine 123 from the mitochondria into the cytoplasm and the nucleus. Quantitation of the ΔΨm change was determined by nuclear masking for fluorescence of all cells in the field. Treatment with DIDS and other agents was performed as described above.
Measurement of [Ca2+]i Mobilization
Endothelial cells adherent to 25-mm-diameter glass coverslips were loaded with the cytosolic Ca2+ indicator Fluo-4/AM (5 μM; Invitrogen, Carlsbad, CA) at room temperature for 30 min in extracellular medium (ECM) containing 121 mM NaCl, 5 mM NaHCO3, 10 mM Na-HEPES, 4.7 mM KCl, 1.2 mM KH2PO4, 1.2 mM MgSO4, 2 mM CaCl2, 10 mM glucose, and 2.0% bovine serum albumin (BSA), pH 7.4, in the presence of 100 μM sulfinpyrazone and 0.003% pluronic acid. After dye loading, the cells were washed and resuspended in the experimental imaging solution (ECM containing 0.25% BSA) and images recorded every 3 s at 488-nm excitation using the Bio-Rad Radiance 2000 imaging system.
Annexin V Imaging
To determine phosphatidylserine externalization as an indication of early apoptosis, cells were exposed to KO2 for 3 h and incubated with the conjugate annexin V Alexa-Fluor-488 (Molecular Probes) for 15 min in annexin V binding buffer. PI (0.5 μg/ml) was added 5 min before imaging. After treatment, annexin V– and PI-positive cells were excited at 488 and 568 nm, respectively, and were counted in 10 independent fields. The normally impermeable PI is internalized as the plasma membrane loses integrity. Positive PI staining indicates either late stage apoptosis or necrosis.
Data Analysis
Either nuclear (HE, rhodamine 123) or perinuclear (MitoSOX Red) masking of all cells in a given field was used to quantitate the cellular response using Spectralyzer (custom software provided by Paul Anderson, Thomas Jefferson University) image analysis software. Tracings indicate the mean fluorescence value of all cells in one field and are indicative of n independent experiments. Multiple experiments were normalized to baseline average and expressed as fold change. Data are expressed as mean ± SEM for n independent experiments.
RESULTS
Extracellular O2.− Causes Rapid and Transient Intracellular HE Oxidation
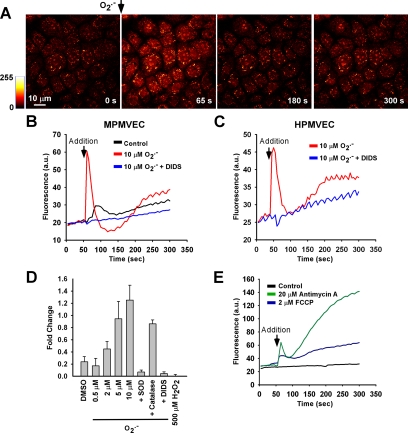
To evaluate transmembrane flux of O2.−, we measured the effects of the addition of a single extracellular bolus of O2.− (10 μM) to the cell culture medium, a concentration within the range produced by activated macrophages or by the granulocyte respiratory burst (Nathan and Root, 1977; Johnston et al., 1978). The bolus of O2.− caused rapid and transient HE oxidation in MPMVECs (Figure 1A), which was eliminated by pretreatment with DIDS (200 μM; Figure 1B). HPMVECs responded similarly to bolus O2.− addition (Figure 1C). Subsequent experiments with MPMVECs exposed to varied O2.− concentrations revealed a concentration-dependent response that was blocked either by SOD (2500 U/ml) or by DIDS (200 μM); catalase (1,000 U/ml) had relatively little effect (Figure 1D). Application of O2.− also resulted in a dip in fluorescence below baseline values after the transient peak (Figure 1B). Because this dip corresponded to brief gap formation in the endothelial monolayer as observed by simultaneous recording of differential interference contrast (DIC; data not shown), it most likely represents a transient alteration of focus. We postulate that the transient gaps in the endothelial monolayer are associated with intracellular Ca2+ release as described below. H2O2 (500 μM) added as a bolus had no effect on HE fluorescence (Figure 1D).
Figure 1.
Hydroethidine (HE) oxidation with addition of extracellular O2.−. (A) A single bolus of O2.− was delivered to HE-loaded MPMVECs and recorded every 5 s. (B) Tracing indicating mean nuclear fluorescence of all cells in the field after addition of DMSO vehicle (control) or O2.− with or without preincubation with DIDS (200 μM). (C) Same experiment as B using HPMVECs. (D) Peak fluorescence change in MPMVECs (fold change normalized to baseline) in response to DMSO (vehicle control, n = 5), O2.− at 0.5 μM (n = 5), 2 μM (n = 5), 5 μM (n = 4), and 10 μM (n = 5), and H2O2 (500 μM; n = 3). The effects of SOD (2500 U/ml; n = 5), catalase (1000 U/ml; n = 3), and DIDS (200 μM; n = 5) were evaluated in the presence of 10 μM O2.−. (E) Mean cellular nuclear HE fluorescence after treatment with mitochondrial complex III inhibitor antimycin A (20 μM; n = 3) or the uncoupler FCCP (2 μM; n = 3).
To evaluate the effects of O2.− from an intracellular source, the mitochondrial complex III inhibitor antimycin A (AA; 20 μM) and the mitochondrial uncoupler carbonyl cyanide p-[trifluoromethoxy]-phenyl-hydrazone (FCCP; 2 μM) were applied to HE-loaded MPMVECs because these compounds are known to lead to rapid generation of intracellular O2.− (Koopman et al., 2005). Mitochondrial-derived O2.− resulting from either FCCP or AA treatment resulted in a rapid and progressive increase in HE fluorescence (Figure 1E). The fluorescence spectrum at 494-nm excitation was similar after treatment with either extracellular O2.− or AA, suggesting the same HE oxidation product (Supplementary Figure 1). The present studies do not allow us to differentiate between oxyethidium and ethidium in these experiments although previous studies suggest oxyethidium as the major stable metabolite (Zhao et al., 2005).
O2.− Causes Rapid and Transient HE Oxidation in a Cell-free System
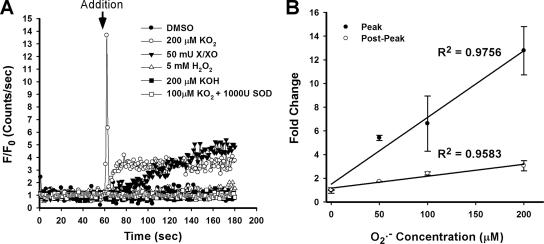
The reaction of HE with O2.− creates a stable product in a multistep process (Fink et al., 2004; Zhao et al., 2005). We therefore hypothesized that the HE fluorescence transient (Figure 1) may be an HE oxidation intermediate. A cell-free system was used to investigate the chemical nature of the transient response of HE to O2.− observed in PMVECs. The HE fluorescence changes were monitored after delivery of either a bolus of KO2 (200 μM) or a bolus of X/XO (50 mU/ml) delivered to HE (40 μM) dissolved in PBS (Figure 2A). Similar to findings with PMVECs, a rapid HE fluorescence transient was observed after KO2 application, whereas the X/XO O2.− generating system resulted in a progressive increase. HE fluorescence was unaltered after addition of DMSO vehicle (200 μl), KOH (200 μM), H2O2 (5 mM), or KO2 (100 μM) that had been predismutated into H2O2 by SOD (1000 U/ml). Increasing concentrations of O2.− correlated with the magnitude of both the initial peak and the stable postpeak HE fluorescence (Figure 2B).
Figure 2.
HE oxidation transient in a cell-free system. (A) Fluorescence change was measured in a fluorimeter after addition of agent to PBS containing 40 μM HE. Additions were DMSO vehicle, KO2 (200 μM), xanthine/xanthine oxidase (X/XO; 50 mU), H2O2 (5 mM), KOH (200 μM), and KO2 predismutated into H2O2 with SOD. (B) Quantitation of the normalized peak and postpeak HE fluorescence increase over baseline after addition of varying concentrations of KO2. Linear regression lines were calculated from the mean values of three independent experiments.
Extracellular O2.− Leads to Progressive HE Fluorescence Increase
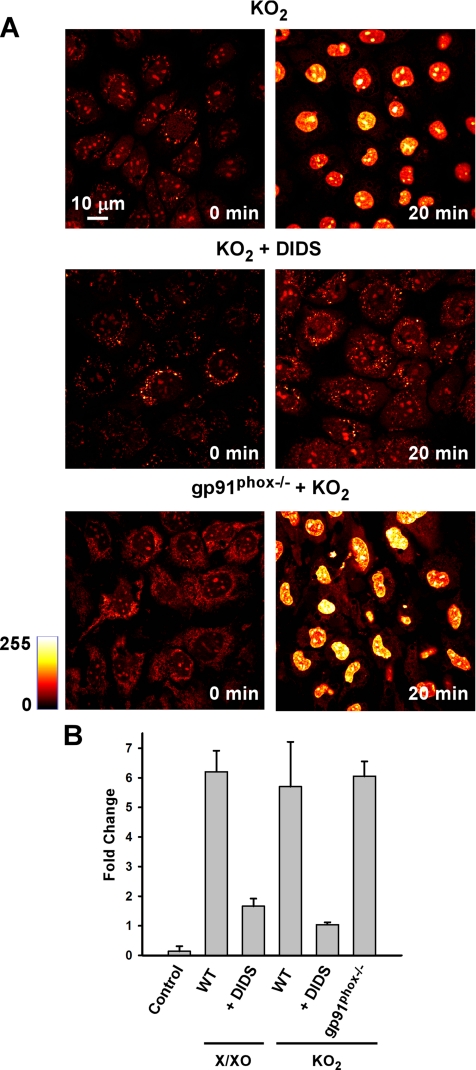
After the rapid HE transient, we consistently observed a gradual increase in HE fluorescence over the subsequent 300 s of imaging (Figure 1, B and C). We therefore monitored the effect of extracellular O2.− on stable (i.e., not transient) nuclear HE fluorescence in MPMVECs. Examination by microscopy showed a pronounced increase in nuclear HE fluorescence at 20 min after O2.− exposure that was prevented by pretreatment with DIDS (200 μM; Figure 3A). Quantitation of the images showed a 5.7 ± 1.5-fold increase over baseline in nuclear HE fluorescence with KO2 addition versus a 1.0 ± 0.1-fold increase with DIDS pretreatment. Similarly, extracellular O2.− derived from X/XO resulted in a profound increase in HE fluorescence (6.2 ± 0.7-fold) versus DIDS-pretreated cells (1.7 ± 0.3-fold). The fluorescence in cells without addition of O2.− was essentially unchanged (Control, Figure 3B). Because O2.− added as a bolus to the aqueous medium of a cell monolayer would be rapidly dissipated, we postulated a secondary source of oxidants for the delayed increase in endothelial cell nuclear HE fluorescence. MPMVECs lacking the gp91phox catalytic subunit of endothelial NADPH oxidase showed no difference from wild-type cells in the response of nuclear HE fluorescence to a bolus addition of O2.− (Figure 3B). This result indicates that the progressive HE oxidation triggered by extracellular O2.− is not the direct result of plasma membrane NADPH oxidase O2.− production, but rather suggests an intracellular source.
Figure 3.
The stable increase of nuclear HE fluorescence by extracellular O2.− is blocked by DIDS but is gp91phox independent. (A) HE fluorescence in MPMVECs before and 20 min after exposure to extracellular O2.− (10 μM KO2) and in the absence (top panels) and presence of DIDS (200 μM). (B) HE fluorescence expressed as fold change versus baseline (zero time) was measured in untreated MPMVECs at 20 min after addition of O2.− (10 μM KO2 and 20 mU X/XO) with or without preincubation with DIDS (200 μM) and in gp91phox null cells. Control represents no additions. Results are mean ± SE; n = 3.
Receptor-mediated Increase in HE Fluorescence
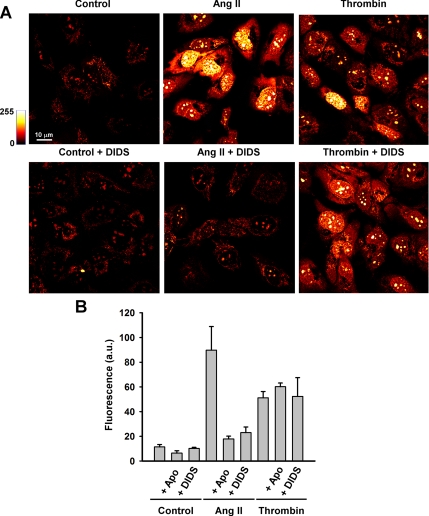
To determine whether “physiological” stimulation of O2.− generation could be detected by measurement of HE fluorescence, we used angiotensin II (Ang II; 2 μM) and thrombin (0.5 U/ml), two agonists known to increase endothelial ROS production through receptor-mediated signaling cascades (Takano et al., 2002; Li and Shah, 2004). O2.− production was monitored by the increase in HE fluorescence after 1 h of agonist stimulation. Both Ang II and thrombin increased O2.− production in HPMVECs (Supplementary Figure 2 and Figure 4). Pretreatment with the NADPH oxidase inhibitor Apo (2 μM) or with DIDS (300 μM) decreased HE oxidation in Ang II–stimulated cells (Supplementary Figure 2 and Figure 4), compatible with Ang II–mediated extracellular O2.− generation via NADPH oxidase. Thrombin-stimulated O2.− release, on the other hand, was insensitive to Apo and DIDS, suggesting an intracellular source of O2.− for this agonist.
Extracellular O2.− Triggers Mitochondrial O2.− Production
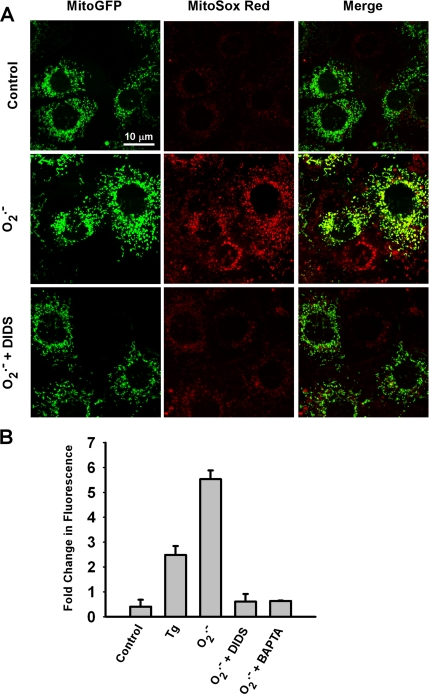
To assess mitochondria as a secondary source of O2.− in this model system, MPMVECs transfected with mitochondrial-targeted GFP were loaded with the O2.−-sensitive fluorophore MitoSOX Red (1.25 μM). O2.− added as a bolus to the cell culture medium evoked a large increase in MitoSOX Red fluorescence that was prevented by pretreatment of the cells with DIDS (Figure 5, A and B). The increase in MitoSOX Red fluorescence was ∼5.5-fold higher for O2.− versus untreated (vehicle only) cells (Figure 5B). Treatment with the sarcoplasmic/endoplasmic reticulum Ca2+-ATPase inhibitor thapsigargin (Tg) in the absence of extracellular O2.− resulted in transient elevation of intracellular Ca2+ and also triggered mitochondrial ROS production. Chelation of intracellular Ca2+ by BAPTA abolished the increase in MitoSOX Red fluorescence in response to bolus O2.− (Figure 5B). This result provides evidence that mitochondrial ROS generation occurs as a result of intracellular Ca2+ mobilization (Madesh et al., 2005). These data indicate that inhibition of O2.− flux across the plasma membrane by DIDS or ablation of O2.− -triggered Ca2+ release by chelation prevents mitochondrial ROS production associated with extracellular O2.−.
Figure 5.
Mitochondrial O2.− production in response to extracellular O2.−. (A) Images of MitoGFP-transfected MPMVECs incubated with the mitochondrial O2.−-sensitive fluorescent dye MitoSox Red (1.25 μM) after extracellular bolus of O2.− with or without DIDS (200 μM). Images were taken 20 min after KO2 addition. All cells in the field show increased MitoSox Red fluorescence with addition of O2.−. Cells where MitoGFP is expressed show colocalization with MitoSox Red (merge panels). (B) Quantitation of MitoSox Red fluorescence at 20 min expressed as fold change versus baseline (zero time) for untreated cells (control) or cells treated with Tg (2 μM) or O2.− (10 μM) with or without DIDS (200 μM) or BAPTA (50 μM). Results are mean ± SE; n = 3.
O2.− Effect Can Be Blocked by Selective ClC-3 Knockdown
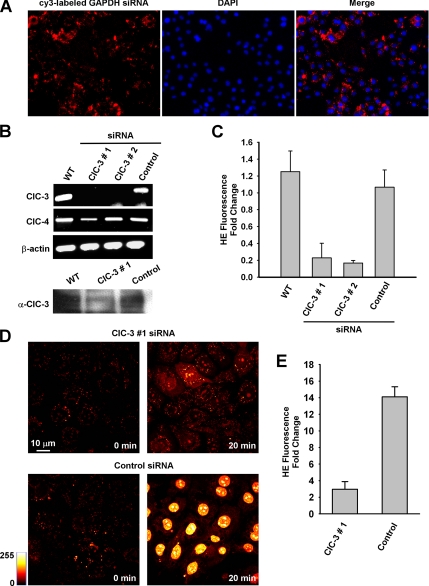
The effect of DIDS on HE and MitoSOX Red fluorescence in PMVECs suggests the requirement of an anion channel in O2.− flux across the plasma membrane. Because ClC-3 is the most abundant anion channel in endothelial cells (Lamb et al., 1999) and is inhibitable by DIDS (Hirotsu et al., 1999), we chose to assess whether knockdown of ClC-3 elicits a reduction in HE fluorescence similar to that demonstrated by DIDS. Electroporation efficiently delivered siRNA to MPMVECs as evidenced by microscopic evaluation of Cy3-labeled GAPDH siRNA (Figure 6A). siRNA sequences targeting exon 10 (sequence 1) and exons 2 and 3 (sequence 2) resulted in a marked decrease in ClC-3 mRNA expression by RT-PCR at an equivalent cycle amplification as compared with wild-type and negative control siRNA-transfected MPMVECs (Figure 6B). No differences in β-actin or ClC-4 expression were observed, indicating specificity of the siRNA effect. A reduction in ClC-3 protein expression was also noted at 72 h after delivery of ClC-3 siRNA (Figure 6B, bottom panel). Both the rapid peak (Figure 6C) and the subsequent increased nuclear HE fluorescence at 20 min after O2.− exposure (Figure 6, D and E) were markedly inhibited in ClC-3 siRNA treated cells (sequence 1) compared with negative control–transfected cells. These siRNA knockdown experiments provide additional evidence that O2.− membrane flux is mediated by ClC-3 and are consistent with the effect of DIDS on O2.−-mediated HE oxidation.
Figure 6.
ClC-3 knockdown attenuates intracellular HE oxidation. (A) Electroporation of siRNA effectively delivers siRNA to MPMVECs. Images represent cy3-labeled GAPDH siRNA counterstained with the nuclear marker DAPI. (B) CIC-3, CIC-4, and β-actin mRNA expression in MPMVECs 60 h after transfection with one of two different CIC-3 sequences or negative control siRNA (250 pmol). Bottom, Western blot of ClC-3 protein expression in wild-type (WT) MPMVECs and at 72 h after transfection with ClC-3 #1 or negative control siRNA (control). (C) HE fluorescence transient in WT (n = 5), ClC-3 #1 (n = 5) and #2 (n = 5) and negative control (n = 5) siRNA transfected MPMVECs after addition of 10 μM KO2 normalized to fold change versus baseline. (D) HE fluorescence at baseline and at 20 min after exposure to extracellular O2.− (10 μM) in ClC-3 siRNA #1 and negative control siRNA-transfected MPMVECs. (E) Quantitation of HE fluorescence normalized to fold change versus baseline for control and ClC-3 #1-treated MPMVECs (n = 3).
Mitochondrial O2.− Production Is Associated with Ca2+-dependent Changes in ΔΨm
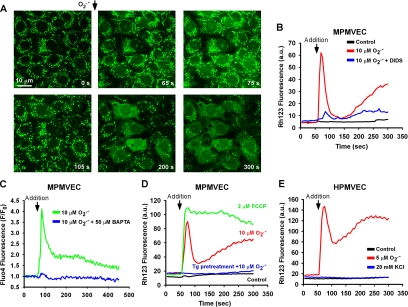
The effect of extracellular O2.− on mitochondrial membrane potential was evaluated as a potential mechanism for inducing mitochondrial O2.− production. In rhodamine 123–loaded MPMVECs, addition of O2.− (10 μM) to the medium caused a rapid leakage of dye from the mitochondria compatible with mitochondrial membrane depolarization (Figure 7A). Depolarization was associated with a dramatic alteration in mitochondrial morphology (Figure 7A, 105 s compared with zero time). At later times, mitochondrial depolarization was propagated to adjacent cells (Figure 7A, 200 and 300 s). Mitochondrial depolarization was blocked by pretreatment of cells with DIDS (Figure 7B). Reversible mitochondrial depolarization without major alterations in mitochondrial morphology was observed after low levels of O2.− (2 μM; data not shown). HPMVECs and MPMVECs demonstrated similar biphasic ΔΨm changes after addition of 5 μM O2.− (Figure 7, D and E). However, HPMVECs appeared to be more sensitive to O2.−, as addition of a 10 μM bolus produced irreversible ΔΨm loss (data not shown). ΔΨm changes were consistently delayed in comparison to the HE fluorescence transient. However, the biphasic phenomenon of ΔΨm alteration is similar to that observed with HE after O2.− exposure (see Figures 2 and 7).
Figure 7.
Effect of extracellular O2.− on ΔΨm. (A) Time-lapse images of MPMVECs loaded with the mitochondrial potentiometric dye rhodamine 123 (25 μM) before and after addition of KO2 (10 μM). (B) Representative tracing of nuclear rhodamine 123 fluorescence after addition of DMSO and KO2 (10 μM) with or without DIDS (200 μM). (C) Representative tracing of the cytosolic Ca2+ indicator dye Fluo4 after application of KO2 (10 μM) in the absence and presence of the Ca2+ chelator BAPTA (50 μM) normalized to baseline fluorescence. (D) Representative tracing of nuclear rhodamine 123 fluorescence after addition of DMSO and KO2 (10 μM) with or without pretreatment with thapsigargin (Tg; 2 μM). Dissipation of ΔΨm is demonstrated by addition of the mitochondrial uncoupler FCCP (2 μM). (D) Representative tracings of rhodamine 123 fluorescence in HPMVECs after addition of KO2 (5 μM) or KCl (20 mM). Representative tracings are indicative of three independent experiments.
Bolus addition of O2.− triggered rapid mobilization of intracellular Ca2+ that could effectively be abolished by BAPTA (50 μM; Figure 7C). Because Ca2+ mobilization demonstrated a similar transient to that of the ΔΨm, we investigated the causal role of intracellular Ca2+ in ΔΨm alterations in MPMVECs pretreated with Tg (2 μM). This pretreatment with Tg prevented mitochondrial depolarization after bolus addition of O2.− (Figure 7D) without having a direct effect on ΔΨm (Supplementary Figure 3), indicating that the effect of increased extracellular O2.− on ΔΨm requires Ca2+ derived from intracellular stores. The specificity of the Ca2+ effect was evaluated by measuring the responses to an uncoupler of mitochondrial respiration and to depolarization of the plasma membrane. Addition of the mitochondrial uncoupler FCCP (2 μM) facilitated irreversible ΔΨm loss in contrast to the biphasic response to extracellular O2.−. To investigate a possible interaction between plasma membrane and mitochondrial membrane potentials, 20 mM KCl was added to rhodamine 123–loaded HPMVECs in order to partially depolarize the plasma membrane (Zhang et al., 2005). KCl addition had no effect on ΔΨm (Figure 7E). This excludes a possible effect of this cation when added with O2.−.
Anion Channel Blockade Prevents O2.−-induced Apoptosis
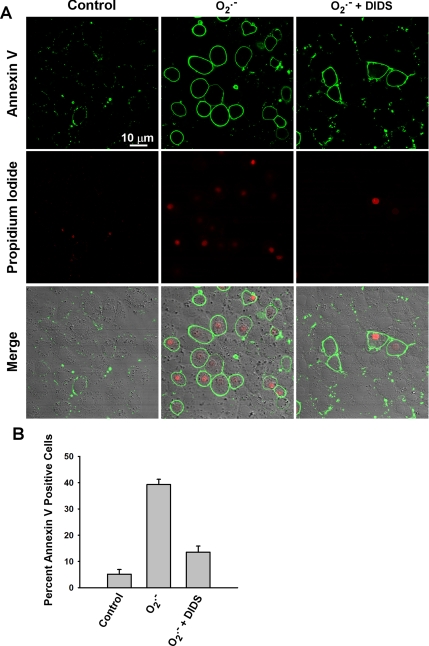
Addition of O2.− as a single bolus led to a subsequent significant increase in the number of MPMVECs that stained positively for annexin V (Figure 8, A and B). Many of the annexin V–positive cells also stained positively for PI. There was no significant population of PI-positive but annexin V–negative cells. These results are compatible with early to later events of apoptosis of MPMVECs associated with the O2.− bolus.
Figure 8.
Extracellular O2.− leads to apoptosis in MPMVECs. MPMVECs were grown on coverslips and subjected to an extracellular bolus of KO2 (10 μM) with or without DIDS pretreatment (200 μM). (A) Cells were stained 3 h post-O2.− exposure for annexin V and propidium iodide. (B) The percentage of annexin V–positive cells was determined for 10 fields in each of 3 independent experiments.
DISCUSSION
Pathophysiological models indicate that endothelial oxidative stress can lead to vascular dysfunction and damage (Taniyama and Griendling, 2003). However, specific oxidants may result in discrete effects on endothelial cells (Finkel, 2001; Devadas et al., 2002). Endogenous O2.− produced by NADPH oxidase has been implicated in cell proliferation (Milovanova et al., 2006), whereas phagocyte-derived O2.− is associated with endothelial apoptosis (Madesh et al., 2005). Although it is possible that the disparate functions of extracellular O2.− may be attributed to varying mechanisms including rapid dismutation to H2O2, modification of cell-surface proteins, or release of cytokines secondary to endothelial cell activation, we hypothesize a unique signaling cascade specific to the extracellular presence of this anion. The biological effects of extracellular ROS have been studied primarily by adding exogenous H2O2 to target cells (Wright et al., 1994) or by examining autocrine effects on the ROS-producing cells themselves (Thannickal and Fanburg, 2000). No studies, to our knowledge, have demonstrated a role for paracrine-derived O2.− in triggering intracellular ROS generation in a physiological/pathophysiological relevant context. In the present study, we demonstrate that extracellular O2.− can cross the cell membrane via ClC-3 and initiate an intracellular signaling cascade resulting in Ca2+-mediated O2.− production by the mitochondria. These results suggest an important role for extracellular O2.− in endothelial cell biology.
In this study, we investigated O2.− membrane flux by utilizing a previously unpublished property of the O2.−-sensitive fluorophore HE. The transient intracellular fluorescence peak associated with HE oxidation was O2.− concentration-dependent in both live cell and cell-free models. Specificity of this transient to O2.− is indicated by its inhibition with SOD, whereas catalase had no effect. Addition of KO2-treated HE to the extracellular milieu did not alter HE fluorescence (data not shown), excluding the possibility that HE oxidized outside the cell rapidly traverses the plasma membrane. Abrogation of the effect by DIDS suggests that this intracellular HE fluorescence transient results from membrane flux of O2.− through an anion channel. ClC-3 is the most abundant chloride channel in endothelial cells (Lamb et al., 1999) and knockout of this channel results in compensatory changes in cell membrane protein expression and function (Yamamoto-Mizuma et al., 2004). Selective knockdown of ClC-3 using siRNA resulted in a significant reduction in the HE transient similar to that observed by anion channel inhibition with DIDS. Therefore, we conclude that ClC-3 is the primary channel that supports transmembrane O2.− flux in endothelial cells.
After the HE transient with addition of O2.−, we observed a progressive increase in nuclear HE fluorescence that was blocked by DIDS and ClC-3 knockdown. It seems unlikely that this delayed response is due to the extracellular O2.− because of the expected short lifetime of O2.− in solution. A possibility for this finding is that extracellular O2.− triggered a secondary response in the cells leading to O2.− generation from a cellular source. Intracellular O2.− production by the mitochondrial inhibitor AA and the uncoupler FCCP resulted in progressive increase of nuclear HE fluorescence. This led us to hypothesize that the mitochondria may be a secondary source of O2.− after addition of O2.− to the extracellular medium. Measurement of nuclear HE fluorescence has been suggested as an indicator for O2.− derived from NADPH oxidase (Sun et al., 2005). However, O2.− generated by the mitochondria elicits a similar response (Becker et al., 1999). The failure of NADPH oxidase deficient cells to change the response and the use of the mitochondrial O2.− specific dye MitoSOX Red in the present experiments indicate that mitochondrial production of O2.− is primarily responsible for the progressive increase in nuclear HE fluorescence associated with extracellular O2.−. These results suggest that nuclear HE fluorescence associated with activation of NADPH oxidase and consequent extracellular O2.− generation may actually reflect mitochondrial-derived ROS resulting from intracellular Ca2+-mediated signaling.
Addition of Ang II or thrombin was used to initiate endogenous NADPH oxidase activity in endothelial cells in order to test whether mitochondrial O2.− production was activated by physiological levels of extracellular O2.−. We observed that Ang II triggered a significant increase in HE fluorescence that was blocked by both Apo and DIDS. Ang II–induced endothelial cell O2.− production has been linked to endothelial dysfunction and associated hypertension (Lassegue et al., 2001), and a link has been demonstrated between Ang II stimulated NADPH oxidase-derived O2.− and mitochondrial ROS production (Kimura et al., 2005). It has been proposed that ROS produced by mitochondria in endothelial cells serve an intracellular signaling function (Quintero et al., 2006). Oscillations in mitochondrial ROS production due to a localized production of ROS by a small number of mitochondria have provided evidence for mitochondrial-mediated signaling via ROS (Zorov et al., 2000; Aon et al., 2003). However, the possibility that extracellular ROS also could stimulate intracellular ROS production by the mitochondria has not been previously reported. The present study demonstrates that extracellular O2.− produced by NADPH oxidase can permeate the cell membrane to trigger intracellular (mitochondrial) ROS production.
Transmembrane O2.− flux has previously been shown in membranes highly enriched with anion channels, such as the erythrocyte (Lynch and Fridovich, 1978). However, under normal conditions, the diffusion distance of O2.− before spontaneous dismutation to H2O2 is estimated at 0.5 μm (Mikkelsen and Wardman, 2003). The rate of dismutation would be increased within the cell by cytosolic SOD (Fridovich, 1995). This precludes extracellular O2.− from traveling much beyond the plasma membrane to react with potential intracellular signaling proteins (Finkel, 2001). Nonetheless, we demonstrate that O2.−-mediated signaling can be attenuated by both molecular inhibition of ClC-3 and anion channel blockade by DIDS, indicating a discrete role for O2.− membrane flux in endothelial function. The question therefore arises as to the mechanism through which the short-lived O2.− anion leads to cell signaling. The experimental findings are that extracellular O2.− triggered rapid Ca2+ mobilization and that mitochondrial ROS production was preceded by Ca2+-dependent changes in ΔΨm and was prevented by passive depletion of ER Ca2+ stores. These results are in agreement with studies using activated macrophages or the X/XO O2.−-generating system (Madesh et al., 2005). Loss of ΔΨm in isolated mitochondria as a result of Ca2+ overload has been demonstrated previously (Galindo et al., 2003). Thus, we propose that the mechanism by which extracellular O2.− triggers mitochondrial O2.− production is through cell signaling secondary to Ca2+ release from intracellular stores. The present evidence supports this hypothesis, because mitochondrial O2.− generation occurred in association with increased intracellular Ca2+ after Tg treatment and was abolished by chelation of the increased Ca2+ mediated by extracellular O2.−. Based on our previous studies, O2.−-mediated Ca2+ release occurs via an inositol trisphosphate receptor-dependent mechanism (Madesh et al., 2005).
In summary, transmembrane O2.− flux occurs in PMVECs through ClC-3 channels and results in ΔΨm alterations and mitochondrial O2.− production. This novel finding elucidates a potential mechanism by which extracellular O2.− is propagated to the intracellular milieu to trigger endothelial cell signaling or dysfunction associated with oxidative stress. We postulate that endothelial cell injury via paracrine O2.− signaling may represent a basis for pulmonary vascular remodeling.
Supplementary Material
Figure 4.
Receptor-mediated endothelial cell O2.− generation results in a stable increase of nuclear HE fluorescence. HPMVECs were loaded with HE (10 μM) and stimulated with Ang II (2 μM) or thrombin (0.5 U/ml) for 1 h with or without pretreatment with the NADPH oxidase inhibitor apocynin (Apo; 2 μM) or the anion channel blocker DIDS (300 μM). Nuclear HE fluorescence was quantitated from the confocal microscopic images. Data represent mean ± SE of five independent fields (n = 3).
ACKNOWLEDGMENTS
We thank Drs. Sheldon Feinstein and Yefim Manevich for helpful suggestions, Kris DeBolt for cell isolation, Paul Anderson for providing Spectralyzer image analysis software, and Jennifer Rossi for typing the manuscript. This research was supported by National Institutes of Health (NIH), National Heart, Lung, and Blood Institute Grant HL75587. M.M. is supported by an American Heart Association Scientist Development Grant. B.H. is supported by NHLBI Grant T32 HL7748.
Abbreviations used:
- ROS
reactive oxygen species
- SOD
superoxide dismutase
- ClC-3
chloride channel-3
- ΔΨm
mitochondrial membrane potential
- DIDS
4,4′-diisothiocyanostilbene-2,2′-disulfonic acid
- HE
hydroethidium
- HPMVEC
human pulmonary microvascular endothelial cells
- Ang II
angiotensin II
- MPMVECs
murine pulmonary microvascular endothelial cells
- Apo
apocynin
- FCCP
carbonyl cyanide p[trifluoromethoxy]-phenyl-hydrazone
- Tg
thapsigargin.
Footnotes
This article was published online ahead of print in MBC in Press (http://www.molbiolcell.org/cgi/doi/10.1091/mbc.E06-09-0830) on March 14, 2007.
 The online version of this article contains supplemental material at MBC Online (http://www.molbiolcell.org).
REFERENCES
- Aon M. A., Cortassa S., Marban E., O'Rourke B. Synchronized whole cell oscillations in mitochondrial metabolism triggered by a local release of reactive oxygen species in cardiac myocytes. J. Biol. Chem. 2003;278:44735–44744. doi: 10.1074/jbc.M302673200. [DOI] [PubMed] [Google Scholar]
- Babior B. M. NADPH oxidase: an update. Blood. 1999;93:1464–1476. [PubMed] [Google Scholar]
- Becker L. B., vanden Hoek T. L., Shao Z. H., Li C. Q., Schumacker P. T. Generation of superoxide in cardiomyocytes during ischemia before reperfusion. Am. J. Physiol. 1999;277:H2240–H2246. doi: 10.1152/ajpheart.1999.277.6.H2240. [DOI] [PubMed] [Google Scholar]
- Devadas S., Zaritskaya L., Rhee S. G., Oberley L., Williams M. S. Discrete generation of superoxide and hydrogen peroxide by T cell receptor stimulation: selective regulation of mitogen-activated protein kinase activation and fas ligand expression. J. Exp. Med. 2002;195:59–70. doi: 10.1084/jem.20010659. [DOI] [PMC free article] [PubMed] [Google Scholar]
- Fink B., Laude K., McCann L., Doughan A., Harrison D. G., Dikalov S. Detection of intracellular superoxide formation in endothelial cells and intact tissues using dihydroethidium and an HPLC-based assay. Am. J. Physiol. Cell Physiol. 2004;287:C895–C902. doi: 10.1152/ajpcell.00028.2004. [DOI] [PubMed] [Google Scholar]
- Finkel T. Reactive oxygen species and signal transduction. IUBMB Life. 2001;52:3–6. doi: 10.1080/15216540252774694. [DOI] [PubMed] [Google Scholar]
- Finkel T. Oxidant signals and oxidative stress. Curr. Opin. Cell Biol. 2003;15:247–254. doi: 10.1016/s0955-0674(03)00002-4. [DOI] [PubMed] [Google Scholar]
- Fridovich I. Superoxide radical and superoxide dismutases. Annu. Rev. Biochem. 1995;64:97–112. doi: 10.1146/annurev.bi.64.070195.000525. [DOI] [PubMed] [Google Scholar]
- Galindo M. F., Jordan J., Gonzalez-Garcia C., Cena V. Reactive oxygen species induce swelling and cytochrome c release but not transmembrane depolarization in isolated rat brain mitochondria. Br. J. Pharmacol. 2003;139:797–804. doi: 10.1038/sj.bjp.0705309. [DOI] [PMC free article] [PubMed] [Google Scholar]
- Han D., Antunes F., Canali R., Rettori D., Cadenas E. Voltage-dependent anion channels control the release of the superoxide anion from mitochondria to cytosol. J. Biol. Chem. 2003;278:5557–5563. doi: 10.1074/jbc.M210269200. [DOI] [PubMed] [Google Scholar]
- Hirotsu S., Abe Y., Okada K., Nagahara N., Hori H., Nishino T., Hakoshima T. Crystal structure of a multifunctional 2-Cys peroxiredoxin heme-binding protein 23 kDa/proliferation-associated gene product. Proc. Natl. Acad. Sci. USA. 1999;96:12333–12338. doi: 10.1073/pnas.96.22.12333. [DOI] [PMC free article] [PubMed] [Google Scholar]
- Ikebuchi Y., Masumoto N., Tasaka K., Koike K., Kasahara K., Miyake A., Tanizawa O. Superoxide anion increases intracellular pH, intracellular free calcium, and arachidonate release in human amnion cells. J. Biol. Chem. 1991;266:13233–13237. [PubMed] [Google Scholar]
- Johnston R. B., Jr, Godzik C. A., Cohn Z. A. Increased superoxide anion production by immunologically activated and chemically elicited macrophages. J. Exp. Med. 1978;148:115–127. doi: 10.1084/jem.148.1.115. [DOI] [PMC free article] [PubMed] [Google Scholar]
- Kimura S., Zhang G. X., Nishiyama A., Shokoji T., Yao L., Fan Y. Y., Rahman M., Suzuki T., Maeta H., Abe Y. Role of NAD(P)H oxidase- and mitochondria-derived reactive oxygen species in cardioprotection of ischemic reperfusion injury by angiotensin II. Hypertension. 2005;45:860–866. doi: 10.1161/01.HYP.0000163462.98381.7f. [DOI] [PubMed] [Google Scholar]
- Koopman W. J., Verkaart S., Visch H. J., van der Westhuizen F. H., Murphy M. P., van den Heuvel L. W., Smeitink J. A., Willems P. H. Inhibition of complex I of the electron transport chain causes O2.−-mediated mitochondrial outgrowth. Am. J. Physiol. Cell Physiol. 2005;288:C1440–C1450. doi: 10.1152/ajpcell.00607.2004. [DOI] [PubMed] [Google Scholar]
- Korchak H. M., Eisenstat B. A., Hoffstein S. T., Dunham P. B., Weissmann G. Anion channel blockers inhibit lysosomal enzyme secretion from human neutrophils without affecting generation of superoxide anion. Proc. Natl. Acad. Sci. USA. 1980;77:2721–2725. doi: 10.1073/pnas.77.5.2721. [DOI] [PMC free article] [PubMed] [Google Scholar]
- Krump-Konvalinkova V., Bittinger F., Unger R. E., Peters K., Lehr H. A., Kirkpatrick C. J. Generation of human pulmonary microvascular endothelial cell lines. Lab. Invest. 2001;81:1717–1727. doi: 10.1038/labinvest.3780385. [DOI] [PubMed] [Google Scholar]
- Lamb F. S., Clayton G. H., Liu B. X., Smith R. L., Barna T. J., Schutte B. C. Expression of CLCN voltage-gated chloride channel genes in human blood vessels. J. Mol. Cell Cardiol. 1999;31:657–666. doi: 10.1006/jmcc.1998.0901. [DOI] [PubMed] [Google Scholar]
- Lambeth J. D. NOX enzymes and the biology of reactive oxygen. Nat. Rev. Immunol. 2004;4:181–189. doi: 10.1038/nri1312. [DOI] [PubMed] [Google Scholar]
- Lassegue B., Sorescu D., Szocs K., Yin Q., Akers M., Zhang Y., Grant S. L., Lambeth J. D., Griendling K. K. Novel gp91(phox) homologues in vascular smooth muscle cells: nox1 mediates angiotensin II-induced superoxide formation and redox-sensitive signaling pathways. Circ. Res. 2001;88:888–894. doi: 10.1161/hh0901.090299. [DOI] [PubMed] [Google Scholar]
- Li J. M., Shah A. M. Endothelial cell superoxide generation: regulation and relevance for cardiovascular pathophysiology. Am. J. Physiol. Regul. Integr. Comp. Physiol. 2004;287:R1014–R1030. doi: 10.1152/ajpregu.00124.2004. [DOI] [PubMed] [Google Scholar]
- Lynch R. E., Fridovich I. Permeation of the erythrocyte stroma by superoxide radical. J. Biol. Chem. 1978;253:4697–4699. [PubMed] [Google Scholar]
- Madesh M., Hajnoczky G. VDAC-dependent permeabilization of the outer mitochondrial membrane by superoxide induces rapid and massive cytochrome c release. J. Cell Biol. 2001;155:1003–1015. doi: 10.1083/jcb.200105057. [DOI] [PMC free article] [PubMed] [Google Scholar]
- Madesh M., Hawkins B. J., Milovanova T., Bhanumathy C. D., Joseph S. K., RamachandraRao S. P., Sharma K., Kurosaki T., Fisher A. B. Selective tole for superoxide in InsP3 receptor-mediated mitochondrial dysfunction and endothelial apoptosis. J. Cell Biol. 2005;170:1079–1090. doi: 10.1083/jcb.200505022. [DOI] [PMC free article] [PubMed] [Google Scholar]
- Mikkelsen R. B., Wardman P. Biological chemistry of reactive oxygen and nitrogen and radiation-induced signal transduction mechanisms. Oncogene. 2003;22:5734–5754. doi: 10.1038/sj.onc.1206663. [DOI] [PubMed] [Google Scholar]
- Milovanova T., Chatterjee S., Manevich Y., Kotelnikova I., Debolt K., Madesh M., Moore J. S., Fisher A. B. Lung endothelial cell proliferation with decreased shear stress is mediated by reactive oxygen species. Am. J. Physiol. Cell Physiol. 2006;290:C66–C76. doi: 10.1152/ajpcell.00094.2005. [DOI] [PubMed] [Google Scholar]
- Nathan C. F., Root R. K. Hydrogen peroxide release from mouse peritoneal macrophages: dependence on sequential activation and triggering. J. Exp. Med. 1977;146:1648–1662. doi: 10.1084/jem.146.6.1648. [DOI] [PMC free article] [PubMed] [Google Scholar]
- Quintero M., Colombo S. L., Godfrey A., Moncada S. Mitochondria as signaling organelles in the vascular endothelium. Proc. Natl. Acad. Sci. USA. 2006;103:5379–5384. doi: 10.1073/pnas.0601026103. [DOI] [PMC free article] [PubMed] [Google Scholar]
- Reiter C. D., Teng R. J., Beckman J. S. Superoxide reacts with nitric oxide to nitrate tyrosine at physiological pH via peroxynitrite. J. Biol. Chem. 2000;275:32460–32466. doi: 10.1074/jbc.M910433199. [DOI] [PubMed] [Google Scholar]
- Sun C., Sellers K. W., Sumners C., Raizada M. K. NAD(P)H oxidase inhibition attenuates neuronal chronotropic actions of angiotensin II. Circ. Res. 2005;96:659–666. doi: 10.1161/01.RES.0000161257.02571.4b. [DOI] [PubMed] [Google Scholar]
- Takano M., Meneshian A., Sheikh E., Yamakawa Y., Wilkins K. B., Hopkins E. A., Bulkley G. B. Rapid upregulation of endothelial P-selectin expression via reactive oxygen species generation. Am. J. Physiol. Heart Circ. Physiol. 2002;283:H2054–H2061. doi: 10.1152/ajpheart.01001.2001. [DOI] [PubMed] [Google Scholar]
- Tanabe S., Wang X., Takahashi N., Uramoto H., Okada Y. HCO(3)(-)-independent rescue from apoptosis by stilbene derivatives in rat cardiomyocytes. FEBS Lett. 2005;579:517–522. doi: 10.1016/j.febslet.2004.12.020. [DOI] [PubMed] [Google Scholar]
- Taniyama Y., Griendling K. K. Reactive oxygen species in the vasculature: molecular and cellular mechanisms. Hypertension. 2003;42:1075–1081. doi: 10.1161/01.HYP.0000100443.09293.4F. [DOI] [PubMed] [Google Scholar]
- Thannickal V. J., Fanburg B. L. Reactive oxygen species in cell signaling. Am. J. Physiol. Lung Cell Mol. Physiol. 2000;279:L1005–L1028. doi: 10.1152/ajplung.2000.279.6.L1005. [DOI] [PubMed] [Google Scholar]
- Wright D. T., Cohn L. A., Li H., Fischer B., Li C. M., Adler K. B. Interactions of oxygen radicals with airway epithelium. Environ. Health Perspect. 1994;102(Suppl 10):85–90. doi: 10.1289/ehp.94102s1085. [DOI] [PMC free article] [PubMed] [Google Scholar]
- Yamamoto-Mizuma S., Wang G. X., Liu L. L., Schegg K., Hatton W. J., Duan D., Horowitz T. L., Lamb F. S., Hume J. R. Altered properties of volume-sensitive osmolyte and anion channels (VSOACs) and membrane protein expression in cardiac and smooth muscle myocytes from Clcn3-/- mice. J. Physiol. 2004;557:439–456. doi: 10.1113/jphysiol.2003.059261. [DOI] [PMC free article] [PubMed] [Google Scholar]
- Zhang Q., Matsuzaki I., Chatterjee S., Fisher A. B. Activation of endothelial NADPH oxidase during normoxic lung ischemia is KATP channel dependent. Am. J. Physiol. Lung Cell Mol. Physiol. 2005;289:L954–L961. doi: 10.1152/ajplung.00210.2005. [DOI] [PubMed] [Google Scholar]
- Zhao H., Joseph J., Fales H. M., Sokoloski E. A., Levine R. L., Vasquez-Vivar J., Kalyanaraman B. Detection and characterization of the product of hydroethidine and intracellular superoxide by HPLC and limitations of fluorescence. Proc. Natl. Acad. Sci. USA. 2005;102:5727–5732. doi: 10.1073/pnas.0501719102. [DOI] [PMC free article] [PubMed] [Google Scholar]
- Zorov D. B., Filburn C. R., Klotz L. O., Zweier J. L., Sollott S. J. Reactive oxygen species (ROS)-induced ROS release: a new phenomenon accompanying induction of the mitochondrial permeability transition in cardiac myocytes. J. Exp. Med. 2000;192:1001–1014. doi: 10.1084/jem.192.7.1001. [DOI] [PMC free article] [PubMed] [Google Scholar]
Associated Data
This section collects any data citations, data availability statements, or supplementary materials included in this article.


