Abstract
Amantadine is known to block the M2 proton channel of the Influenza A virus. Here, we present a structure of the M2 trans-membrane domain blocked with amantadine, built using orientational constraints obtained from solid-state NMR polarization-inversion-spin-exchange-at-the-magic-angle experiments. The data indicates a kink in the monomer between two helical fragments having 20° and 31° tilt angles with respect to the membrane normal. This monomer structure is then used to construct a plausible model of the tetrameric amantadine-blocked M2 trans-membrane channel. The influence of amantadine binding through comparative cross polarization magic-angle spinning spectra was also observed. In addition, spectra are shown of the amantadine-resistant mutant, S31N, in the presence and absence of amantadine.
INTRODUCTION
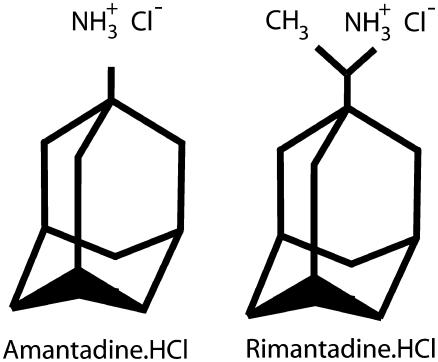
Influenza is a worldwide epidemic that causes substantial morbidity and mortality. Of the three types of influenza viruses—A, B, and C—only Influenza A and B can cause epidemic diseases. Amantadine (1-adamantanamine hydrochloride) and its analog rimantadine (Fig. 1) are licensed drugs in the United States and Europe. Both drugs have been used in the prophylaxis and treatment of influenza A viral infections. Unlike zanamivir and oseltamivir, which are neuraminidase inhibitors, amantadine and rimantadine act on the M2 proton channel in the membrane of the influenza A virus. Amantadine is generally believed to block the M2 channel in a manner similar to the interaction of quaternary ammonium blockers with various ion channels (1), and consequently stunts the replication of the Influenza A viruses in host cells. During the past influenza season, 94% of Influenza A mutated to an amantadine resistant (S31N) form (2).
FIGURE 1.
The structure of Amantadine and its analog Rimantadine.
The M2 proton channels function as pH modulators at two stages in viral replication. Initially, viruses enter cells via endocytosis, i.e., the host cell membrane engulfs a virus and forms an endosome. In this acidic compartment (pH 5–6), the opening of the M2 channel imports protons into the viron, triggering a change in protein-protein and protein-membrane interactions that leads to the uncoating of the viral particle. In a late stage of infection, newly synthesized M2 proteins form channels in the trans Golgi network and balance the pH gradient across the membrane. In this case, the channel exports protons from the trans Golgi lumen to the cytoplasm. The inhibitory efficacy of amantadine is directly associated with the function of the M2 channel in that the presence of amantadine results in the failure of viral uncoating (the early stage) and the premature conformational change of hemagglutinin (the late stage).
The M2 protein (97 amino-acid residues) is an integral membrane protein with a single trans-membrane (TM) helix. The functional M2 channel is a homotetramer (3) stabilized in part by disulfide bonds linked between the N-terminal cysteines near the membrane interface. The M2 protein exhibits proton conductivity in a variety of artificial and natural membrane systems such as oocytes (3), mammalian cells (4), and even lipid bilayers (5). Consistently, the proton conductance is inhibited by a few μM amantadine or rimantadine, except in very low pH lipid bilayer preparations. Measurement of the proton current decay as a function of the amantadine concentration suggests that one drug molecule binds to one M2 tetramer with an apparent Kd of 0.3 μM (3).
The functional core of the channel is a TM domain (TMD) consisting of four α-helices. Evidence shows that the 25-residue M2-TMD polypeptides (S22SDP-LVVAASIIGILHLILWILDRL46) spontaneously form amantadine-sensitive proton channels once they are incorporated into lipid bilayers (6–9). The M2-TMD structure in lipid bilayers determined by solid-state NMR spectroscopy clearly displays an aqueous pore in the center that is most likely responsible for the proton conduction (10–14). In this structure, four helices tilt at ∼38° with respect to the bilayer normal and form a left-handed bundle with polar residues (e.g., His37 and Trp41) oriented toward the channel lumen (PDB code 1nyj). This structure is consistent with the cysteine scanning mutagenesis and electrophysiological studies of the M2 protein (15,16). The TM helices of the intact M2 protein, however, appear to orient in lipid bilayers with a somewhat smaller tilt angle of ∼25° (17).
The first M2/amantadine model was proposed by Sugrue and Hay (18,19). It was based on an analogy of the distribution of the amantadine-resistant M2 mutations with that of the mutations in the nicotinic acetylcholine receptor. The key feature of this model emphasizes the interaction between the amantadine amino group and the Ser31 hydroxyl group. This interaction was adopted later in the molecular modeling of the M2-TMD/amantadine complex (20). Recent structures of the M2-TMD provide more insight into amantadine binding, particularly that the pore volume is sufficient to accommodate an amantadine molecule. Taking advantage of these structures and analytical ultracentrifugation results for the M2-TMD mutants, Stouffer et al. (21) constructed a recent model that was very similar to that of Sugrue and Hay. Another model, proposed by Gandhi et al. (23), focuses on the possible H-bond interaction between the amantadine ammonium group and the nonprotonated nitrogen atoms on the His37 side chains. In all of these models, the adamantyl group of amantadine is believed to reside closer to the external surface of the viral membrane, consistent with the map of the amantadine-resistant mutations. Additionally, Astrahan et al. (24) suggested a model based on the Nishimura model (11) and surface plasma resonance spectroscopy of amantadine-insensitive mutants to explore the resistance mechanism of the M2 mutants.
Although it is natural to deduce the M2-TMD/amantadine complex on the basis of the ligand-free structure, both fluorescence spectroscopy and circular dichroism provide evidence for subtle structural changes in the presence of amantadine (25). In addition, Gandhi's energy-minimized model suggests that a structural rearrangement occurs upon amantadine binding (23). Titration of the His37 side chain from M2-TMD monitored by 15N CP/MAS NMR clearly demonstrates decreased proton affinity and restricted motion in the presence of amantadine (26). Here, we report the influence of amantadine binding on the M2-TMD NMR spectra. We then derive structural orientation restraints for M2-TMD in the presence of amantadine from a series of polarization-inversion-spin-exchange-at-the-magic-angle (PISEMA) experiments (27,28) performed on uniformly and selectively labeled aligned samples. Each labeled 15N backbone atom gives geometric information about the corresponding peptide plane. We use the data to build an atomic structure of the monomer, and then construct a tetrameric model of the ligand-bound M2-TMD. The tetrameric nature of M2-TMD has been suggested by both ultracentrifugation (25) and solid-state NMR (7).
MATERIALS AND METHODS
Sample preparation
All 15N labeled amino acids were purchased from Cambridge Isotope Laboratories (Cambridge, MA). Single or multiple-site 15N labeled M2-TMD samples were synthesized and incorporated into DMPC/DMPG liposomes as described previously (9). For an M2-TMD sample with 10 mM amantadine, 46.9 mg amantadine (250 μmol) hydrochloride (Fisher Scientific, Suwanee, GA) in 5 ml citrate-borate-phosphate (CBP) buffer was added to an M2-TMD loaded vesicle suspension (20 ml). The suspension was incubated at room temperature overnight and pelleted by ultracentrifugation (196,000 g). The M2-TMD in DMPC/DMPG liposomes with or without amantadine was packed into a 7 mm Bruker zirconia spinner (Billerica, MA) with a sealing cap designed for magic-angle spinning (MAS) NMR experiments.
Oriented samples of the peptide in hydrated DMPC bilayers were prepared by first co-dissolving M2-TMD (∼120 mg) and DMPC (∼75 mg) in 10 ml TFE. TFE was removed by rotary evaporation and dried further under high vacuum. CBP buffer, 15 ml, 2 mM (∼37°C, pH 8.8) with 1 mM EDTA, was added to the dried mixture and shaken in a shaker bath at 37°C, which is higher than the gel-to-liquid-crystalline phase transition temperature of DMPC of ∼23°C (29). This lipid suspension was bath-sonicated for 10 min intermittently. The sonicated suspension was then loaded into a 1 kDa MW cutoff dialysis bag. The dialysis bag was placed in a 1 L volume of 2 mM CBP buffer (pH 8.8) overnight to equilibrate the pH between the M2-TMD/DMPC liposomes and the outside buffer. For the samples with amantadine, the outside buffer contained 10 mM amantadine. The liposomes were passed through a 2 μm filter and pelleted by ultracentrifugation at 196,000 g. The pellet was agitated at 37°C for 1 h until fluid. This thick fluid was spread onto 50 glass slides (5.7 mm × 12.0 mm) (Marienfeld Glassware, Bad Margentheim, Germany) and dehydrated in a 70–75% humidity chamber. The dehydrated slides were rehydrated with 1.5 μl 2 mM CBP buffer followed by being stacked into a glass tube. The sample was incubated at 43°C for 24 h in a 96% relative humidity (saturated K2SO4) chamber. Finally, the glass tube was sealed at both ends with epoxy and two glass caps.
Solid-state NMR experiments
All CPMAS NMR experiments were performed on a Bruker DMX-300 NMR spectrometer with a 7 mm rotor Bruker triple resonance MAS probe. The 15N CPMAS spectra were recorded with a 5 s recycle delay at a resonance frequency of 30.418 MHz, 277 K, and a spinning rate of 3 kHz. After a 90° pulse of 7 μs applied on the 1H channel, an optimized 2 ms contact time was used for cross polarization followed by high power continuous wave proton decoupling during acquisition. 10 K scans were accumulated for each experiment and a 100 Hz exponential line broadening was applied to the free induction decay before Fourier transformation. Two-dimensional PISEMA experiments were performed on a 9.4 Tesla magnet with a Bruker Advance console using a homebuilt 15N/1H double-resonance probe. The air temperature flowing through the NMR sample tube was set to 298 K by an XR401 sample cooler (FTS Systems, Stone Ridge, NY). The rate of airflow was 500 l/h. Typically, a 6 s recycle delay was applied before the initial 1H 90° irradiation pulse with a radio-frequency (RF) field of 52.1 kHz. This RF field was also applied during the 1H-15N cross polarization (800 μs) and 1H continuous wave decoupling, while an RF field of 63.7 kHz was used during the Lee-Goldburg spin exchange at the magic angle. Thirty-two T1 increments with 512 or 1024 scans were recorded for two-dimensional PISEMA spectra. 15N chemical shift of a saturated 15NH4NO3 was referenced as 0 ppm for all 15N chemical shifts.
NMR data simulations, structural calculations, and refinement
Standard peptide plane geometry (30) with average magnitudes and orientations for backbone amide 15N chemical shift tensors (α = 0°, β = 17°, σ11 = 31 ppm, σ22 = 55 ppm, and σ33 = 202 ppm) were used throughout our NMR data analysis (14,31–33). For the His37 and Trp41 side-chain 15N chemical shift tensors, values were obtained from Ramamoorthy et al. (34). The dipolar coupling constant for the 15N-1H interaction was computed to be 21.47 kHz. Torsion angle values for ideal α-helices (φ = −60°, ψ = −45°) were used in polar-index-slant-angle (PISA) wheel, PISEMA wave, and PISA helix simulations, which were described previously (26,33,35–39). All PISA wheel and PISEMA wave data analyses were performed using Maple 8 (MapleSoft, Waterloo, Ontario, CA).
An initial backbone structure for the M2-TMD monomer was built by fitting the PISEMA spectra with an ideal α-helix having a kink connecting two helical fragments with different tilt angles with respect to the bilayer normal that were deduced from PISA wheels (Fig. 4). Side chains were added from a rotamer library using SCWRL3.0 (42). To ensure proper stereochemistry, energy minimization was performed on all atoms using XPLOR-NIH (43) with the following stereochemical energy terms: bond distance, bond angle, dihedral angle, and improper dihedral angle. Each stereochemistry term was minimized individually in the order listed. Finally, nonbonded energy terms were added, consisting of a van der Waals energy term, two energy terms that reflect the experimental solid-state NMR energy (44), and a hydrogen-bonding term (45). All energy terms were weighted to be of the same order of magnitude. The solid-state NMR potentials used are of the form
 |
(1) |
 |
(2) |
where σc is the calculated chemical shift from the model, σo is the observed chemical shift, and νc and νo are the calculated and observed values of the dipolar coupling, respectively. The hydrogen-bonding potential is a semi-empirical force field that consists of distance and angular components (45). These potentials were implemented as Python (the Python programming language, http://www.python.org/) modules into the XPLOR-NIH refinement package. The modules are freely available at http://www.math.fsu.edu/∼bertram/software/sb.
FIGURE 4.
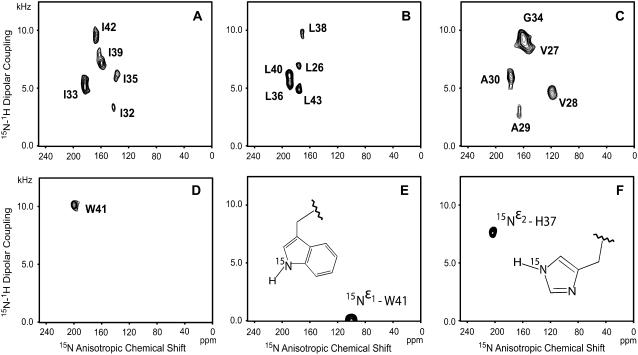
PISEMA spectra for 15N labeled M2-TMD samples uniformly aligned in DMPC bilayers in the presence of 10 mM amantadine at pH 8.8 and 308 K. Each panel shows data from separate selective labelings: (A) isoleucines; (B) leucines; (C) glycine, alanines, valines; and (D) tryptophan. Panels E and F are the data from side chain 15N of W41 and H37, respectively.
An initial M2TMD/amantadine homo-tetramer model was built by symmetric transformations of the energy-minimized monomer, which yielded minimal helix-helix interaction energy, as measured by the XPLOR-NIH van der Waals potential. The tetrameric initial model was then energy-minimized using the same procedure performed on the monomer.
RESULTS
Spectral change upon amantadine binding
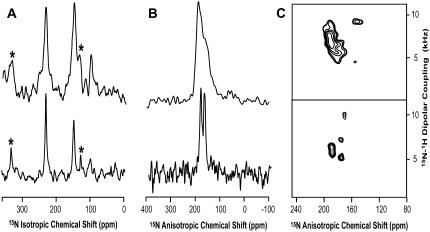
Drug or ligand binding to a protein commonly perturbs the structure and the chemical environment of the binding site, thereby shifting both the isotropic and anisotropic chemical shifts, in oriented systems, of those residues near the binding site. We conducted 15N CPMAS experiments of 15Nδ1 His37 M2-TMD in liposomes with and without amantadine (Fig. 2 A). The resonances at 230 ppm and 147 ppm are assigned to the nonprotonated 15Nδ1 signal and protonated 15Nδ1 signal, respectively, based on previous analyses (22). Both spectra of samples in the presence and absence of ligand observed at pH 8.8 indicate that His37 side chains are neutral. The peaks in the NMR spectrum with amantadine are much narrower than those without amantadine; the presence of amantadine reduces the signal line width by approximately a factor of two. Despite the change in line width, the isotropic chemical shifts for these two resonances are not significantly affected by the introduction of amantadine, suggesting little, if any, direct interaction between the amantadine amino group and the His37 nonprotonated Nδ1, as suggested by Gandhi et al. (23).
FIGURE 2.
Spectral comparison of the M2-TMD with (bottom) and without (top) amantadine. (A) CPMAS NMR spectra of 15Nδ1-His37 M2-TMD in DMPC/DMPG liposomes at pH 8.8 and 277 K. Asterisks indicate spinning side bands. (B) Static 15N spectra of 15N-(L26, L36, L38, L40, L43) M2-TMD uniformly aligned in DMPC bilayers at pH 9 and 298 K. (C) PISEMA spectra for the samples used in panel B.
The reduction of signal linewidth in the presence of amantadine is also reflected in the 15N anisotropic chemical shift spectra and PISEMA spectra of 15Nα leucine labeled M2-TMD (Fig. 2, B and C). The change in anisotropic chemical shift frequencies in the PISEMA spectra (Fig. 2 C) indicates that M2-TMD has a modified conformation once amantadine binds to the channel. The high-resolution PISEMA data allows us to characterize the backbone structure of M2-TMD/amantadine. Although the five 15N signals are severely overlapped in the one-dimensional spectrum (Fig. 2 B, bottom spectrum), four of five resonances are well resolved by the dipolar-coupling dimension in the PISEMA spectrum.
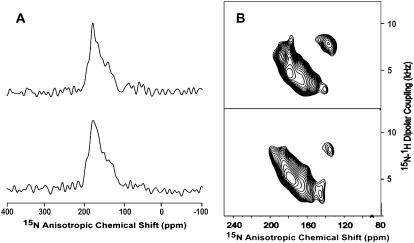
During the 2005–2006 flu season, 94% of the reported Influenza A cases were resistant to amantadine through the S31N mutation (2). A spectral comparison of this mutant with and without amantadine (Fig. 3) shows little conformational change in the backbone and no characteristic change in line width as seen in Fig. 2. This is consistent with our results that show a significant change when amantadine binds to the wild-type M2 and hence we conclude that amantadine does not bind to this amantadine resistant mutant. Furthermore, the data suggests a much greater tilt angle for the C-terminal region of the transmembrane helix than observed in the wild-type when amantadine is bound.
FIGURE 3.
Spectral comparison of the M2-TMD S31N mutant with (bottom) and without (top) amantadine. (A) Static 15N spectra of 15N-(L26, L36, L38, L40, L43) M2-TMD uniformly aligned in DMPC bilayers at pH 9 and 298 K. (B) PISEMA spectra for the samples used in panel A.
Structure of the M2-TMD monomer in the presence of amantadine
The resonance distribution of aligned helical proteins in PISEMA spectra follows a unique pattern called a polar-index-slant-angle (PISA) wheel (33,35,37). Two important structural properties—helical rotation angle and tilt angle—can be deduced by fitting the PISEMA spectrum with PISA wheels. This PISA wheel analysis provides a convenient tool to analyze membrane protein PISEMA spectra since the transmembrane domains of membrane proteins are predominantly α-helical (46,47).
Fig. 4 shows the PISEMA spectra from multiple and single-site backbone 15N labeled M2-TMD with amantadine in uniformly aligned lipid bilayers. Two side-chain 15N resonances,  and
and  are also shown in Fig. 4, E and F. The
  site in His37 is protonated more so at pH 8.8 than the
  site due to the predominance of this tautomeric state. Interestingly the Trp41 resonance appears at 0 kHz and at the isotropic chemical shift. A large anisotropy has been determined for this site (data not shown) and consequently these isotropic values are not the result of dynamics, but of a fortuitous orientation.
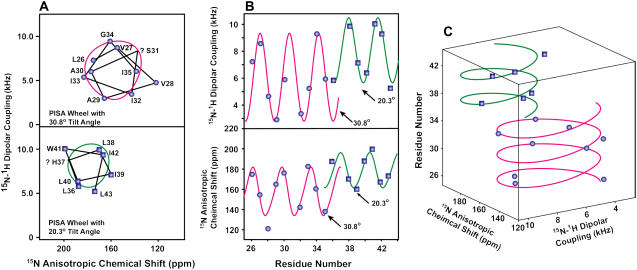
The sequential resonance assignments for the backbone were confirmed by PISEMA spectra of single-site 15N labeled samples (data not shown). Fitting the full PISEMA data set with a single PISA wheel failed due to the wide resonance distribution, but introducing two PISA wheels with 20° and 31° tilt angles agree well with the PISEMA resonances (Fig. 5 A). Dipolar wave (38,39) and chemical shift wave (36) simulations that include the 100° rotation per residue confirm the existence of two tilt angles (Fig. 5 B). These analyses suggest that the M2-TMD/amantadine helix has a small (∼11°) kink that occurs between residues G34 and L36. In addition, the dipolar waves clearly show that there is no change in the phase of the wave at the kink site, so the rotational orientation remains the same with or without the kink.
FIGURE 5.
(A) Two PISA wheels in the M2-TMD PISEMA spectrum. Experimental PISEMA resonances are connected with lines based on resonance assignments. The PISEMA resonances are fitted with two PISA wheels with tilt angles of 20° and 31°. Question marks indicate the missing data points and their hypothetical positions. (B) PISEMA wave simulations of the 15N M2-TMD anisotropic chemical shifts and 15N-1H dipolar couplings. (C) PISA helix fitting of the M2-TMD/amantadine PISEMA data. Two helices are fitted with 20° (green) and 31° (magenta) tilt angles. The curve-fitting χ2 values are 1.65 and 6.86 for the dipolar couplings and the anisotropic chemical shifts, respectively.
In Fig. 5 C, we illustrate another method of fitting the PISEMA data: the PISA helix. The PISA helix is a combination of dipolar wave, chemical shift wave, and PISA wheel simulations presented in a three-dimensional space. For an ideal α-helix, the PISA helix function maps a right-handed helix, resembling its helical origin. Moreover, different tilt angles result in PISA helices with different size and shape, providing another sensitive analysis of PISEMA data.
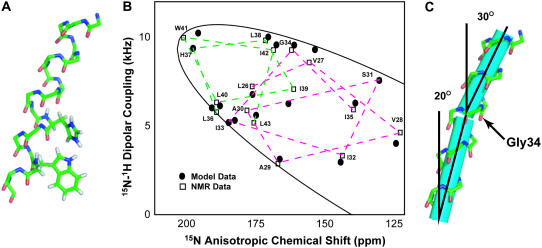
An initial model for the M2-TMD/amantadine monomer was built using two ideal α-helices, which matched the dipolar and chemical shift waves derived from the assigned PISEMA spectra. The structure contained a kink near Gly34 that breaks the α-helical i–(i+4) hydrogen bonding in this region (Fig. 5 B). We energy-minimized this initial model with weighted stereochemical and experimental potentials. The experimental potentials consisted of 15N anisotropic chemical shift and 15N-1H dipolar coupling pairs, which provide orientational constraints (44). The structure and simulated PISEMA data fitting of the resultant M2-TMD/amantadine monomer is shown in Fig. 6.
FIGURE 6.
(A) Backbone stick structure of one M2-TMD subunit with amantadine (amantadine not shown) based on PISEMA data from residues 26–43. Plausible positions of residues His37 and Trp41 side chains constrained by PISEMA side-chain data are also shown, but their positions are not unique. (B) Comparison between experimental PISEMA resonances (open squares) and the simulated PISEMA resonances (solid circles) of the refined M2-TMD/amantadine structure shown in panel A. The solid line is the PISEMA ellipse, which represents the range of possible values within the chemical shift and dipolar tensors. (C) The monomer structure with cylinders along the helical fragment axes emphasizing the 11° kink near Gly34.
M2-TMD/amantadine tetramer model
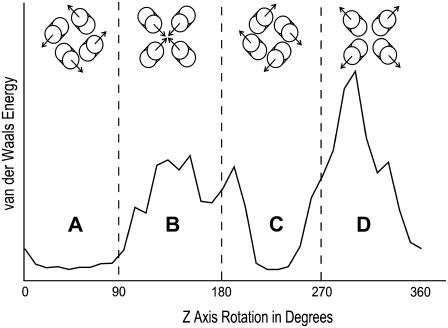
We modeled the M2-TMD/amantadine tetramer as a series of rigid-body transformations of the monomer subunit. Building a homotetramer using a monomer derived from NMR data requires resolving two degrees of freedom: the interhelical distance and the monomer rotation with respect to the bilayer normal. The interhelical distance (helix axis to helix axis at the crossing point of the helices) of the tetramer model was initially taken to be 10 Å, which is typical of four-helix bundles (48) and similar to the structure without amantadine (11). The rotational ambiguity was resolved by sampling symmetric rigid-body rotations of the monomer and recording the helix-helix interaction energy. This conformational search was performed by rotating all subunits of the tetramer in 5° increments, and recording the van der Waals potential energy. The energy profile (Fig. 7) contains two minimal regions, A and C, corresponding to right-handed and left-handed bundles, respectively. In the absence of data to suggest a change in handedness from the ligand-free structure and assuming that hydrophilic residues continue to energetically favor the channel interior, the M2-TMD/amantadine tetramer was chosen to be the left-handed bundle with the minimal van der Waals energy (i.e., from region C). This tetramer was then energy-minimized in the same manner as the monomer.
FIGURE 7.
The energy landscape of the M2TMD homotetramer. Symmetric rigid body monomer rotations were performed about the membrane bilayer normal, here represented as the Z axis. The graph gives a relative measure of helix-helix interaction energy. The figures at the top of each region are representative conformations for the region, with arrows indicating the average tilt direction.
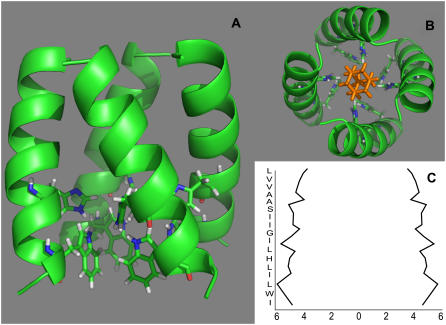
The refined amantadine/M2-TMD complex is shown in Fig. 8. It is a left-handed helical bundle that is radially symmetric about the center of the channel with an average channel width of ∼10 Å. The structure without ligand is similar in these characteristics (11), but the kink in the amantadine-blocked model results in a tightening of the channel near the N-terminus and a widening of the channel near the C- terminus (Fig. 8 C). In Fig. 8 B, we show a top-down view of the refined model along with a reasonable positioning of the blocking amantadine molecule. Our data did not contain information about the amantadine location.
FIGURE 8.
(A) Tetrameric model of M2-TMD backbone atoms with His37 and Trp41 side chains in the presence of amantadine (amantadine not shown). The model exhibits C4 symmetry and reflects a minimal helix-helix interaction of the monomer with a pore diameter of ∼10 Å. The interfacial region is less α-helical, which may be a result of amantadine interactions. (B) A top view of tetrameric complex with a representative radially symmetric positioning of amantadine (shown in orange with amino group pointing away). (C) The channel width between monomer backbone atoms as a function of membrane layer depth shows a widening near the C-terminus (bottom).
DISCUSSION
The data presented in Fig. 2 demonstrate that amantadine binds to M2-TMD in our bilayer preparations both for magic angle spinning and for aligned samples based on the dramatic improvement in linewidth. Furthermore, the binding of amantadine to our preparations strongly suggests that our preparations of M2-TMD form a pore in which amantadine binds. Such a pore is likely to be formed by a tetrameric structure. Although, the MAS spectral resonance intensities are not quantified here for  M2-TMD with bound amantadine, both protonated and deprotonated states are observed (Fig. 2 A, bottom), suggesting a certain level of chemical heterogeneity; yet, there is no evidence for multiple chemical shifts or dipolar couplings among the structural restraints. Indeed, the spectra may suggest considerably less heterogeneity when M2-TMD is bound to amantadine, as compared to the structure without the drug. The broad resonance lines observed in the absence of amantadine may be the result of efficient relaxation due to slow motions, or possibly the result of conformational heterogeneity. Previously, in studies of the full-length protein, “rotational excursions” have been described to account for the complete H/D exchange of the transmembrane helix in planar bilayers (17). While our data does not rule out either prospect, it is clear that the presence of amantadine reduces the structural or sample heterogeneity. In addition, it appears as if the structural stability is enhanced through the binding of amantadine to M2-TMD.
It has been proposed that the amino group of amantadine binds His37 (23), Ser31 (20), or Asp24 (49). If such interactions take place, the lack of multiple resonances for the backbone sites between Leu26 and His37 suggests that the structure is time-averaged—implying that any interacting residues from separate monomers (e.g., four His37, four Ser31, etc.) are involved equally.
The PISEMA data are very sensitive to structural deformations. For example, an orientational change as small as 4° can produce a 20 ppm change in chemical shift or a 2 kHz change in dipolar coupling. The uniformity of our data (e.g., fit to dipolar and chemical shift waves) suggests that, in addition to any improved structural stability of the channel caused by amantadine, the structure is undergoing a time-averaged conformational change that maintains the apparent fourfold symmetry of the structure. The data for His37 and Trp41 side chains indicate that the structural symmetry possibly extends beyond the backbone to the side chains, at least at these high pH values.
The chemical shift and dipolar waves of the structure show a kinked structure with different helical tilts with respect to the magnetic field axis and the bilayer normal. In addition, there is only a minor change in the phase of the waves, indicating that it is a simple kink and not a π-bulge or other more significant break in helical geometry. The characterization of an 11° change in helical tilt with such clarity is a measure of the sensitivity of these orientational restraints to structural deformations. Conversely, the high quality fit of the experimental data in the dipolar and chemical shift waves documents the structural uniformity of the α-helical fragments. It is clear that the structure is a well-defined α-helix with 3.6 ± 0.1 residues per turn between residues 26 and 43 for which we have experimental data.
The kink site of M2-TMD bound with amantadine is in the immediate vicinity of Gly34. Glycines are known to play critical roles in transmembrane helices. Kinks have been associated with glycines in several other transmembrane helices such as Gly99 of KcsA (50). Glycines also are critical in the formation of tightly packed helices that form coiled coil structures such as the glycophorin dimer (51).
The first experimentally determined structure for M2-TMD had helices tilted 38° with respect to the bilayer normal (PDB code 1mp6 (14), PDB code 1nyj (11)). While early reports stated that the helical tilt of M2 was an intrinsic property of the protein and hence independent of the hydrophobic thickness of the bilayer (10), it has recently been shown (52) that hydrophobic thickness can play a significant role in determining helical tilt, particularly for broader ranges of thickness. The binding of a ligand can also influence helical tilt. However, comparative analysis of tilt with and without ligand in the present study is complicated by the presence of amantadine and the use of a different sample preparation protocol in which the aligned film was formed from preformed liposomes rather than a dried film from organic solvents. Preliminary data presented here for five-site leucine 15N labeled sample without amantadine (top, Fig. 2 C) suggests a tilt that is substantially less than 38°, but obtaining a full data set in the absence of amantadine has proved difficult due to broad resonance linewidths. In any event, the tetrameric bundle appears to possess considerable plasticity, so that different environmental conditions or sample history can yield different conformations. This plasticity may play a role in establishing stability, as the various conformations that have been observed are exceptionally well-defined and reproducible.
Acknowledgments
This work was supported by National Institute of Health grants No. PO1-GM064676 and ROI-AI23007 to T.A.C., and the American Heart Association grant No. 0415075B to T.A. and R.B.
References
- 1.Hille, B. 2001. Ionic Channels of Excitable Membranes. Sinauer Associates, Sunderland, MA.
- 2.Morbidity and Mortality Weekly Report. 2006. High levels of adamantane resistance among Influenza A (H3N2) viruses and interim guidelines for use of antiviral agents. United States, 2005–06 Influenza season. Dispatch 55, January 26. [PubMed]
- 3.Wang, C., K. Takeuchi, L. H. Pinto, and R. A. Lamb. 1993. Ion channel activity of influenza A virus M2 protein: characterization of the amantadine block. J. Virol. 67:5585–5594. [DOI] [PMC free article] [PubMed] [Google Scholar]
- 4.Wang, C., R. A. Lamb, and L. H. Pinto. 1994. Direct measurement of the influenza A virus protein ion channel activity in mammalian cells. Virology. 205:133–140. [DOI] [PubMed] [Google Scholar]
- 5.Vijayvergiya, V., R. Wilson, A. Chorak, P. F. Bao, T. A. Cross, and D. D. Busath. 2004. Proton conductance of Influenza virus M2 protein in planar bilayers. Biophys. J. 87:1697–1704. [DOI] [PMC free article] [PubMed] [Google Scholar]
- 6.Duff, K. C., and R. H. Ashley. 1992. The transmembrane domain of influenza A M2 protein forms amantadine-sensitive proton channels in planar lipid bilayers. Virology. 190:485–489. [DOI] [PubMed] [Google Scholar]
- 7.Luo, W., and M. Hong. 2006. Determination of the oligomeric number and intermolecular distances of membrane protein assemblies by anisotropic 1H-driven spin diffusion NMR spectroscopy. J. Am. Chem. Soc. 128:7242–7251. [DOI] [PubMed] [Google Scholar]
- 8.Duff, K. C., S. M. Kelly, N. C. Price, and J. P. Bradshaw. 1992. The secondary structure of influenza A M2 transmembrane domain. A circular dichroism study. FEBS Lett. 311:256–258. [DOI] [PubMed] [Google Scholar]
- 9.Hu, J., R. Fu, K. Nishimura, L. Zhang, H.-X. Zhou, D. D. Busath, V. Vijayvergiya, and T. A. Cross. 2006. Histidines, heart of the hydrogen ion channel from influenza A virus: toward an understanding of conductance and proton selectivity. Proc. Natl. Acad. Sci. USA. 103:6865–6870. [DOI] [PMC free article] [PubMed] [Google Scholar]
- 10.Kovacs, F. A., and T. A. Cross. 1997. Transmembrane four-helix bundle of influenza A M2 protein channel: structural implications from helix tilt and orientation. Biophys. J. 73:2511–2517. [DOI] [PMC free article] [PubMed] [Google Scholar]
- 11.Nishimura, K., S. Kim, L. Zhang, and T. A. Cross. 2002. The closed state of a H+ channel helical bundle combining precise orientational and distance restraints from solid state NMR. Biochemistry. 41:13170–13177. [DOI] [PubMed] [Google Scholar]
- 12.Kass, I., and I. T. Arkin. 2005. How pH opens a H+ channel: the gating mechanism of influenza A M2. Structure. 13:1789–1798. [DOI] [PubMed] [Google Scholar]
- 13.Wu, Y., and G. A. Voth. 2005. A computational study of the closed and open states of the influenza a M2 proton channel. Biophys. J. 89:2402–2411. [DOI] [PMC free article] [PubMed] [Google Scholar]
- 14.Wang, J., S. Kim, F. Kovacs, and T. A. Cross. 2001. Structure of the transmembrane region of the M2 protein H+ channel. Protein Sci. 10:2241–2250. [DOI] [PMC free article] [PubMed] [Google Scholar]
- 15.Tang, Y., F. Zaitseva, R. A. Lamb, and L. H. Pinto. 2002. The gate of the influenza virus M2 proton channel is formed by a single tryptophan residue. J. Biol. Chem. 277:39880–39886. [DOI] [PubMed] [Google Scholar]
- 16.Pinto, L. H., and R. A. Lamb. 1995. Understanding the mechanism of action of the anti-influenza virus drug amantadine. Trends Microbiol. 3:271. [DOI] [PubMed] [Google Scholar]
- 17.Tian, C., P. F. Gao, L. H. Pinto, R. A. Lamb, and T. A. Cross. 2003. Initial structural and dynamic characterization of the M2 protein transmembrane and amphipathic helices in lipid bilayers. Protein Sci. 12:2597–2605. [DOI] [PMC free article] [PubMed] [Google Scholar]
- 18.Hay, A. J. 1992. The action of adamantanamines against influenza A viruses: inhibition of the M2 ion channel protein. Semin. Virol. 3:21–30. [Google Scholar]
- 19.Sugrue, R. J., and A. J. Hay. 1991. Structural characteristics of the M2 protein of influenza A viruses: evidence that it forms a tetrameric channel. Virology. 180:617–624. [DOI] [PMC free article] [PubMed] [Google Scholar]
- 20.Sansom, M. S., and I. D. Kerr. 1993. Influenza virus M2 protein: a molecular modeling study of the ion channel. Protein Eng. 6:65–74. [DOI] [PubMed] [Google Scholar]
- 21.Stouffer, A. L., V. Nanda, J. D. Lear, and W. F. DeGrado. 2005. Sequence determinants of a transmembrane proton channel: an inverse relationship between stability and function. J. Mol. Biol. 347:169–179. [DOI] [PubMed] [Google Scholar]
- 22.Hu, J., R. Fu, K. Nishimura, L. Zhang, H. X. Zhou, D. D. Busath, V. Vijayvergiya, and T. A. Cross. 2006. Histidines, heart of the hydrogen ion channel from influenza A virus: toward an understanding of conductance and proton selectivity. Proc. Natl. Acad. Sci. USA. 103:6865–6870. [DOI] [PMC free article] [PubMed] [Google Scholar]
- 23.Gandhi, C. S., K. Shuck, J. D. Lear, G. R. Dieckmann, W. F. DeGrado, R. A. Lamb, and L. H. Pinto. 1999. CuII inhibition of the proton translocation machinery of the influenza A virus M2 protein. J. Biol. Chem. 274:5474–5482. [DOI] [PubMed] [Google Scholar]
- 24.Astrahan, P., I. Kass, M. A. Cooper, and I. T. Arkin. 2004. A novel method of resistance for influenza against a channel-blocking antiviral drug. Proteins. 55:251–257. [DOI] [PubMed] [Google Scholar]
- 25.Salom, D., B. R. Hill, J. D. Lear, and W. F. DeGrado. 2000. pH-Dependent tetramerization and amantadine binding of the transmembrane helix of M2 from the influenza A virus. Biochemistry. 39:14160–14170. [DOI] [PMC free article] [PubMed] [Google Scholar]
- 26.Hu, J. 2005. Structure-function correlation of the M2 proton channel characterized by solid-state nuclear magnetic resonance spectroscopy. PhD dissertation. Florida State University, Tallahassee.
- 27.Wu, C. H., A. Ramamoorthy, and S. J. Opella. 1994. High-resolution heteronuclear dipolar solid-state NMR spectroscopy. J. Magn. Reson. A. 109:270–272. [Google Scholar]
- 28.Ramamoorthy, A., Y. Wei, and D. Lee. 2004. PISEMA solid state NMR spectroscopy. Annu. Rep. NMR Spectr. 52:1–52. [Google Scholar]
- 29.Koynova, R., and M. Caffrey. 1998. Phases and phase transitions of the phosphatidylcholines. Biochim. Biophys. Acta Rev. Biomembr. 1376:91–145. [DOI] [PubMed] [Google Scholar]
- 30.Engh, R. A., and R. Huber. 1991. Accurate bond and angle parameters for x-ray protein-structure refinement. Acta Crystallogr. A. 47:392–400. [Google Scholar]
- 31.Brender, J. R., D. M. Taylor, and A. Ramamoorthy. 2001. Orientation of amide-nitrogen-15 chemical shift tensors in peptides: a quantum chemical study. J. Am. Chem. Soc. 123:914–923. [DOI] [PubMed] [Google Scholar]
- 32.Poon, A., J. Birn, and A. Ramamoorthy. 2004. How does an amide-15-N chemical shift tensor vary in peptides? J. Phys. Chem. B. 108:16577–16585. [DOI] [PMC free article] [PubMed] [Google Scholar]
- 33.Wang, J., J. Denny, C. Tian, S. Kim, Y. Mo, F. Kovacs, Z. Song, K. Nishimura, Z. Gan, R. Fu, J. R. Quine, and T. A. Cross. 2000. Imaging membrane protein helical wheels. J. Magn. Reson. 144:162–167. [DOI] [PubMed] [Google Scholar]
- 34.Ramamoorthy, A., C. H. Wu, and S. J. Opella. 1997. Magnitudes and orientations of the principal elements of the 1H chemical shift, 1H-15N dipolar coupling and 15N chemical shift interaction tensors in 15Nɛ1-tryptophan and 15Nπ-histidine side chains determined by three-dimensional solid-state NMR spectroscopy of polycrystalline samples. J. Am. Chem. Soc. 119:10479–10486. [Google Scholar]
- 35.Denny, J. K., J. Wang, T. A. Cross, and J. R. Quine. 2001. PISEMA powder patterns and PISA wheels. J. Magn. Reson. 152:217–226. [DOI] [PubMed] [Google Scholar]
- 36.Kovacs, F. A., J. K. Denny, Z. Song, J. R. Quine, and T. A. Cross. 2000. Helix tilt of the M2 transmembrane peptide from influenza A virus: an intrinsic property. J. Mol. Biol. 295:117–125. [DOI] [PubMed] [Google Scholar]
- 37.Marassi, F. M., and S. J. Opella. 2000. A solid-state NMR index of helical membrane protein structure and topology. J. Magn. Reson. 144:150–155. [DOI] [PMC free article] [PubMed] [Google Scholar]
- 38.Mesleh, M. F., and S. J. Opella. 2003. Dipolar waves as NMR maps of helices in proteins. J. Magn. Reson. 163:288–299. [DOI] [PubMed] [Google Scholar]
- 39.Mesleh, M. F., G. Veglia, T. M. DeSilva, F. M. Marassi, and S. J. Opella. 2002. Dipolar waves as NMR maps of protein structure. J. Am. Chem. Soc. 124:4206–4207. [DOI] [PMC free article] [PubMed] [Google Scholar]
- 40.Reference deleted in proof.
- 41.Reference deleted in proof.
- 42.Canutescu, A. A., A. A. Shelenkov, and R. L. Dunbrack. 2003. A graph-theory algorithm for rapid protein side-chain prediction. Protein Sci. 12:2001–2004. [DOI] [PMC free article] [PubMed] [Google Scholar]
- 43.Schweiters, C. D., J. J. Kuszewski, N. Tjandra, and G. M. Clore. 2003. The XPLOR-NIH NMR molecular structure determination package. J. Magn. Reson. 160:65–73. [DOI] [PubMed] [Google Scholar]
- 44.Bertram, R., T. Asbury, F. Fabiola, J. R. Quine, T. A. Cross, and M. S. Chapman. 2003. Atomic refinement of correlated solid-state NMR restraints. J. Magn. Reson. 160:65–73.12565051 [Google Scholar]
- 45.Fabiola, F., R. Bertram, A. Korostelev, and M. S. Chapman. 2002. An improved hydrogen bond potential: impact on medium resolution protein structures. Protein Sci. 11:1415–1423. [DOI] [PMC free article] [PubMed] [Google Scholar]
- 46.Wallin, E., and G. von Heijne. 1998. Genome-wide analysis of integral membrane proteins from eubacterial, archaean and eukaryotic organisms. Protein Sci. 7:1029–1038. [DOI] [PMC free article] [PubMed] [Google Scholar]
- 47.Stevens, T. J., and I. T. Arkin. 2000. Do more complex organisms have a greater proportion of membrane proteins in their genomes? Proteins. 39:417–420. [DOI] [PubMed] [Google Scholar]
- 48.Harris, N. L., S. R. Presnell, and F. E. Cohen. 1994. Four helix bundle diversity in globular proteins. J. Mol. Biol. 236:1356–1368. [DOI] [PubMed] [Google Scholar]
- 49.Howard, K. P., J. D. Lear, and W. F. DeGrado. 2002. Sequence determinants of the energetics of folding of a transmembrane four-helix-bundle protein. Proc. Natl. Acad. Sci. USA. 99:8568–8572. [DOI] [PMC free article] [PubMed] [Google Scholar]
- 50.Doyle, D. A., J. M. Cabral, R. A. Pfuetzner, A. Kuo, J. M. Gulbis, S. L. Cohen, B. T. Chait, and R. MacKinnon. 1998. The structure of the potassium channel: molecular basis of K+ conduction and selectivity. Science. 280:69–77. [DOI] [PubMed] [Google Scholar]
- 51.MacKenzie, K. R., J. H. Prestegard, and D. M. Engelman. 1997. A transmembrane helix dimer: structure and implications. Science. 276:131–133. [DOI] [PubMed] [Google Scholar]
- 52.Duong-Ly, K. C., V. Nanda, W. F. DeGrado, and K. P. Howard. 2005. The conformation of the pore region of the M2 proton channel depends on lipid bilayer environment. Protein Sci. 14:856–861. [DOI] [PMC free article] [PubMed] [Google Scholar]


