

Abstract
Parkinson's disease (PD) is associated with a loss of central dopaminergic pathways in the brain leading to an abnormality of movement, including saccades. In PD, analysis of saccadic latency distributions, rather than mean latencies, can provide much more information about how the neural decision process that precedes movement is affected by disease or medication. Subject to the constraints of intersubject variation and reproducibility, latency distribution may represent an attractive potential biomarker of PD. Here we report two studies that provide information about these parameters, and demonstrate a novel effect of dopamine on saccadic latency, implying that it influences the neural decision process itself. We performed a detailed cross-sectional study of saccadic latency distributions during a simple step task in 22 medicated patients and 27 age-matched controls. This revealed high intersubject variability and an overlap of PD and control distributions. A second study was undertaken on a different population specifically to investigate the effects of dopamine on saccadic latency distributions in 15 PD patients. l-dopa was found to prolong latency, although the magnitude of the effect varied between subjects. The implications of these observations for the use of saccadic latency distributions as a potential biomarker of PD are discussed, as are the effects of l-dopa on neural decision making, where it is postulated to increase the criterion level of evidence required before the decision to move is made.
Keywords: Parkinson's disease, Saccade, Latency, Biomarker, l-dopa
Introduction
Parkinson's disease (PD) is common, affecting approximately 2% of the population over the age of 70, and causing an abnormality of movement, including saccades. Great efforts are being made to develop neuroprotective treatments (Stocchi and Olanow 2003), but it is increasingly recognised as a heterogeneous disease that can be difficult to diagnose (Hughes et al. 1992; Lewis et al. 2005). Thus accurate biomarkers of the disease would be extremely useful—ideally they should be reproducible, be able to separate disease and control populations, and track disease progression—but no single biomarker will be able to do it all, and therefore a range of approaches is necessary (discussed in Michell et al. 2004). Of course, an ideal biomarker should be more than a surrogate marker, and should provide us with new information about how the brain functions in disease.
Saccadic eye movements have quite frequently been investigated as a potential biomarker of PD since they have a highly reproducible trajectory (Roy-Byrne et al. 1995), and there is evidence that they might be affected by cognitive decline, depression or other aspects of the disease (Leigh and Kennard 2004; Mosimann et al. 2005; Briand et al. 1999; Hikosaka et al. 2000). However, these studies are not easy to compare given the different target populations (early or advanced disease, medication effects), testing paradigms used (gap or overlap of stimuli, ‘reflexive’ or ‘voluntary’ task) and parameters of the saccade measured (velocity, amplitude, duration, errors).
The current investigation consisted of two parts: a cross-sectional study comparing a heterogeneous population with PD to controls, and an ‘on/off’ l-dopa study conducted on a separate group of patients. From the biomarker perspective our aim was to investigate the intersubject variability in the latency distributions, and to assess the effect of l-dopa on these measures and their reproducibility. Our second aim was to use data from the ‘on/off’ study to help understand the effects of dopamine on the brain's decision process that precedes movement (Foltynie et al. 2005). In this respect it is important to note that the model of decision making used here to interpret our observations is not limited to saccadic latency, but appears to be applicable across modalities (for example, auditory or manual reaction time) and species, and thus to motor control in general—which is clearly abnormal in PD (Carpenter 1999).
This study differs from those published to date in that we systematically analyse unusually large latency distributions rather than use a single statistic such as mean and variance. This distributional analysis then allows one to focus on the largely cortical factors that influence the neural decision to move, as opposed to those parameters (velocity and amplitude) of the movement itself, which are very stereotyped and essentially determined in the brainstem (Carpenter 2000). The shape of the distribution of saccadic latencies can best be represented on a reciprobit plot (see Methods), which allows interpretation with reference to a quantitative model of the decision process that precedes movement (Carpenter 1981; Reddi et al. 2003). Consequently, the measurement of latency distributions (rather than mean latency) has appeal not only as a biomarker (possibly of the failing motor decision mechanism or dementia), but also as a tool with which to study the brain's decision process and the influence of drugs upon this. Thus this study was not so much designed to develop a diagnostic biomarker of PD, as to begin characterising latency distributions in PD as a potential biomarker, and to determine the effects of l-dopa on the decision process.
Thus the main differences in the approach we have adopted in these studies is that we have first of all analysed latency distribution, using an explicit model of the underlying decision process. Secondly, the use of a newly developed miniaturised saccadometer enabled us to collect particularly large sets of data, which are necessary when distributions are analysed because of the great intrinsic variability of latency. Thirdly, because saccadic velocity and duration are highly reproducible, determined in the brainstem (low in the hierarchy of motor control, away from any decision process), and have been studied many times before, they were not recorded here. Finally, in order to hasten the collection of data, we used a relatively simple task: saccades are often conceptually divided into ‘reflexive’ or ‘voluntary’ categories depending on the complexity of task required to generate them (Leigh and Kennard 2004), and in these terms our simple step task would be considered ‘reflexive’. However, the task requires a decision (albeit perhaps subconscious) of when to move and in which direction to go, and this prolongs reaction time from about 70 ms (the shortest reflex arc via the superior colliculus) to nearer 200 ms. It is this procrastination, or decision, that we have investigated. While it is acknowledged that more complex ‘voluntary’ saccades (for example, antisaccades or memory-guided saccades) may permit a better separation of PD and control groups, such paradigms were not chosen here in the interests of speed and simplicity.
Our findings are discussed under two headings. Firstly, the intersubject variability, ability to separate PD and control groups, reproducibility and effect of medication that have important implications for the use of saccadic latency distributions as biomarkers of disease. Secondly, and perhaps most interestingly, the effects of l-dopa on reaction time and the decision process with reference to current concepts of the role of dopamine on neural function.
Methods
Subjects
Patients and controls were recruited from the PD research clinic at the Cambridge Centre for Brain Repair. All patients fulfilled UK Brain Bank criteria for the diagnosis of idiopathic PD (with a single subject not meeting one minor criterion) (Gibb and Lees 1988) and were followed up in a specialist setting that has been shown in other studies to provide a positive predictive value for the clinical diagnosis of over 98% (Hughes et al. 2002). The study was approved by the Local Regional Ethics Committee, and all subjects gave their consent after written and verbal explanation of the procedure, according to the Declaration of Helsinki.
The study involved three groups of subjects (Table 1): 22 PD patients were recruited from the PD research clinic, forming a heterogeneous group taking a wide range of anti-Parkinsonian medications (the ‘PD cross-sectional’ group)—there were no exclusions on cognitive or affective grounds (MMSE range 18–30, BDI range 1–24). A further 15 patients on standard (not slow release) l-dopa monotherapy were selected to participate in the on/off study (Tables 1 and 2); and finally 27 subjects (friend or relatives accompanying patients) with no known neurological disease provided an age-matched control population.
Table 1.
Demographics and clinical characteristics of the 64 subjects studied in the three separate groups
| Group | n (gender) | Age (year) | DD (year) | BDI | MMSE | Motor UPDRS | H&Y | PD meds |
|---|---|---|---|---|---|---|---|---|
| On/off l-dopa | 15 (4f, 11m) | 68.0±9.0 | 4.3±2.3 | 6.6±6.9 | 29.2±0.9 | On: 17.3±8.3 Off: 44.3±13.8 |
On: 1.9±0.3 Off: 2.5±0.4 |
l-dopa only |
| Controls | 27 (13f, 14m) | 68.0±9.3 | NA | NA | NA | NA | NA | None |
| PD x-section | 22 (16f, 6m) | 69.6±6.4 | 5.8±4.3 | 8.2±6.2 | 28.6±2.7 | 18.7±9.1 | 1.6±0.6 | Varied |
Values presented are means ± SD
NA not available; DD disease duration; n number of subjects in the group; BDI Beck depression inventory; MMSE mini-mental state examination; Motor UPDRS motor subsection of the unified Parkinson's disease rating scale; H&Y Hoehn and Yahr rating scale
Table 2.
Details of the PD patients completing the ‘on/off’ l-dopa study
| Patient characteristics |
ON L-dopa |
OFF L-dopa |
|||||||||
|---|---|---|---|---|---|---|---|---|---|---|---|
| Code | Age | Gender | DD (years) |
L-dopa daily (mg) |
Other meds. | Date | H&Y | Motor UPDRS |
Date | H&Y | Motor UPDRS |
| 1 | 71 | f | 9 | 600 | 22.7.3 | 2 | 15.5 | 14.8.3 | 3 | 52 | |
| 2 | 52 | m | 6 | 1,000 | 14.8.3 | 2 | 17 | 5.8.3 | 3 | 76 | |
| 3 | 66 | m | 2 | 300 | 23.11.3 | 2 | 34 | 12.8.3 | 2 | 54 | |
| 4 | 71 | m | 5 | 600 | 14.7.4 | 1 | 10 | 21.7.4 | 2 | 27 | |
| 5 | 56 | m | 3 | 200 | 29.7.4 | 2 | 7 | 20.7.4 | 2.5 | 33 | |
| 6 | 71 | f | 4 | 850 | Citalopram | 14.8.3 | 2 | 31 | 22.7.3 | 2.5 | 35 |
| 7 | 66 | m | 4 | 600 | 5.8.3 | 2 | 12.5 | 22.7.3 | 2.5 | 42 | |
| 8 | 76 | m | 3 | 300 | 29.7.4 | 2 | 29 | 20.7.4 | 3 | 48 | |
| 9 | 68 | m | 8 | 600 | Amitryptiline | 29.7.4 | 2 | 15 | 20.7.4 | 2.5 | 41 |
| 10 | 77 | m | 2 | 500 | 27.6.4 | 2 | 8 | 6.7.4 | 2.5 | 28 | |
| 11 | 52 | f | 2 | 800 | Paroxetine | 5.11.3 | 2 | 9.5 | 5.8.3 | 2.5 | 39 |
| 12 | 63 | f | 6 | 150 | 12.8.3 | 2 | 17 | 23.11.3 | NA | NA | |
| 13 | 80 | m | 3 | 300 | 5.8.3 | 2 | 22 | 14.8.3 | 2 | 40 | |
| 14 | 73 | m | 6 | 1,200 | 28.8.3 | 2 | 15 | 23.11.3 | 3 | 65 | |
| 15 | 79 | m | 2 | 300 | 27.6.4 | 2 | 17 | 6.7.4 | 2.5 | 40 | |
Saccade recording equipment
A newly developed head-mounted saccadometer (Ober Consulting, Poznan) was used to present the targets and measure eye movements by changes in the binocular infra-red scleral reflectance (Ober et al. 2003). High contrast red target dots were generated from three low-powered lasers that form part of the recording unit. Subjects sat 1.5 m in front of a blank wall, on to which the lasers projected at angles 10° left, 0° or 10° right of centre: to a first approximation these angles are independent of the distance from the subject to the wall. The saccadometer had sensor and output sampling rates of 8 and 1 kHz, respectively, output signal resolution 12 bit, 7% nonlinearity for ±30° range, bandwidth 500 kHz, and a noise level between 0.2 and 0.3°. It sits on the bridge of the nose and is held in place by an elastic strap round the head. The device is comfortable and requires no particular skill to set up; because the display moves in synchrony with the head, stabilisation of the head is not necessary. It allows 300 saccadic latencies to be recorded within 15 min, and is automatically calibrated using a small number of preliminary trials.
The latency data was downloaded onto a laptop running LatencyMeter 2.3 (Ober et al. 2003) that allowed results from abnormal eye movements to be deleted: saccades in the wrong direction, of abnormal profile, falling outside the amplitude range 5–15°, or outside the latency range 50–600 ms (arbitrary limits chosen to include express or other early saccades but exclude saccades with prolonged latency due to inattention).
Procedures
Subjects were asked to track the movement of the red laser dot as rapidly as they could. The tracking involved a step task paradigm with no gap or overlap of stimuli: after a random foreperiod (0.5–1 s) the central fixation target was extinguished as either the left or right target, chosen at random, were turned on, and remained on until a saccade had been performed or for a maximum of 2 s. On 11 out of 79 testing sessions, the number of saccades recorded was less than 300 because of subject fatigue or for technical reasons. Of these 11 cases, over 200 saccades were recorded in eight of the sessions, and over 100 in the remaining three (one from the control group and two from the PD cross-sectional group).
The 15 subjects in the on/off study group were assessed on two separate occasions; once in the morning after taking their normal morning dose of l-dopa (‘on’), and on a separate morning after at least 12 h abstinence (‘off’). Patients were randomised to be tested ‘on’ before ‘off’ l-dopa or vice-versa (Table 2), and were assessed on each occasion, including the UPDRS (Fahn et al. 1987) and Hoehn and Yahr (Hoehn and Yahr 1967) scores. One subject missed their clinical assessment off medication because of time constraints. Catechol-O-methyl-transferase (COMT) val158met and brain derived neurotrophic factor (BDNF) val66met polymorphisms were also analysed, given their recently described effects on some frontostriatal tasks in early PD (Foltynie et al. 2004b, 2005).
Reciprobit plots of saccadic latency
Saccadic latency, unlike velocity or duration, appears to be controlled at the cortical level, and is highly and randomly variable from trial to trial. However, despite this the distribution of latencies follows a well-defined law: its reciprocal follows a Gaussian distribution (Carpenter 1981). Therefore plotting cumulative latency distributions on a probit scale as a function of reciprocal latency (a ‘reciprobit plot’) yields a straight line (as it would for any such Gaussian distribution), although a small number of early saccades are sometimes seen, which lie on a separate distribution (Carpenter and Williams 1995). An example is provided in Fig. 1: in this case actual latency (not reciprocal) is plotted on a reciprocal axis (analogous to the more commonly used logarithmic axis. Note that for calculations and correlations the reciprocal latency was used—see, for example, Fig. 3 and Table 3). This shape of distribution of saccadic latencies is missed if relatively few saccades are recorded or if conventional lumped statistical analysis is used. Importantly, the quantitative parameters of the distribution are directly related to the fundamental parameters of the LATER model (linear approach to threshold with ergodic rate) of decision making.
Fig. 1.

Saccadic latency distribution plotted on reciprobit axes. An example cumulative frequency plot of saccadic latencies is shown, using a probit scale as a function of reciprocal latency: a reciprobit plot. When saccadic latencies are plotted in this way, most points lie on line a, intercepting the infinite latency axis at an intercept I. In some cases, as here, there may be an additional sub-population of early saccades, which tend to lie on a distinct line b, which passes through the point (inf,50). A change in expectation or urgency causes swivel about the point I, generating a new line of best fit such as the dashed line c (see text and Reddi et al. 2003). Three parameters (median latency, main slope, and slope of the early component) are sufficient to characterise the entire distribution
Fig. 3.

The intersubject variability in saccadic latency is high in all groups. a Mean ± SEM error bars. There is a significant difference between the control and ‘PD on’ groups (t=2.20, df=40, P=0.03), and between the ‘PD on’ and ‘PD off’ groups (t =−2.15, df=14, P=0.05). b Latencies of each subject are plotted individually to demonstrate the intersubject variability
Table 3.
Comparison of the distribution of saccadic latencies described by the reciprocal median latency (Rec. median, sec−1), main slope and early slope of each distribution (see Fig. 1)
| On vs off l-dopa (n=15) | |||
|---|---|---|---|
| Statistics | Mean±SEM |
Student's paired t test | |
| On | Off | ||
| Rec. median | 4.01±0.19 | 4.29±0.28 | t=−2.15, df=14, P=0.05* |
| Main slope | 1.15±0.09 | 1.10±0.09 | t=0.90, df=14, P=0.38 |
| Early slope | 0.22±0.01 | 0.20±0.01 | t=1.77, df=14, P=0.10 |
| Control vs PD x-section (n=27 C, 22 PD) | |||
|---|---|---|---|
| Statistics | Mean±SEM |
Student's unpaired t test | |
| Control | PD | ||
| Rec. median | 4.68±0.20 | 4.55±0.24 | t=0.42, df=47, P=0.68 |
| Main slope | 1.02±0.07 | 1.18±0.10 | t=−1.31, df=47, P=0.20 |
| Early slope | 0.22±0.01 | 0.25±0.04 | t=−0.76, df=47, P=0.45 |
LATER provides an attractive, testable hypothesis of the decision process that encompasses both the variation seen in saccadic latency distributions and single cell neurophysiological data (recent discussions include Reddi et al. 2003, Reddi and Carpenter 2000). For example, there are cells within the frontal eye fields of the monkey whose firing rate exhibits rise-to-threshold behaviour in advance of a saccade, and whose rate of rise corresponds closely with saccadic latency (Hanes and Schall 1996).
In terms of decision making the LATER model essentially collects information at a certain rate until there is enough belief in a hypothesis to achieve a threshold criterion level and trigger a response—in this case a saccade (for a discussion, see Reddi et al. 2003). Over the last decade it has been possible to test the theory by altering the prior probability (Carpenter and Williams 1995) information supply (Reddi et al. 2003) and decision criterion level (Reddi and Carpenter 2000) with predictable effects on the distribution of saccadic latencies, and so far the model has held true. Of particular interest to this study it appears that an increase in the threshold criterion level required before a decision is made results in an anticlockwise swivel of the distribution (Fig. 1, line of best fit swivels from a to c) (Reddi and Carpenter 2000), whereas a change in the rate of information supply causes a parallel shift rather than a swivel of the distribution (Reddi et al. 2003).
Statistics
Saccadic latencies were analysed using SPIC software (Carpenter 1994) after removal of erroneous eye movements. A cumulative reciprobit frequency histogram of saccadic latencies was plotted for each testing session (Carpenter 1988), and separate trendlines fitted by the computer through the main population of saccades and the smaller group of early saccades by minimising the Kolmogorov–Smirnov statistic. For each subject the reciprocal median saccadic latency and the slope of the two trendlines were recorded. These three parameters were Gaussian distributed in the population, assessed by the Kolmogorov–Smirnov test, and thus their means were taken to compare groups (Table 3). Controls were compared to the PD cross-section group with an unpaired two-tailed Student’s t test, and the ‘on’ was compared to the ‘off’ l-dopa group with a paired two-tailed Student's t test.
The difference in distributions of saccadic latencies ‘on’ and ‘off’ L-dopa was analysed using a Kolmogorov–Smirnov test for each individual, using reciprocal median latency as its distribution is Gaussian, whereas that of latency is highly skewed. The effect of l-dopa on the reciprobit distributions ‘on’ and ‘off’ l-dopa was assessed using log likelihood comparison: pairs of distributions under the two conditions were jointly fitted, using a maximum likelihood method, with the alternative constraints of parallel shift, or of swivel of the distribution about a common intercept with the t= ∞ axis. A log likelihood measure of support for the alternative hypotheses of shift versus swivel was thus obtained for each patient, and summed across all patients to provide an overall measure of support for one rather than the other, differences of more than 3 log units being equivalent to a conventional significance criterion of P=0.05. Pearson's product moment correlation coeYcient with two-tailed P value was used to assess the relationship between saccadic and clinical parameters.
Results
All subjects tolerated the new saccadometer extremely well, and example reciprobit plots drawn after the removal of erroneous eye movements are shown in Fig. 2. The data tend to lie along a straight line with a variable early component, as described previously [Fig. 1 and (Carpenter and Williams 1995)], although the median latencies, slope of the main distribution and number and slope of early saccades is very variable between different subjects irrespective of disease status. The ‘on/off’ study revealed that the shape of the distribution of latencies was very similar in the two testing sessions, although l-dopa caused a swivel of the distribution in some patients (discussed below).
Fig. 2.

a Three example reciprobit plots from patients ‘on’ (blue circle) versus ‘off’ (red square) L-dopa. Note that the shape of the distribution of saccadic latencies is reproducible and tends to swivel anticlockwise on l-dopa (see also Fig. 1). The magnitude of the effect varies between subjects. b Three example reciprobit plots from control subjects. There is intersubject variability in median latency and the shape of the distribution varies between subjects. Note that small differences in the tails of reciprobit plots have highly visible effects on their shape despite representing a small proportion of the saccades (P, PD patient codes refer to Table 2; C control)
The three parameters that describe the distribution of saccadic latencies in the different groups are presented in Table 3. A significant difference was found in the reciprocal of the median latencies between subjects ‘on’ and ‘off’ l-dopa, but no other parameters were significantly different between groups (the early slope is only a small proportion of the total saccades).
Intersubject variation: the cross-sectional study
The variation in saccadic latency between subjects was found to be high in all groups, as shown by the broad spread of reciprocal median latencies in Fig. 3. A statistically significant difference was found between the 27 controls and the 15 PD patients tested ‘on’ medication (t=2.20, df=40, P=0.03), but this was lost when they were ‘off’ medication. Furthermore, no significant difference was seen between the control group and the 22 PD patients comprising the cross-sectional group. These latter patients form a more heterogeneous group than the patients tested on and off medication; they used a wider variety of anti-Parkinsonian medication, the time between medication and testing was more varied, and some subjects had more advanced disease than the ‘on/off’ group. As has been reported previously, a correlation was seen between age and reciprocal median latency (older PD patients and controls have slower reaction times: r=−0.35, P = 0.01), but no such correlation existed with other patient characteristics such as disease duration, mini mental state examination or gender.
Intrasubject variation: the ‘on/off’ l-dopa study
A statistically significant difference was found in the reciprocal median saccadic latencies between the 15 subjects tested ‘on’ and ‘off’ l-dopa, with medication tending to prolong latency (t=−2.15, df=14, P=0.05, Fig. 3). In contrast there was, as expected, a very significant improvement in motor UPDRS (t= −7.2, df=13, P<0.001) and Hoehn and Yahr scores (t=−6.5, df=13, P<0.001) in the ‘on’ compared to ‘off’ state as shown in Table 1. When analysed individually, the effect of l-dopa on saccadic latencies was found to be predominantly due to five of the patients showing a statistically significant difference in their distribution of saccadic latencies on and off medication (Fig. 4). The three patients using antidepressants (Table 2, patients 6, 9, and 11) were not outliers on Fig. 4. COMT val158met and BDNF val66met polymorphisms did not correlate with the effect of l-dopa on saccadic latencies although the sample size is small. Furthermore, we found no correlation between the effect of l-dopa on reciprocal median saccadic latencies (‘on’ minus ‘off’ l-dopa) and either the dose of l-dopa (r= −0.15, P=0.59) or disease severity as assessed by the motor UPDRS ‘on’ score (r=−0.23, P=0.4). In addition, there was no correlation between the l-dopa induced change in reciprocal median latency (on/off) and the change in UPDRS (r=0.23 P=0.40). A correlation was seen though between the ‘on’ reciprocal median latency and ‘on’ motor UPDRS but this was lost ‘off’ treatment (‘on’: r=−0.55, P=0.03, Fig. 5; ‘off’: r= −0.21, P=0.48).
Fig. 4.
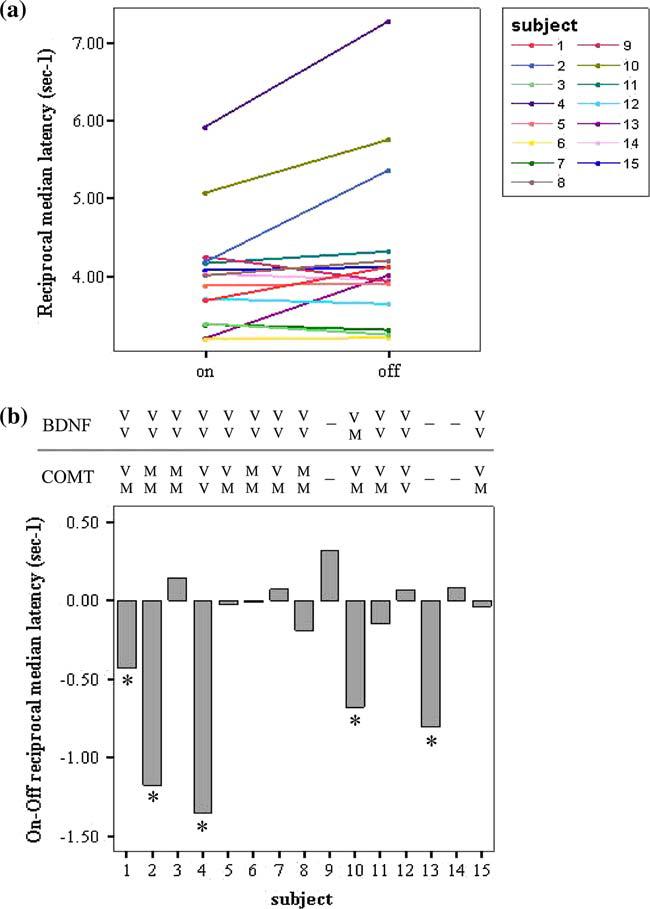
The effect of l-dopa on saccadic latency distributions: it tends to slow reaction time. a There is a significant difference in reciprocal median saccadic latencies on versus off l-dopa (P=0.05), although it varies between subjects (P1–P15, see Table 2). b The Kolmogorov–Smirnov test showed that subjects 1, 2, 4, 10 and 13 had significantly different median saccadic latencies on and off l-dopa (P<0.05). The COMT Val158Met and BDNF Val66Met polymorphism genotype is shown for each subject: V valine; M methionine; a dash indicates that no sample was available. (A full colour version of this figure is available online at http://www.dx.doi.org/10.1007/s00221-006-0412-z
Fig. 5.

When tested on medication the reciprocal median saccadic latency correlated with the patients' UPDRS motor subsection score (regression line fitted, r=−0.55, P=0.03)
The number of discarded trials was compared in the ‘on’ and ‘off’ state in order to study error responses, although both human and mechanical factors contributed to trials being discarded (see Methods). The percentage of discarded trials was not significantly different ‘on’ and ‘off’ l-dopa (mean ± SD% discarded trials ‘on’=28.8±14; ‘off’=32.7±15, P=0.25). The percentage of discarded trials ‘on’ medication did not correlate to ‘on’ reciprocal median latency (r=−0.42, P=0.12) or dose of l-dopa (r=0.01, P=0.97), but did correlate to the percentage of discarded trials ‘off’ l-dopa (r=0.64, P=0.01).
Likelihood analysis was performed to determine whether the significant slowing effect of l-dopa acted to cause a parallel shift of the distribution of saccadic latencies or cause the distribution to swivel about the infinity axis intercept on a reciprobit plot (see Fig. 1). The group combined log likelihood for ‘swivel’ versus ‘shift’ was 11.2, confirming with a very high degree of certainty that l-dopa causes anticlockwise swivel of the distributions (Fig. 2 and Table 4).
Table 4.
Log likelihoods of l-dopa causing a swivel versus a shift in saccadic latency distributions (see Fig. 1)
| Subject no. | Log likelihood swivel vs shift |
|---|---|
| P1 | 1.9 |
| P2 | 1.3 |
| P3 | 0.5 |
| P4 | −2.2 |
| P5 | 0 |
| P6 | −0.3 |
| P7 | 0.2 |
| P8 | −1.1 |
| P9 | 1.5 |
| P10 | 6.8 |
| P11 | −0.2 |
| P12 | 0.1 |
| P13 | 2 |
| P14 | 0.2 |
| P15 | 0.5 |
| Sum | 11.2 |
The sum of 11.2 strongly suggests that l-dopa causes a swivel of the distribution of saccadic latencies about the infinity intercept rather than a parallel shift (a high number favours swivel)
Discussion
The main finding of this study is that the distribution of saccadic latencies can be significantly affected by l-dopa, which tends to slow reaction time, with important implications for the role of dopamine in the neural decision process. Furthermore, in conjunction with the great intersubject variability of saccadic latency that we observed, this finding has important implications for the use of the technique as a biomarker of PD.
Saccadic latency distributions as a biomarker of PD: intersubject variation and reproducibility
Although in some circumstances we found saccadic latency to be prolonged in PD, this was not uniformly the case (Fig. 3), although it is broadly in agreement with the majority of manual reaction time data in PD [reviewed by Gauntlett-Gilbert and Brown 1998]. Published data on saccadic latency in PD is rather unclear, with results tending to be task-specific: ‘reflexive’ saccadic latencies tend to be unchanged or shorter in PD, whereas ‘voluntary’ saccadic latencies tend to be prolonged [reviewed in (Briand et al. 1999)].
Given the intersubject variability and degree of overlap of saccadic latency distributions from PD patients and controls it is clear that as it currently stands this technique could not be used as a diagnostic biomarker of PD—a conclusion compatible with other recent studies involving nondemented PD patients, although these were analysed differently (Mosimann et al. 2005). Nevertheless, saccadic latency does seem to correspond to severity of disease (Fig. 5) and the presence of dementia (Mosimann et al. 2005), suggesting that it might prove to be a useful marker of disease progression—perhaps in particular of cognitive decline. Clearly this requires investigation in longitudinal studies, but recently simple reaction and movement times have shown promise as biomarkers by detecting changes in motor performance over time in patients undergoing embryonic nigral cell transplantation, and correlating with UPDRS ‘off’ scores at 4 and 12 months of post-transplantation (Gordon et al. 2004).
Many factors will affect intersubject variation (dementia, concentration, medication, and so on), some of which are recorded in Table 1; however, each of these parameters requires separate investigation. With this in mind we chose to focus specifically on the effect of l-dopa, and found that it significantly affected reproducibility (discussed below). From a biomarker perspective such effects need further investigation, and tend to reduce the power of the marker depending on the magnitude of drug effect compared, for example, to disease progression. Given the heterogeneity of PD it is likely that we will require different biomarkers to track the development of different cognitive, motor or pathological parameters as they progress at different rates over time. Since ‘reflexive’ saccadic latency seems to be most prolonged by a combination of cortical and subcortical pathology rather than either in isolation (Mosimann et al. 2005), one might speculate that analysis of saccadic latency distributions will turn out to be a particularly sensitive biomarker of the onset and progression of cognitive defects and dementia within a PD population (Foltynie et al. 2004a), and might enable the disease progression to be described according to the LATER decision model.
The effect of l-dopa on latency distributions
Our observation that l-dopa prolongs saccadic latency is rather surprising given the documented clinical improvement, the observation that manual reaction time is generally shortened by dopaminergic stimulation (Gauntlett-Gilbert and Brown 1998), and our own observation that latency tends to be prolonged in advanced disease (Fig. 5). However, the reduction in dopamine is one of a number of features of disease progression which could affect latency. The ‘on/off’ study was designed to mitigate interference from factors such as dementia, allowing us to specifically investigate the effect of l-dopa, whilst acknowledging that further study of other variables will be required to fully characterise intersubject variation.
Interestingly, the numerous studies of manual reaction time in PD suggest that the effect of l-dopa depends on the basal reaction time—if this is slow, the addition of l-dopa has a greater beneficial effect (Gauntlett-Gilbert and Brown 1998; Robbins and Brown 1990). It has been suggested that as the supply of dopamine becomes limited it affects fast reaction times first, then as the levels fall further slower reaction times become affected (Robbins and Brown 1990). It is possible that in our study the l-dopa taken by patients with relatively mild PD may overdose some dopaminergic networks in the brain, exceeding an optimal threshold and resulting in poorer performance (see below).
There are relatively few published studies specifically addressing the effect of dopamine on saccadic reaction times, and a number of methodological concerns hinders their interpretation: the use of different testing procedures, failure to counterbalance ‘on’ and ‘off’ order of testing, different medication and withdrawal regimes, and so on (reviewed critically by Harrison et al. 1995). Some studies show no effect of dopaminergic drugs (Gibson and Kennard 1987; Crevits et al. 2000), whereas others report broadly beneficial effects on latency, gain or amplitude of saccades (Gibson et al. 1987; Rascol et al. 1989; Vermersch et al. 1994). None have reported the detrimental effect on saccadic latency we describe here, but there is evidence to suggest that in some circumstances dopamine might have an adverse effect on manual and saccadic reaction times. It has recently been reported that a simple manual reaction time task is delayed in PD patients as a result of subcutaneous apomorphine injection, a D1 and D2 receptor agonist (Muller et al. 2002), and similarly apomorphine has been reported to impair the reaction time in certain strains of rats (Wilcox and Spirduso 1988). Amphetamine causes dopamine release and reuptake inhibition, and has been found to prolong saccadic latencies in humans (Dursun et al. 1999), whereas haloperidol, a dopamine antagonist with mild anticholinergic action, has been found not to affect saccades (Lynch et al. 1997).
The elegance of analysing saccadic latencies using reciprobit plots is that as well as providing more information than is encapsulated in a single parameter such as median or mean, they allow us to directly test the parameters of the LATER model of neural decision making (Carpenter 1981). In this case the observed anticlockwise swivel of the distributions caused by l-dopa suggests that this medication acts to increase the threshold criterion required before making a decision. In other words, it implies that l-dopa tends to render a subject less impulsive such that they require a higher degree of certainty before making a decision. Given this it might be expected that subjects should make fewer saccadic errors ‘on’ l-dopa. The analysis of discarded trials did not show a signiWcant difference as a result of medication; however, since such errors were more often the result of mechanical displacement of the saccadometer than poor subject performance this may not be surprising.
The site of action of dopamine
The ultimate brain region influenced by l-dopa in this instance is not known, but an appealing candidate is the frontal eye fields, where the firing rate of single neurons in the monkey show rise-to-threshold behaviour in advance of a saccade that correspond closely with LATER's decision signal (Hanes and Schall 1996). Furthermore, in primates, D2 receptor activation can modulate the activity of prefrontal neurons to memory-guided saccades (Wang et al. 2004). However, neurons encoding a decision signal, with a rise in firing frequency preceding movement, are widely distributed in the brain and may be the result of integration of signals routed through positive feedback loops via the basal ganglia or thalamus (Romo and Schultz 1987; Romo and Schultz 1992). Neurophysiological evidence of a decision signal has also been found, for example, in the dorsolateral prefrontal cortex (Kim and Shadlen 1999), posterior pariental cortex (Shadlen and Newsome 1996) and superior colliculus (Horwitz et al. 2004; McCoy and Platt 2005; Schall 1999). It is therefore not clear that it makes much sense to talk about the ‘site’ of a decision process, when decisions appear rather to be the result of a distributed network of neurons covering a wide area of the brain. Furthermore, dopamine has a well-described central sedative effect (Micallef-Roll et al. 2001) as well as a peripheral effect on the retina (Djamgoz et al. 1997), but we would not expect to see the same swivel in latency distributions if these effects constituted its primary mode of action here.
Since the 1980s it has been appreciated that dopamine can worsen some cognitive functions whilst improving others (Gotham et al. 1988), and there is evidence for a number of frontostriatal circuits that can be differentially affected by dopamine. In particular, it seems that tests of neuropsychological function relating to the dorsolateral prefrontal cortex improve with dopamine, whereas ventrolateral and orbitofrontal functions deteriorate (Cools et al. 2001, 2003; Swainson et al. 2000). Here, however, although there are cells within the frontal eye fields that seem to represent a saccadic decision, this area (Brodmann area 8) is closest to the dorsal stream (Brodmann areas 9, 46), and the slowing of saccadic latencies in response to l-dopa is unlikely to be explained by this hypothesis.
However, the relationship between prefrontal and nigrostriatal dopamine levels is complex such that in early PD the midbrain dopamine deficiency is accompanied by a more generalised prefrontal excess of dopamine. Thus the administration of L-dopa may ‘overdose’ this area to the extent that performance on cognitive tasks relating to this region deteriorates—in an inverted U-shaped “Yerkes-Dodson” manner (Williams and Goldman-Rakic 1995; Foltynie et al. 2004b). Rather than the dorsal-ventral differential effect of dopamine described above this theory proposes a cortical–subcortical division, and therefore might explain the deterioration in function of the frontal eye Welds (and therefore prolonged saccadic latencies) in response to excess dopamine. In particular, polymorphisms in both COMT and BDNF genes have been associated with variable prefrontal function in different people, an observation explained in terms of their effect on basal dopamine levels (Foltynie et al. 2004b, 2005; Meyer-Lindenberg et al. 2005). In this study, however, there was no association between COMT or BDNF genotypes and the effect of l-dopa on saccadic latencies, although larger numbers of patients are required to fully address this issue.
Finally, it is possible that the effect of dopamine might not be explained by either of the above hypotheses, and may instead relate to deterioration in function not of the frontal eye fields, but of the parietal eye fields. Indeed a recent review has highlighted the predominant role of the parietal eye field in ‘reflexive’ saccades, and the frontal eye fields in ‘voluntary’ saccades (Leigh and Kennard 2004). In particular, parietal eye field lesions in humans cause increased latency of visually triggered saccades, which does not seem to occur after frontal eye field lesions (Pierrot-Deseilligny et al. 1991; Braun et al. 1992). Furthermore, lesion of the parieto-collicular tract can cause isolated impairment of reflexive but not memory-guided saccades (Gaymard et al. 2003). As discussed above, single cell recordings are compatible with decision units in this region (Shadlen and Newsome 1996). Thus, the exact site of action of l-dopa in the control of saccadic eye movements is not clear at present, and requires further research. Intriguingly, it might be that excess dopamine is detrimental to parietal as well as frontal lobe function. However, it should be stressed that the division of saccades into ‘reflexive’ and ‘voluntary’ is not absolute—the task we used is neither a purely reflexive task (requiring identical responses across all trials) nor truly voluntary such as memory-guided saccades or antisaccades.
It is clear that dopamine can have diverse effects on different functions of the brain that may or may not be anatomically distinct. An increased level following l-dopa administration can, under certain circumstances, improve performance on some tasks (bradykinesia, simple manual reaction time, neuropsychological function relating to the dorsolateral prefrontal cortex), but worsen others (neuropsychological function relating to the ventrolateral prefrontal cortex, saccadic latency as described here). The effect on reaction times seems to be dependent on the testing paradigm (simple ‘reflexive’ reaction time versus ‘voluntary’ or choice reaction time), and the dopaminergic tone, which in turn depends on the severity of PD, the dose of replacement therapy and the timing of subsequent testing. A dissociation between voluntary saccadic latency and manual reaction time has already been shown in the monkey following local depletion of dopamine in the caudate nucleus, albeit with prolongation of saccadic latency in this case (Kori et al. 1995). Careful analysis of saccadic latencies and manual reaction times in humans in response to different testing paradigms will shed further light on the relationship between these variables and the role of dopamine in the decision process.
In summary two primary conclusions can be made from this study. Firstly, saccadic latency distributions show great intersubject variability and are therefore unable to provide much help in PD diagnosis. However, longitudinal studies looking at intrasubject variation (reproducibility) over time compared to the effect of medication are required to determine whether the technique might ultimately turn out to be a useful biomarker of disease progression. Secondly, we have shown that l-dopa affects the distribution of saccadic latencies, and propose that this occurs because it increases the threshold criterion level of evidence required before a decision to move is made. The site of this effect and the decision process is not currently known, and may be diffuse, involving interaction of a number of cortical and subcortical regions of the brain.
Acknowledgements
These studies have been funded by an MRC COGG grant into PD and its heterogeneity, and the BCNC. AWM holds a PDS studentship, and a Raymond and Beverly Sackler Award. We thank Dr A.Blackwell for helpful discussion.
References
- Braun D, Weber H, Mergner T, Schulte-Monting J. Saccadic reaction times in patients with frontal and parietal lesions. Brain. 1992;115(Pt 5):1359–1386. doi: 10.1093/brain/115.5.1359. [DOI] [PubMed] [Google Scholar]
- Briand KA, Strallow D, Hening W, Poizner H, Sereno AB. Control of voluntary and reflexive saccades in Parkinson's disease. Exp Brain Res. 1999;129:38–48. doi: 10.1007/s002210050934. [DOI] [PubMed] [Google Scholar]
- Carpenter RHS. Oculomotor procrastination. In: Fisher DF, Monty RA, Senders JW, editors. Eye movements: cognition and visual perception. New Jersey: Lawrence Erlbaum; 1981. pp. 237–246. [Google Scholar]
- Carpenter RHS. Movements of the eyes. London: Pion; 1988. [Google Scholar]
- Carpenter RHS. SPIC: a PC-based system for rapid measurement of saccadic responses. J Physiol (Proceedings) 1994;480:4P. [Google Scholar]
- Carpenter RHS. A neural mechanism that randomises behaviour. Journal of Consciousness Studies. 1999;6(1):13–22. [Google Scholar]
- Carpenter RHS. The neural control of looking. Curr Biol. 2000;10:R291–R293. doi: 10.1016/s0960-9822(00)00430-9. [DOI] [PubMed] [Google Scholar]
- Carpenter RHS, Williams ML. Neural computation of log likelihood in control of saccadic eye movements. Nature. 1995;377:59–62. doi: 10.1038/377059a0. [DOI] [PubMed] [Google Scholar]
- Cools R, Barker RA, Sahakian BJ, Robbins TW. Enhanced or impaired cognitive function in Parkinson's disease as a function of dopaminergic medication and task demands. Cereb Cortex. 2001;11:1136–1143. doi: 10.1093/cercor/11.12.1136. [DOI] [PubMed] [Google Scholar]
- Cools R, Barker RA, Sahakian BJ, Robbins TW. L-Dopa medication remediates cognitive inflexibility, but increases impulsivity in patients with Parkinson's disease. Neuropsychologia. 2003;41:1431–1441. doi: 10.1016/s0028-3932(03)00117-9. [DOI] [PubMed] [Google Scholar]
- Crevits L, Versijpt J, Hanse M, De Ridder K. Antisaccadic effects of a dopamine agonist as add-on therapy in advanced Parkinson's patients. Neuropsychobiology. 2000;42:202–206. doi: 10.1159/000026694. [DOI] [PubMed] [Google Scholar]
- Djamgoz MB, Hankins MW, Hirano J, Archer SN. Neurobiology of retinal dopamine in relation to degenerative states of the tissue. Vision Res. 1997;37:3509–3529. doi: 10.1016/S0042-6989(97)00129-6. [DOI] [PubMed] [Google Scholar]
- Dursun SM, Wright N, Reveley MA. Effects of amphetamine on saccadic eye movements in man: possible relevance to schizophrenia? J Psychopharmacol. 1999;13:245–247. doi: 10.1177/026988119901300306. [DOI] [PubMed] [Google Scholar]
- Fahn S, Elton RL, and committee . Unified Parkinson's disease rating scale. In: Fahn S, Marsden CD, Caine D, Goldstein M, editors. Recent developments in Parkinson's disease. Florham Park, NJ: McMillan; 1987. committee. [Google Scholar]
- Foltynie T, Brayne CE, Robbins TW, Barker RA. The cognitive ability of an incident cohort of Parkinson's patients in the UK. The CamPaIGN study. Brain. 2004a;127:550–560. doi: 10.1093/brain/awh067. [DOI] [PubMed] [Google Scholar]
- Foltynie T, Goldberg TE, Lewis SG, Blackwell AD, Kolachana BS, Weinberger DR, Robbins TW, Barker RA. Planning ability in Parkinson's disease is influenced by the COMT val158met polymorphism. Mov Disord. 2004b;19:885–891. doi: 10.1002/mds.20118. [DOI] [PubMed] [Google Scholar]
- Foltynie T, Lewis SG, Goldberg TE, Blackwell AD, Kolachana BS, Weinberger DR, Robbins TW, Barker RA. The BDNF Val(66)Met polymorphism has a gender speciWc influence on planning ability in Parkinson's disease. J Neurol. 2005 doi: 10.1007/s00415-005-0756-5. [DOI] [PubMed] [Google Scholar]
- Gauntlett-Gilbert J, Brown VJ. Reaction time deficits and Parkinson's disease. Neurosci Biobehav Rev. 1998;22:865–881. doi: 10.1016/s0149-7634(98)00014-1. [DOI] [PubMed] [Google Scholar]
- Gaymard B, Lynch J, Ploner CJ, Condy C, Rivaud-Pechoux S. The parieto-collicular pathway: anatomical location and contribution to saccade generation. Eur J Neurosci. 2003;17:1518–1526. doi: 10.1046/j.1460-9568.2003.02570.x. [DOI] [PubMed] [Google Scholar]
- Gibb WR, Lees AJ. The relevance of the Lewy body to the pathogenesis of idiopathic Parkinson's disease. J Neurol Neurosurg Psychiatry. 1988;51:745–752. doi: 10.1136/jnnp.51.6.745. [DOI] [PMC free article] [PubMed] [Google Scholar]
- Gibson JM, Kennard C. Quantitative study of “on-off” fluctuations in the ocular motor system in Parkinson's disease. Adv Neurol. 1987;45:329–333. [PubMed] [Google Scholar]
- Gibson JM, Pimlott R, Kennard C. Ocular motor and manual tracking in Parkinson's disease and the effect of treatment. J Neurol Neurosurg Psychiatry. 1987;50:853–860. doi: 10.1136/jnnp.50.7.853. [DOI] [PMC free article] [PubMed] [Google Scholar]
- Gordon PH, Yu Q, Qualls C, Winfield H, Dillon S, Greene PE, Fahn S, Breeze RE, Freed CR, Pullman SL. Reaction time and movement time after embryonic cell implantation in Parkinson disease. Arch Neurol. 2004;61:858–861. doi: 10.1001/archneur.61.6.858. [DOI] [PubMed] [Google Scholar]
- Gotham AM, Brown RG, Marsden CD. ‘Frontal’ cognitive function in patients with Parkinson's disease ‘on’ and ‘off’ levodopa. Brain. 1988;111(Pt 2):299–321. doi: 10.1093/brain/111.2.299. [DOI] [PubMed] [Google Scholar]
- Hanes DP, Schall JD. Neural control of voluntary movement initiation. Science. 1996;274:427–430. doi: 10.1126/science.274.5286.427. [DOI] [PubMed] [Google Scholar]
- Harrison J, Henderson L, Kennard C. Abnormal refractoriness in patients with Parkinson's disease after brief withdrawal of levodopa treatment. J Neurol Neurosurg Psychiatry. 1995;59:499–506. doi: 10.1136/jnnp.59.5.499. [DOI] [PMC free article] [PubMed] [Google Scholar]
- Hikosaka O, Takikawa Y, Kawagoe R. Role of the basal ganglia in the control of purposive saccadic eye movements. Physiol Rev. 2000;80:953–978. doi: 10.1152/physrev.2000.80.3.953. [DOI] [PubMed] [Google Scholar]
- Hoehn MM, Yahr MD. Parkinsonism: onset, progression and mortality. Neurology. 1967;17:427–442. doi: 10.1212/wnl.17.5.427. [DOI] [PubMed] [Google Scholar]
- Horwitz GD, Batista AP, Newsome WT. Representation of an abstract perceptual decision in macaque superior colliculus. J Neurophysiol. 2004;91:2281–2296. doi: 10.1152/jn.00872.2003. [DOI] [PubMed] [Google Scholar]
- Hughes AJ, Ben Shlomo Y, Daniel SE, Lees AJ. What features improve the accuracy of clinical diagnosis in Parkinson's disease: a clinicopathologic study. Neurology. 1992;42:1142–1146. doi: 10.1212/wnl.42.6.1142. [DOI] [PubMed] [Google Scholar]
- Hughes AJ, Daniel SE, Ben Shlomo Y, Lees AJ. The accuracy of diagnosis of parkinsonian syndromes in a specialist movement disorder service. Brain. 2002;125:861–870. doi: 10.1093/brain/awf080. [DOI] [PubMed] [Google Scholar]
- Kim JN, Shadlen MN. Neural correlates of a decision in the dorsolateral prefrontal cortex of the macaque. Nat Neurosci. 1999;2:176–185. doi: 10.1038/5739. [DOI] [PubMed] [Google Scholar]
- Kori A, Miyashita N, Kato M, Hikosaka O, Usui S, Matsumura M. Eye movements in monkeys with local dopamine depletion in the caudate nucleus. II. Deficits in voluntary saccades. J Neurosci. 1995;15:928–941. doi: 10.1523/JNEUROSCI.15-01-00928.1995. [DOI] [PMC free article] [PubMed] [Google Scholar]
- Leigh RJ, Kennard C. Using saccades as a research tool in the clinical neurosciences. Brain. 2004;127:460–477. doi: 10.1093/brain/awh035. [DOI] [PubMed] [Google Scholar]
- Lewis SJ, Foltynie T, Blackwell AD, Robbins TW, Owen AM, Barker RA. Heterogeneity of Parkinson's disease in the early clinical stages using a data driven approach. J Neurol Neurosurg Psychiatry. 2005;76:343–348. doi: 10.1136/jnnp.2003.033530. [DOI] [PMC free article] [PubMed] [Google Scholar]
- Lynch G, King DJ, Green JF, Byth W, Wilson-Davis K. The effects of haloperidol on visual search, eye movements and psychomotor performance. Psychopharmacology (Berl) 1997;133:233–239. doi: 10.1007/s002130050396. [DOI] [PubMed] [Google Scholar]
- McCoy AN, Platt ML. Expectations and outcomes: decisionmaking in the primate brain. J Comp Physiol A Neuroethol Sens Neural Behav Physiol. 2005;191:201–211. doi: 10.1007/s00359-004-0565-9. [DOI] [PubMed] [Google Scholar]
- Meyer-Lindenberg A, Kohn PD, Kolachana B, Kippenhan S, McInerney-Leo A, Nussbaum R, Weinberger DR, Berman KF. Midbrain dopamine and prefrontal function in humans: interaction and modulation by COMT genotype. Nat Neurosci. 2005;8:594–596. doi: 10.1038/nn1438. [DOI] [PubMed] [Google Scholar]
- Micallef-Roll J, Rihet P, Hasbroucq T, Possamai C, Blin O. Levodopa-induced drowsiness in healthy volunteers: results of a choice reaction time test combined with a subjective evaluation of sedation. Clin Neuropharmacol. 2001;24:91–94. doi: 10.1097/00002826-200103000-00004. [DOI] [PubMed] [Google Scholar]
- Michell AW, Lewis SJ, Foltynie T, Barker RA. Biomarkers and Parkinson's disease. Brain. 2004;127:1693–1705. doi: 10.1093/brain/awh198. [DOI] [PubMed] [Google Scholar]
- Mosimann UP, Muri RM, Burn DJ, Felblinger J, O'Brien JT, McKeith IG. Saccadic eye movement changes in Parkinson's disease dementia and dementia with Lewy bodies. Brain. 2005;128:1267–1276. doi: 10.1093/brain/awh484. [DOI] [PubMed] [Google Scholar]
- Muller T, Benz S, Przuntek H. Apomorphine delays simple reaction time in Parkinsonian patients. Parkinsonism Relat Disord. 2002;8:357–360. doi: 10.1016/s1353-8020(01)00046-3. [DOI] [PubMed] [Google Scholar]
- Ober JK, Przedpelska-Ober E, Gryncewicz W, Dylak J, Carpenter RS, Ober JJ. Hand-held system for ambulatory measurement of saccadic durations of neurological patients. In: Gadja J, editor. Modelling and Measurement in Medicine. PAN, Warsaw: Komitet Biocybernityki i Inzyneierii Biomedycznej; 2003. pp. 187–198. [Google Scholar]
- Pierrot-Deseilligny C, Rivaud S, Gaymard B, Agid Y. Cortical control of reflexive visually-guided saccades. Brain. 1991;114(Pt 3):1473–1485. doi: 10.1093/brain/114.3.1473. [DOI] [PubMed] [Google Scholar]
- Rascol O, Clanet M, Montastruc JL, Simonetta M, Soulier-Esteve MJ, Doyon B, Rascol A. Abnormal ocular movements in Parkinson's disease. Evidence for involvement of dopaminergic systems. Brain. 1989;112(Pt 5):1193–1214. doi: 10.1093/brain/112.5.1193. [DOI] [PubMed] [Google Scholar]
- Reddi BA, Carpenter RH. The influence of urgency on decision time. Nat Neurosci. 2000;3:827–830. doi: 10.1038/77739. [DOI] [PubMed] [Google Scholar]
- Reddi BA, Asrress KN, Carpenter RH. Accuracy, information, and response time in a saccadic decision task. J Neurophysiol. 2003;90:3538–3546. doi: 10.1152/jn.00689.2002. [DOI] [PubMed] [Google Scholar]
- Robbins TW, Brown VJ. The role of the striatum in the mental chronometry of action: a theoretical review. Reviews in the Neurosciences. 1990;2:181–213. doi: 10.1515/REVNEURO.1990.2.4.181. [DOI] [PubMed] [Google Scholar]
- Romo R, Schultz W. Neuronal activity preceding self-initiated or externally timed arm movements in area 6 of monkey cortex. Exp Brain Res. 1987;67:656–662. doi: 10.1007/BF00247297. [DOI] [PubMed] [Google Scholar]
- Romo R, Schultz W. Role of primate basal ganglia and frontal cortex in the internal generation of movements. III. Neuronal activity in the supplementary motor area. Exp Brain Res. 1992;91:396–407. doi: 10.1007/BF00227836. [DOI] [PubMed] [Google Scholar]
- Roy-Byrne P, Radant A, Wingerson D, Cowley DS. Human oculomotor function: reliability and diurnal variation. Biol Psychiatry. 1995;38:92–97. doi: 10.1016/0006-3223(94)00225-R. [DOI] [PubMed] [Google Scholar]
- Schall JD. Weighing the evidence: how the brain makes a decision. Nat Neurosci. 1999;2:108–109. doi: 10.1038/5663. [DOI] [PubMed] [Google Scholar]
- Shadlen MN, Newsome WT. Motion perception: seeing and deciding. Proc Natl Acad Sci U S A. 1996;93:628–633. doi: 10.1073/pnas.93.2.628. [DOI] [PMC free article] [PubMed] [Google Scholar]
- Stocchi F, Olanow CW. Neuroprotection in Parkinson's disease: clinical trials. Ann Neurol. 2003;53(Suppl 3):S87–S97. doi: 10.1002/ana.10488. [DOI] [PubMed] [Google Scholar]
- Swainson R, Rogers RD, Sahakian BJ, Summers BA, Polkey CE, Robbins TW. Probabilistic learning and reversal deficits in patients with Parkinson's disease or frontal or temporal lobe lesions: possible adverse effects of dopaminergic medication. Neuropsychologia. 2000;38:596–612. doi: 10.1016/s0028-3932(99)00103-7. [DOI] [PubMed] [Google Scholar]
- Vermersch AI, Rivaud S, Vidailhet M, Bonnet AM, Gaymard B, Agid Y, Pierrot-Deseilligny C. Sequences of memory-guided saccades in Parkinson's disease. Ann Neurol. 1994;35:487–490. doi: 10.1002/ana.410350419. [DOI] [PubMed] [Google Scholar]
- Wang M, Vijayraghavan S, Goldman-Rakic PS. Selective D2 receptor actions on the functional circuitry of working memory. Science. 2004;303:853–856. doi: 10.1126/science.1091162. [DOI] [PubMed] [Google Scholar]
- Wilcox RE, Spirduso WW. Apomorphine doses impair the reaction time of fast reacting but not slow reacting rats. Psychopharmacology (Berl) 1988;95:276–279. doi: 10.1007/BF00174524. [DOI] [PubMed] [Google Scholar]
- Williams GV, Goldman-Rakic PS. Modulation of memory fields by dopamine D1 receptors in prefrontal cortex. Nature. 1995;376:572–575. doi: 10.1038/376572a0. [DOI] [PubMed] [Google Scholar]