Abstract
We compare, by calculations on a simple model of glycolysis, the evolutionary development of oscillatory reaction mechanisms in the presence and absence of external periodic events, such as an oscillatory or constant influx of glucose in an open reaction system. The chosen model has autonomous oscillations for given choices of the parameters of the feedback loops responsible for the oscillations, and for a given range of the total adenylate pool concentration. We change first one, then two of the parameters, so that there are no autonomous oscillations, and then vary these parameters with a genetic algorithm method in which the parameters are represented by binary strings that evolve by selection, crossover, and mutations; the optimization goal is the attainment of a high ATP/ADP concentration ratio in the system. This goal is taken to provide evolutionary advantages and is shown to be achieved more quickly in the presence of external periodic events, rather than constant influx of glucose. The results suggest the possibility of the enhanced evolutionary development of oscillatory biological reactions at shores where waves impinge on rocks and bring nutrients periodically. Measurements have shown that animals and plants grow more rapidly in the presence of such wave action than in its absence.
An interesting report appeared in 1987 (1) that showed that the impact of water waves in intertidal zones enhances the biological growth of intertidal organisms. The authors offer four possible reasons: (i) “waves aid in protecting intertidal inhabitants from their principal enemies”; (ii) “waves strip away the boundary layer of used water from kelp blades, thus facilitating nutrient uptake”; (iii) “waves apparently enhance algal productivity by allowing algae to use light more efficiently”; and (iv) “waves enable some of the shore's more productive inhabitants to displace their competitors.” Furthermore, they add, “in general, intertidal zones of the northeastern Pacific are more completely covered by plants and animals the more exposed they are to wave action.”
In this article, we propose a possible additional reason: in unicellular and higher organisms, there exist oscillatory reactions, far from equilibrium (e.g., glycolysis under certain conditions including constant influx of glucose; refs. 2 and 3), in which concentrations of metabolites vary in nonlinear oscillations with a given period. External periodic perturbations of such reactions in concentration, temperature, pressure, light intensity, or imposed electric fields can phase shift the oscillatory rate compared to the oscillatory Gibbs free energy change, with consequent changes in the dissipation and conversely in the efficiency of the reaction (4–8). Similar phase shifts occur in alternating current (AC) networks, where the analog of the rate is the current, and that of the Gibbs free energy change is proportional to the voltage. These effects of an “AC chemistry” have been shown in experiments on the oscillatory horseradish peroxidase reaction by external periodic variation of the oxygen influx concentration into the system (9, 10), in photosynthesis in a C3 plant (11, 12), and in theoretical studies in proton transfer (7, 13) and combustion reactions (14, 15). In calculations on a model of glycolysis (5, 6), with a constant input of glucose, it was shown that the ratio of the concentrations ATP/ADP is substantially increased after a transition from steady state kinetics to oscillatory kinetics, with that ratio averaged over a full oscillation. A variation of dissipation, both increases and decreases, with the frequency of an external perturbation on an oscillatory reaction within entrainment bands was reported in ref. 17. We are considering time scales of the order of minutes, not circadian time scales.
The combination of our prior experience on autonomous and externally
periodically perturbed oscillatory reaction and this stimulating report
(1) has led us to consider the
possibility that oscillatory reactions in biological systems may have evolved
in response to periodic perturbations of water waves impacting on a shore. We
investigate this conjecture by considering a simple system, a part of the
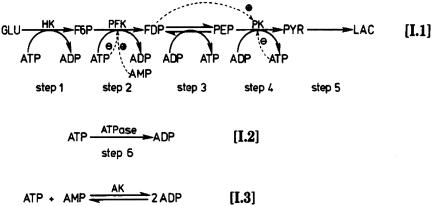
reaction mechanism of glycolysis shown in
Fig. 1, and employ a genetic
algorithm (GA) that is analogous of the processes of selection, crossovers
(recombinations), and mutations in the gene pool that occur during the
evolution of a biological population. The values of the enzymatic binding
constants and rate constants are abbreviated EBR. In the EBR, there are four
dissociation constants for ligands bound to the R and T
conformations
( )
for phosphofructokinase (PFKase) and pyruvate kinase (PKase), respectively,
and in turn we define two ratios of
 and
and
 as variables, for which autonomous oscillations occur at constant influx of
glucose (Table 1, and for
details on rate constants, see ref.
5).
Fig. 1.
A simple model of the reaction mechanism of glycolysis (see more details in
ref. 5). In the EBR, there are
four dissociation constants for ligands bound to the R and T
conformations
( )
for PFKase (step 2) and PKase (step 4), respectively.
Table 1. Values of parameters in glycolysis model.
| Parameter | Experimental value | GA one variable | pmax | GA two variable | pmax |
|---|---|---|---|---|---|
 |
0.417 | 0.25-0.45 | 0.8 | 0.25-0.45 | 0.8 |
 |
0.0215 | 0.075 | — | 0.053-0.954 | 0.8 |
| Adenylate pool concentration, mM | 40.95 | 41.3 | 41.3 |
The values of the enzymatic binding constants at autonomous oscillations
for constant influx of glucose are given in the first column (see ref.
5; note that the negative signs
in equations 7 and 8 of ref 5
need to be replaced by a positive sign). We define two ratios of binding
constants as variables:
 for the second reaction (step 2) in Fig.
1, and
 for the fourth reaction (step 4). Variable ranges in the GA are given for
one-variable and two-variable cases. The maximum change of the parameter
pmax (see Results of Computations) is determined
in such way that the middle values of variables are in the vicinity of the
bifurcation. At the initial values of α1 and
α2 for both one-variable and two-variable GA cases, this
model has a single stationary state. We set the adenylate pool concentration
to be 41.3 mM for our study.
We start the GA procedure by choosing an influx of glucose and the adenylate pool concentration (the sum of the concentrations of AMP, ADP, and ATP) such that this reaction mechanism has single stable stationary state (in Table 1, the initial value of α1 by the GA is the first number given in the second column and the initial value of α1, α2 is the first number in the fourth column). We then compare the evolutionary development of two types of such systems, one with a constant influx of glucose and the other with an oscillatory influx of glucose, to model the periodic effect of waves impinging on an organism. We allow a given initial choice of the EBR to vary by small random increments from one generation to the next, first for one variable and then for two, and carry out this variation systematically by means of a numerical GA method.
For prior applications of the GA to problems in chemical kinetics see refs. 18 and 19. For our study, we wish to optimize the ratio ATP/ADP, and assume that this ratio is a correlative measure of the rate of growth of an organism. The questions to be asked then are: (i) what is the relative development in time with the GA-controlled variation of the EBR of the two types of systems, one with constant influx of glucose, the other with an oscillatory influx of glucose, with average influx the same as in the constant influx case? (ii) How will the ATP/ADP ratio produced by the GA variation of the EBR compare in the two types of systems? (iii) What are the changes as we go from one to two variables? (iv) What bearings do the answers to these questions have on the issue of the evolutionary development of biological oscillatory reactions and the observations reported in ref. 1?
GA Calculations
The GA works with encoding a parameter of the EBR into a binary string. The algorithm evolves parameter sets by the operations of selection, crossover and mutations into the strings from one generation to the next. A variable p has a simple form, pin·(1 + pmax·R/(216 – 1)), where pin is the initial value of p, pmax gives the maximum change of the parameter not per generation but overall, and R is initially set to be zero; then a binary string corresponding to R is evolved within the range 0 ≤ R ≤ 216 – 1 by the GA operations. In the GA, we assign strings for 24 individuals for the variables in the EBR, searching from the initial stable stationary state to autonomous oscillation. We set the maximum change of each variable per generation within ±7%. For more details of description of GAs, see refs. 18 and 19.
Results of Computations
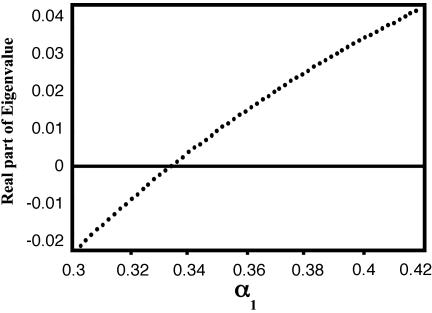
One Variable. We consider the ratio α1 as a variable and choose the adenylate pool to be constant at 41.3 mM; α2 is set to be constant at 0.075. The stationary states of the kinetic equations for this system (see ref. 5) yield the bifurcation diagram shown in Fig. 2, which is a plot of the real part of the temporal eigenvalues of the linearized kinetic equations vs. the parameter α1. For α1 < 0.334, the real part is negative, and the stationary states are stable foci or nodes. For α1 > 0.334, the stationary states are unstable foci and evolve to a stable limit cycle with a period of 0.505 min in the vicinity of the bifurcation.
Fig. 2.
Bifurcation diagram for the adenylate pool at 41.3 with α2 = 0.075. The real part of the temporal eigenvalues of the linearized kinetic equations is plotted vs. the parameter α1. The bifurcation occurs after α1 = 0.334.
In the application of the GA we compare two different systems; one has a
constant influx of glucose (the flow, Vconst = 2 mM/min)
and the other has a sinusoidal oscillatory influx of glucose with the same
average flux as that of the constant influx, i.e.,
Vosl = Vconst +
a·sin[(2π/T)t], where a is the
amplitude and T is the period of the oscillation. For each system, we
select 24 copies (individuals) of the system, each with an initial value of
the parameter α1 = 0.25, such that no oscillations occur. We
set pmax to be 0.8, such that the middle value of
α1 (0.35) (see Table
1) is in the vicinity of the bifurcation. In each new generation,
the binary strings of α1 are evolved by the GA operators
within a range such that the new highest value of the parameter in any one
generation does not differ by more than 7% from the prior generation. The
kinetic equations (see equations 1–16 and 21 in ref.
5) are then solved for each of
the 24 individuals and from these solutions we record the state attained for
each individual, either stationary or oscillatory. We define the ratio of the
ATP/ADP in units of its initial value. For the stationary case, the ratio is
(ATP/ADP)stat/(ATP/ADP)α1=0.25, where
(ATP/ADP)stat is the ratio of ATP/ADP in a stationary
state and (ATP/ADP)α1=0.25 is the ratio of the initial
stationary state at α1 = 0.25. For the oscillatory case, the
ratio is
 ,
where
  is time
averaged over one period of the oscillation. In each generation and in each
group of 24, we select the system with the highest ATP/ADP ratio and pass that
individual to the next generation; we change the worst performer to equal the
best performer, and we alter the remaining individuals by mutations and
recombinations prior to passing them on to the next generation. As the number
of generations increases, the individuals attain higher values of the
parameter α1 up to and beyond the bifurcation.
In the oscillatory influx of glucose, we drive the initially stable focus with a given period (frequency) and amplitude of the imposed sinusoidal glucose oscillation (a = 0.5 mM/min). Before the bifurcation, the system is either a stable node or stable focus and responds to the imposed periodic influx of glucose with the same period as that of the influx. After the bifurcation, the period of the response may differ from the period of the autonomous oscillation. Considering the period as a parameter, we observe that if this period is less than the period of the autonomous oscillation (0.5 min) in the vicinity of the bifurcation, the value of the ATP/ADP ratio can be maximized before the bifurcation; for instance, if the driving period is set to be 0.43 min, the value of the ATP/ADP ratio is (locally) maximized before the bifurcation. After the bifurcation, the value of the ATP/ADP ratio decreases with the fixed external period. This decrease is caused by the existence of a narrow entrainment band of the frequency in response to the external oscillatory influx. However, if the fixed external period after the bifurcation is outside the entrainment band (see ref. 17), then the value of the ATP/ADP ratio is decreased.
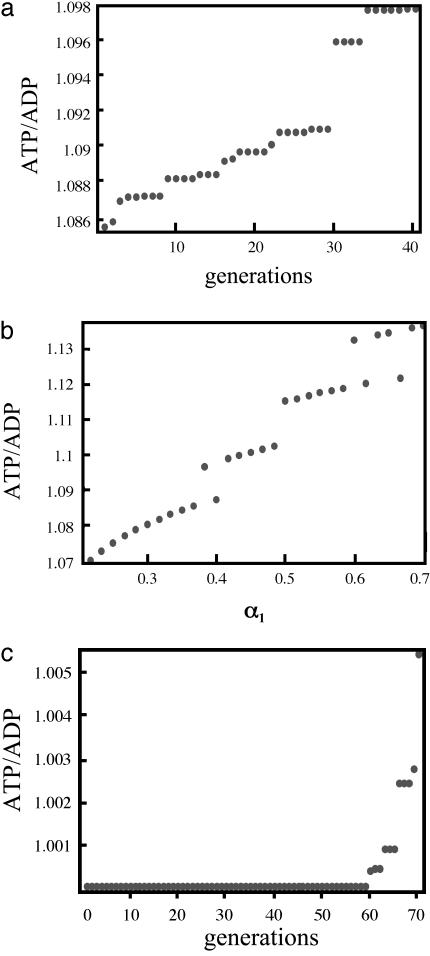
The result for the one-variable case is shown in Fig. 3a for an oscillatory influx of glucose. The point at the 30th generation is at the bifurcation. In Fig. 3b, the ratio of the ATP/ADP as a function of α1 (deterministic) is plotted, and the plot shows bistable behavior after the bifurcation (α1 > 0.334). Note the increase in the ATP/ADP ratio.
Fig. 3.
Plot of the ATP/ADP ratio (see definition under One Variable in Results of Computations) vs. the number of generations in the GA (a), α1 for the oscillatory influx of glucose with the amplitude 0.5 mM/min (deterministic case) (b), and the number of generations for the constant influx of glucose (c). In a and c, the highest value of the ATP/ADP ratio among 24 individuals at each generation by the GA is plotted and shows that systems with the constant influx of glucose take about double the generations necessary to reach the autonomous oscillation than for systems with the oscillatory influx of glucose.
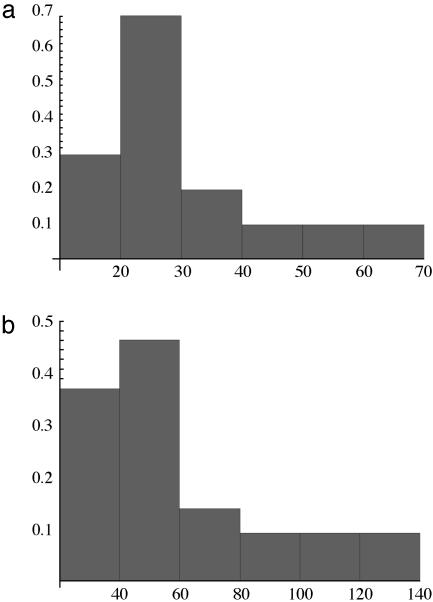
An analogous plot for a constant input of glucose is given in Fig. 3c in which the bifurcation is reached at the 60th generation; the value of ATP/ADP ratio does not change before the bifurcation and a very small increase in ATP/ADP ratio occurs just at the bifurcation. The kinetic equations we solve are deterministic, but stochastic elements are introduced in the GA. Hence, individuals in a given group arrive at the bifurcation after different numbers of generations. Thus, we generate a frequency distribution for the arrival at the bifurcation as a function of the generation number. This frequency density for an individual reaching the bifurcation differs for the oscillatory input, Fig. 4a, compared to the constant input of glucose, Fig. 4b. The most probable value of the generation reaching the bifurcation is 30 for the oscillatory input and substantially larger, 59, for the constant input.
Fig. 4.
The frequency density vs. number of generations to reach the bifurcation. Shown are the oscillatory influx (average 30) (a) and the constant influx (average 59) (b).
Two Variables. Now we choose α1 and
α2 as variables. We set both
pmax to be 0.8, such that the middle value of
α1 (0.35) and α2 (0.074) is in the vicinity
of the bifurcation. We select 24 individuals of the system with initial values
of the parameters α1 = 0.25 and α2 = 0.053,
where the system has no oscillations, and impose a constant influx of glucose.
In each generation, the binary strings of α1 and
α2 evolve by means of the GA operators within a range such
that the new highest value of the parameter does not differ by >7% from
that of the prior generation. We define again the ratio of the ATP/ADP in
units of its initial value. For the stationary case, the ratio is
(ATP/ADP)stat/(ATP/ADP)α1=0.25,α2=0.053.
For the oscillatory case, the ratio is
 ,
where (ATP/ADP)α1=0.25,α2=0.053 is the ratio of the
initial stationary state at α1 = 0.25 and α2
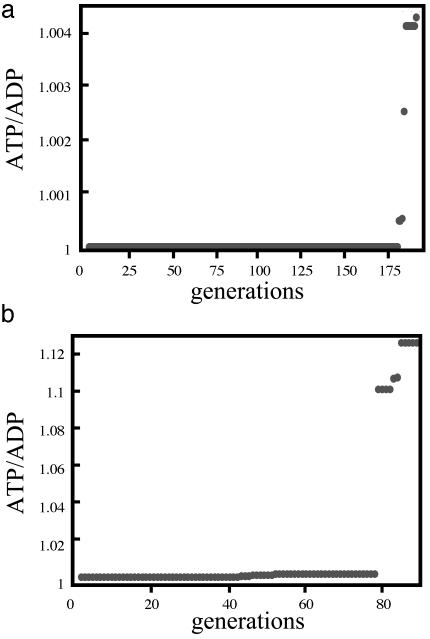
= 0.053. At the bifurcation, the value of the ATP/ADP ratio has very small
increase, from 1.0 to 1.0004, as shown in
Fig. 5a. In
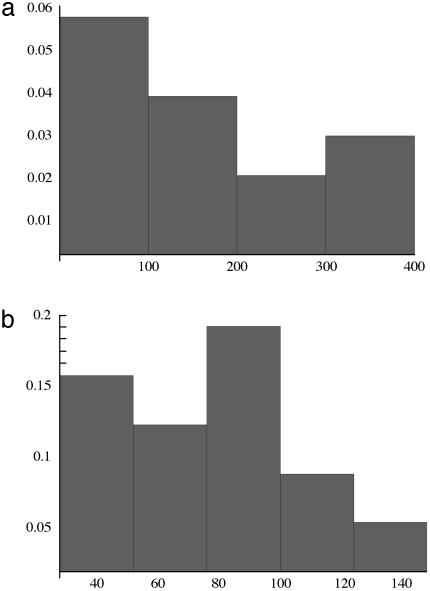
Fig. 6a, we generate a
frequency distribution vs. number of generations for an individual to reach
the bifurcation and find the most probable number of generation to be 167.
Fig. 5.
ATP/ADP ratio vs. the number of generation in the GA necessary to reach the bifurcation for the two-variable case. (a) Bifurcation at the 178th generation for the constant influx. (b) Bifurcation occurs at the 79th generation for the oscillatory influx. The highest value of the ATP/ADP ratio among 24 individuals at each generation is plotted. At the bifurcation, the ATP/ADP ratio is 1.1 for the oscillatory influx, much higher than the value, 1.0004, for the constant flux.
Fig. 6.
The frequency density vs. number of generations for the two-variable case to reach the bifurcation. Shown are the constant influx (average, 167) (a) and the oscillatory influx (average generation, 76) (b).
Next, we choose again 24 individuals with initial values of α1 = 0.25 and α2 = 0.053 and impose an oscillatory influx of glucose. As shown in Fig. 5b, the ATP/ADP ratio at the bifurcation is 1.1, much higher than the value for the constant flux (1.0004, see Fig. 5a). The most probable number of generation is 76 (Fig. 6b), which is substantially smaller than the value for the constant flux (167, see Fig. 6a). Fig. 6 a and b gives the frequency distributions for the number of generations to reach the bifurcation.
The frequency (period) of the periodic influx of glucose plays an important role in determining the behavior of the value of ATP/ADP ratios. This ratio decreases with an increase of α2, whereas it increases with an increase of α1. The maximum of the value of the ATP/ADP ratio occurs at α2 = 0.053 (initial value) and α1 = 0.45 (the maximum value in the range of α1 by the GA). We set the period of the glucose influx to be 0.65 min (compared to 0.5 min for the autonomous period in the vicinity of the bifurcation), so that the rate of change in α2 first is flat, initially within a change of 10–3, and then decreases within 10–2 before the bifurcation. Then, after the bifurcation, the value of the ATP/ADP ratio monotonically increases with increasing α1 and α2. With the driving period of 0.65 min, the value of ATP/ADP ratio increases substantially after the bifurcation. Although the decreasing rate with increasing α2 is steep enough when the driving period is 0.5 min, the system can attain autonomous oscillations because of the driving force of increasing the value of ATP/ADP ratio in the other variable, α1. This finding is rather surprising, because, in the one-variable case, with increasing α2 being varied instead of α1, the system would never reach an autonomous oscillationary state.
Discussion and Conclusion
The imposition of an oscillatory influx of glucose on the reaction mechanism shown in Fig. 1, initially in a state of no oscillations (in a node or a focus), may have two evolutionary advantages over the same system with a constant influx of glucose: (i) as shown for the example discussed, a higher ATP/ADP ratio (see the definition of the ATP/ADP ratio in Results of Computations) is reached at the bifurcation; and (ii) the bifurcation is reached more quickly. For the case of the variation of a single variable with a constant influx of glucose, it takes, for the most probable development, 59 generations to reach oscillatory conditions with increased ATP/ADP ratio of 1.0004. For oscillatory input, this number is reduced to 30 generations with higher ATP/ADP ratio of 1.1.
In the variation of two variables, for the constant input case, the number of generations necessary to reach the autonomous oscillation is 167 generations with increased ATP/ADP ratio of 1.0004 and, for the oscillatory glucose input, 76 generations with higher ATP/ADP ratio of 1.1. Furthermore, the more variables are evolved, the more generations are necessary to reach autonomous oscillations; about tripled (from 59 to 167) for the constant input case and more than doubled (from 30 to 76) for the oscillatory glucose input. These results are obtained from the deterministic kinetic calculation and hence, with the application of the GA, show the driving force toward the bifurcation.
Both advantages suggest that the evolutionary development of oscillatory reactions, at least in glycolysis, may have occurred at shores because of the periodic action of water waves. The faster development of oscillations with periodic wave impact (differences of time scales of many mutations) assures the spread of that development away from those shores. But the individuals at the shore have a higher ATP/ADP ratio than those not at the shore and growth at the shore may therefore expected to be higher, as found by observation (1).
Acknowledgments
This work was supported in part by National Institutes of Health Grant 2 PO1 HG00205 and the National Science Foundation.
Abbreviations: GA, genetic algorithm; EBR, enzymatic binding and rate constants.
References
- 1.Leigh, E. G., Jr., Paine, R. T., Quinn, J. F. & Suchanek, T. H. (1987) Proc. Natl. Acad. Sci. USA 84, 1314–1318. [DOI] [PMC free article] [PubMed] [Google Scholar]
- 2.Rapp, P. E. & Berridge, M. J. (1981) J. Exp. Biol. 93, 119–132. [Google Scholar]
- 3.Goldbeter, A. (1997) Biochemical Oscillations and Cellular Rhythms: The Molecular Bases of Periodic and Chaotic Behavior (Cambridge Univ. Press, Cambridge, U.K.).
- 4.Richter, P. H. & Ross, J. (1980) Biophys. Chem. 12, 285–297. [DOI] [PubMed] [Google Scholar]
- 5.Termonia, Y. & Ross, J. (1981) Proc. Natl. Acad. Sci. USA 78, 2952–2956. [DOI] [PMC free article] [PubMed] [Google Scholar]
- 6.Termonia, Y. & Ross, J. (1982) Proc. Natl. Acad. Sci. USA 79, 2878–2881. [DOI] [PMC free article] [PubMed] [Google Scholar]
- 7.Ross, J. & Schell, M. (1987) Annu. Rev. Biophys. Biophys. Chem. 16, 401–422. [DOI] [PubMed] [Google Scholar]
- 8.Astumian, R. D., Baldwin, R., Li, R. S. & Ross, J. (1992) J. Chem. Phys. 96, 6536–6542. [Google Scholar]
- 9.Lazar, J. G. & Ross, J. (1990) Science 247, 189–192. [DOI] [PubMed] [Google Scholar]
- 10.Lazar, J. G. & Ross, J. (1990) J. Chem. Phys. 92, 3579–3589. [Google Scholar]
- 11.Kocks, P., Ross, J. & Bjorkman, O. (1995) J. Phys. Chem. 99, 16483–16489. [Google Scholar]
- 12.Kocks, P. & Ross, J. (1995) J. Phys. Chem. 99, 16490–16497. [Google Scholar]
- 13.Schell, M., Kundu, K. & Ross, J. (1987) Proc. Natl. Acad. Sci. USA 84, 424–428. [DOI] [PMC free article] [PubMed] [Google Scholar]
- 14.Escher, C. & Ross, J. (1985) J. Chem. Phys. 82, 2453–2456. [Google Scholar]
- 15.Schram, H., Schell, M. & Ross, J. (1988) J. Chem. Phys. 88, 2730–2734. [Google Scholar]
- 16.Hjelmfelt, A. & Ross, J. (1989) J. Chem. Phys. 91, 2293–2298. [Google Scholar]
- 17.Richter, P., Rehmus, P. & Ross, J. (1981) J. Prog. Theor. Phys. 66, 385–405. [Google Scholar]
- 18.Gilman, A. & Ross, J. (1995) Biophys. J. 69, 1321–1333. [DOI] [PMC free article] [PubMed] [Google Scholar]
- 19.Tsuchiya, M. & Ross, J. (2001) J. Phys. Chem. 105, 4052–4058. [Google Scholar]


