

Abstract
Detailed measurements of water diffusion within the prostate over an extended b-factor range were performed to assess whether the standard assumption of monoexponential signal decay is appropriate in this organ. From nine men undergoing prostate MR staging exams at 1.5 T, a single 10 mm thick axial slice was scanned with a line scan diffusion imaging (LSDI) sequence in which 14 equally spaced b- factors from 5 to 3500 s/mm2 were sampled along three orthogonal diffusion sensitization directions in 6 minutes. Due to the combination of long scan time and limited volume coverage associated with the multi-b- factor, multi-directional sampling, the slice was chosen online from the available T2-weighted axial images with the specific goal of enabling the sampling of presumed non-cancerous regions of interest (ROI’s) within the central gland (CG) and peripheral zone (PZ). Histology from pre-scan biopsy (N = 9) and post-surgical resection (N = 4) was subsequently employed to help confirm that the ROIs sampled were non-cancerous. The CG ROIs were characterized from the T2-weighted images as primarily mixtures of glandular and stromal benign prostatic hyperplasia (BPH) which is prevalent in this population. The water signal decays with b- factor from all ROI’s were clearly non-monoexponential and better served with bi- vs monoexponential fits, as tested using λ2 based F-test analyses. Fits to biexponential decay functions yielded inter-subject fast diffusion component fractions on the order of 0.73 ± 0.08 for both CG and PZ ROIs, fast diffusion coefficients of 2.68 ± 0.39 and 2.52 ± 0.38 μm2/ms and slow diffusion coefficients of 0.44 ± 0.16 and 0.23 ± 0.16 um2/ms for CG and PZ ROI’s, respectively. The difference between the slow diffusion coefficients within CG and PZ was statistically significant as assessed with a Mann-Whitney non-parametric test (P < 0.05). We conclude that a monoexponential model for water diffusion decay in prostate tissue is inadequate when a large range of b- factors is sampled and that biexponential analyses are better suited for characterizing prostate diffusion decay curves.
Keywords: Prostate, diffusion, biexponential decay
Introduction
Prostate cancer is the number one solid tumor malignancy in American men. According to the American Cancer Society (1) over 230,000 new prostate cancer cases will be diagnosed with some 30,000 deaths estimated in 2004, making prostate cancer the second leading cause of cancer death in men and making early prostate cancer detection and treatment an important health care goal. Excellent anatomical imaging of the prostate is now available from both T1- and T2-weighted scans using endorectal coils in conjunction with multiple receiver coil elements (2–10). Though such imaging sequences are considered sensitive for prostate cancer detection, they lack specificity and are generally used for staging purposes. In efforts to improve the specificity of MR prostate examinations, both gadolinium based dynamic contrast studies (11–13) and magnetic resonance spectroscopy (MRS) studies (10, 14–20) are being evaluated. Similarly, quantitative T2- mapping and diffusion imaging have been suggested as potential candidates for improving the specificity of prostate MR examinations (21 – 25). Interestingly, prostate cancer has been shown to be different than many other cancers in that its presence tends to result in reduced T2 relaxation times and reduced diffusion coefficient (D) values (21–25), though more quantitative studies are needed to establish the validity and utility of the preliminary observations regarding prostate cancer diffusion properties.
In this work, a quantitative diffusion imaging approach has been applied to characterize water diffusion in prostate tissues. It should be noted that, as with MRS, diffusion imaging and/or measurements outside of the brain have been limited for technical reasons. For example, respiratory and peristaltic motion artifacts are major problems in abdominal and pelvic organs once diffusion sensitization gradients are applied. In addition, fat is also prevalent within the field-of- view (FOV) of typical prostate examinations, as is the presence of strong susceptibility induced gradients from bone/soft tissue and air/tissue interfaces. The most common diffusion imaging strategy, based on single-shot echo planar imaging (EPI) acquisitions (25), helps solve the motion problem but is prone to severe artifacts and geometric distortions from the chemical shift and the susceptibility effects prevalent in the abdomen and pelvis. Thus we have tested an alternate diffusion imaging strategy, based on serial “snapshot” acquisitions of tissue columns and referred to as line scan diffusion imaging (LSDI) (26,27), which is particularly suited for abdominal/pelvic applications. Though slower than EPI methods, LSDI permits distortion free, motion insensitive, quantitative diffusion measurements and has proven useful for studying diffusion decay curves at much higher b-factors than generally accessed with clinical scanners (28,29). In the brain, extended b- factor range studies with LSDI revealed a limitation of the standard monoexponential decay model to adequately described brain tissue water diffusion decay curves which turn out to be much better characterized with biexponential decay functions (28,29). In this study, LSDI has been similarly applied to determine the nature of diffusion decay curves in prostate tissues when sampled over a wide range of b- factors. As in the brain, biexponential decays were found to provide good empirical fits to diffusion decay curves from central gland CG and peripheral zone PZ tissue. The additional tissue characterization afforded by the biexponential diffusion decay parametrization complicates the standard diffusion model but offers further tissue characterization that might be considered for prostate cancer detection, staging, and/or response to treatment.
Materials and Methods
Nine men, mean age 66 ± 8 years, with biopsy proven adenocarcinoma of the prostate underwent staging MRI examinations to which we added an LSDI sequence. Informed consent was obtained from each subject according to the requirements of the hospital human research committee. All scanning was performed with a 1.5 T scanner operating at the 9.1 hardware/software configuration (General Electric Medical Systems, Milwaukee, WI). An endorectal coil (Medrad Inc., Indianola, PA) was used in conjunction with a 4 coil phased array receiver arrangement with the body coil used for transmitting RF pulses. All examinations included axial and coronal T2-weighted fast-spin echo (FSE) scans using 4 mm skip 1 mm slice thickness and gap with 2 excitations, a 10 cm field-of-view (FOV), 256 × 192 (frequency × phase) image matrices, a repetition time (TR) of 3 s and an effective echo time of 68 ms with a 12 echo train length (ETL). T1-weighted spin echo scans were also obtained in the axial plane using 5 mm skip 1 mm slice thickness and gap with TR/TE = 600/15 (ms/ms).
From the set of axial T2-weighted FSE scans a single slice was selected for quantitative diffusion imaging using the LSDI sequence. The slice selected for diffusion imaging was chosen by a radiologist (ASB) in each case to avoid suspected regions of cancer or hemorrhage regions using on- line inspection of the T2- and T1-weighted images, respectively, during the MR examination and prior to the LSDI acquisition.
The LSDI approach for diffusion imaging has been described extensively elsewhere (26–29). For this application, a single 10 mm thick slice with a 2.8 × 2.8 mm2 in-plane resolution (180 × 135 mm2 FOV, 64 × 48 matrix) was scanned using 14 b-factors from 5 to 3500 s/mm2 along the three orthogonal directions (1,-1,-1/2), (1/2,1,-1) and (1,1/2,1) with a TR/TE combination of 4000/75 (ms/ms) and a receiver bandwidth of ± 3.9 kHz. The b- factor was varied by changing the amplitude of the diffusion gradient with all timing parameters fixed. The pulse gradient duration δ, the separation between leading edges of the pulse gradient Δ, and the “diffusion time” Δ – δ/3 were approximately 48 ms, 56 ms and 40 ms, respectively. A total of 42 images - 14 b-factors × 3 directions - were acquired with each image consisting of 48 columns each sampled with 64 along-column frequency encoding steps. The total acquisition time was 6 minutes and 34 seconds.
From the 42 images acquired (14 b- factors, 3 directions), geometric mean images consisting of the cubed root of the product of the three different directions were generated for each b- factor. From the geometric mean data sets, ROIs of approximately 1.5 ml tissue volume within the CG and PZ were identified for detailed signal decay analyses. These ROIs were chosen to avoid regions suspected of containing cancer or hemorrhage, as assessed by consensus between two radiologists (ASB, CMCT) on the basis of the T2- and T1-weighted images. Furthermore, available histological results from the biopsies of each subject as well as post-surgical findings in 4 subjects were consulted in order to further confirm that the ROIs selected had a low probability of containing cancer. In addition to the tissue ROIs, noise measurements were made from an ROI within the air of the inflated balloon within the rectum.
The signal vs b- factor from each ROI, as extracted from the geometric mean data sets were fit with both monoexponential functions and biexponential decay functions of the form
| [1] |
where S is the signal intensity, b the b- factor, Da and Db the fast and slow diffusion coefficients, respectively, and A and B their amplitudes with the fraction of the fast diffusion component given by A/(A + B). Fits were performed with a Marquardt-Levenberg algorithm as implemented in Matlab software (The MathWorks, Inc., Natick, MA). The fits of the data to monoexponential decay curves (B = 0 in Eq 1) were performed in order to allow for a comparison of the chi2 (λ2) values and subsequent F-tests (30–32) to determine whether the biexponential model provided a statistically improved fit over the monoexponential model with P < 0.05 in the F-test considered significant.
Mann-Whitney two-tailed t-tests were used to determine statistically significant differences between the inter-subject median values of the biexponential parameters as extracted from the CG and PZ ROIs with P values less than 0.05 considered significant.
Results
Conventional imaging demonstrated benign prostatic hyperplasia (BPH) involving central gland was present in all 9 subjects. In addition, for all 9 patients, areas of hypointense signal on T2-weighted images suggested the presence of prostate cancer. In two of the 9 patients areas of post-biopsy hemorrhage were identified on the basis of hyperintense signal on the T1-weighted images. None of the suspected cancerous or hemorrhagic regions were included within the ROIs used for diffusion analyses.
All 9 LSDI scans were used for analyses with no obvious artifacts or technical failures. Figures 1 a–c show a T2-weighted FSE image and geometric mean LSDI images with b- factors of 5 and 3,500 s/mm2, respectively. Typical CG, PZ, and noise ROIs employed for diffusion decay curve analyses are shown in each image. The inter-individual mean signal intensities, normalized to the smallest b- factor signals, are plotted as a function of b- factor in Figure 2 for both the CG and PZ ROIs as well as noise ROIs. Since the natural log of the signal intensities are plotted in Figure 2, the decay curves would appear as straight lines given a monoexponential decay model. Clearly there is a curvature of the decay curves which is well-characterized by biexponential functions whose best fits to the data are shown as solid lines through the data. Figure 2 also demonstrates that the normalized CG and PZ signals remain well above the normalized baseline noise values at all the b- factors sampled. Table 1 provides the interindividual mean ± SD biexponential parameters found for the fits to the CG and PZ data using Eq [1]. When comparing biexponential parameter differences between the CG and PZ ROI data, only the DB parameter demonstrated a significant difference (P < 0.03). The appropriateness of biexponential over monoexponential fits was assessed by F-tests using λ2 ratios of each type of fit modulated by the relative number of degrees of freedom. The biexponential fits provided a statistically significant improvement over monoexponential fits at the P < 0.0001 level.
Figure 1.
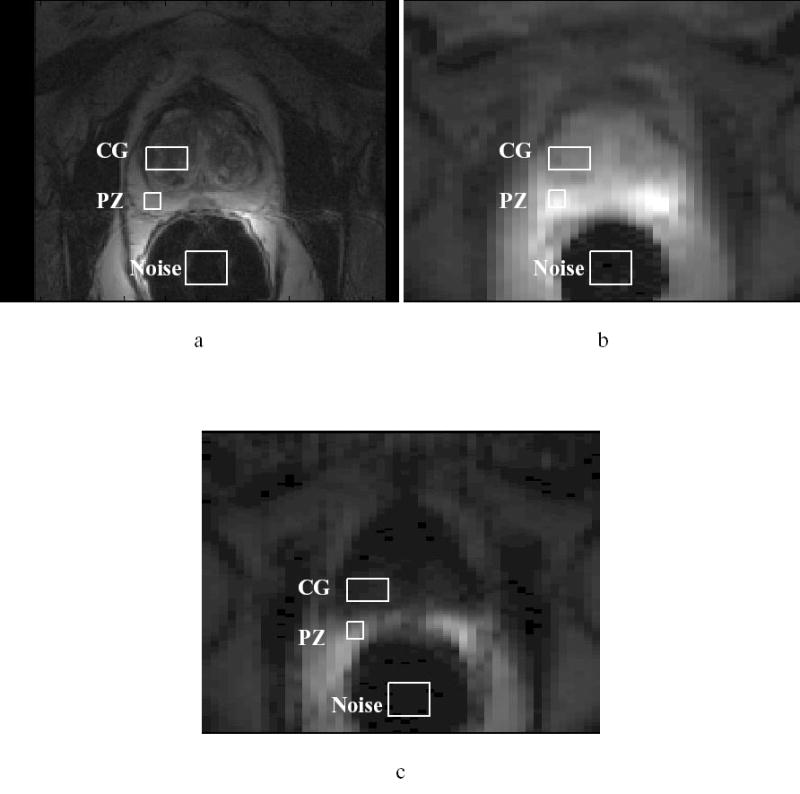
a) T2-weighted FSE image; b) LSDI geometric mean image with b = 5 s/mm2; c) LSDI geometric mean image with b = 3,500 s/mm2. Typical ROIs in the central gland (CG), peripheral zone (PZ) and noise from which data was extracted for quantitative diffusion analyses are shown in each image.
Figure 2.

Plots of the logarithm of signal decay with b-factor as extracted from the CG and PZ ROIs of all nine men. Shown are the interindividual mean ± SD (N = 9) signal intensities normalized to the lowest b-factor image. Also shown are the inter- individual mean ± SD (N = 9) noise values at each b-factor normalized to the lowest b- factor CG and PZ signal intensities.
Table 1.
Inter-subject means ± SD (N = 9 subjects) of the biexponential parameters used to characterize diffusion decay curves from ROIs in the CG and PZ. The difference between Db values for the PZ and CG is statistically significant (P < 0.05).
| A/(A + B) | Da (μm2/ms) | Db (μm2/ms) | |
|---|---|---|---|
| CG | 0.73 ± 0.09 | 2.68 ± 0.39 | 0.44 ± 0.16 |
| PZ | 0.74 ± 0.07 | 2.52 ± 0.38 | 0.23 ± 0.16 |
Discussion
As recently found for diffusion studies of the brain (28,29, 33,34), sampling a wide range of b- factors in the prostate reveals that the water diffusion signal decays are better modeled with bi- as opposed to monoexponential functions. This finding offers additional prostate tissue characterization parameters based on water diffusion properties, namely the relative fractions of the fast and slow diffusion components and their respective diffusion coefficients. Of course diffusion imaging of the prostate in general is in its infancy with only a few preliminary reports of quantitative diffusion coefficients currently available (21,24,25). Two of these reports are somewhat conflicting in their conclusions (21,25). For example both Issa (25) and Gibbs et al (21) studied healthy volunteers and patients with suspected prostate cancer. Both groups used basically the same technique - single-shot echo planar diffusion imaging – and sampled the same range of b- factors up to 750 s/mm2. In healthy volunteers, Issa (25) reported PZ and CG diffusion coefficients of 1.91 ± 0.46 um2/ms and 1.63 ± 0.30 um2/ms, respectively, while Gibbs et al (21) reported much smaller PZ and CG diffusion coefficients of 1.25 ± 0.23 and 1.17 ± 0.18 um2/ms, respectively. Furthermore, Issa (25) reported similar diffusion coefficients for the noncancerous PZ and CG regions of the patient population and the PZ and CG regions for healthy volunteers, while Gibbs et al (21) reported PZ and CG diffusion coefficients some 2 to 3 times higher in the patients compared to the volunteers. Chan et al (24), using LSDI in the b- factor range below 750 s/mm2, reported PZ diffusion values for noncancerous PZ close to those reported by Issa (25).
The source of these discrepancies remains unclear. The data presented in this work, however, demonstrates the presence of a slow diffusion component which, in turn, would suggest that previous measurements based on the assumption of monoexponential decay over a limited b- factor range most probably underestimated the fast diffusion coefficient. By taking the slow diffusion coefficient into account with biexponential analyses, we measured higher fast diffusion coefficients in noncancerous PZ and CG ROIs of around 2.7 um2/ms (Table 1) than those previously reported. Furthermore, a statistically significant difference between the CG and PZ slow diffusion coefficient was found with the PZ demonstrating a smaller slow diffusion coefficient.
In this study, only three orthogonal diffusion sensitization directions were sampled so that rotationally invariant measures of the fractional anisotropy are not available. Some indication of the degree of diffusion anisotropy can, however, be gleaned by examining the standard deviation (SD) over the mean of the biexponential parameters extracted from fitting decay curves along the individual diffusion sensitization directions. This coefficient of variation, expressed as a percentage (SD/mean × 100) was less than 15 % for the Da values in the CG and PZ but was larger than 22 % for the Db values, indicating perhaps more anisotropy for the slow component in these tissues. These remarks on anisotropy are, of course, very preliminary and further studies of the anisotropy of the biexponential parameters using at least six diffusion sensitization directions are in order to clarify the role of anisotropy in prostate tissues.
Limitations of the present study include the small number of men studied and the fact that only men with biopsy proven prostate cancer have been examined in order to establish biexponential parametrization of non-cancerous PZ and CG regions. Every effort was made to sample ROI’s considered free of cancer on the basis of both conventional images and available histology, though it is impossible to fully exclude the possibility that some of the decay curves were influenced by the presence of cancer. Future studies might consider the use of spectroscopic imaging to better define regions of non-cancerous tissue for diffusion measurement and for identifying regions of cancer for biexponential diffusion characterization, assuming prostate cancer will also exhibit biexponential diffusion decay as found by Maier et al for brain tumors (28).
Finally, the origin of the non- monoexponential diffusion decay curves in tissue like brain, brain tumors, and now prostate, is unknown. Since the diffusion decays are well-characterized with biexponential decay functions, they may reflect two separate water compartments, such as intra- and extracellular water, with widely divergent diffusion coefficients. Problems with this interpretation, including the wrong relative sizes of the presumed intra- and extracellular compartments as measured from biexponential analyses, have arisen within the context of brain diffusion studies (33,34). It is equally well- established that non-monoexponential behavior arises from the restricted nature of water diffusion in tissue using diffusion times of several tens of ms, as in this study. As such, the non- monoexponential decays most probably reflect an indirect manifestation of water compartmentation by cell membranes. Modeling such effects is extremely complex and analytical expressions even for simple geometries are not simple biexponential functions (35–37). In this case, the fitting of our decay data to biexponential functions should be understood as a useful data reduction scheme rather than a direct representation of any specific model of water compartmentation and/or water exchange between compartments (33). The empirical observation, however, that biexponential parametrization adequately describes prostate water diffusion over an extended but clinically accessible b- factor range suggests opportunities for exploration. Future studies may focus on determining whether the additional tissue characterization afforded by the biexponential parametrization can play a role in differentiating cancer from normal PZ or CG. In addition, the quantitative biexponential diffusion decay approach may also provide a more specific test of the response of prostate cancer to treatment than standard diffusion imaging which has already shown some promise for assessing tumor response to therapy (38–41).
Acknowledgments
This work was supported in part by NIH grants RO1 AG19513-01, AG 5 PO1CA67165-03, 1 R33 CA99015, 1RO1 NS39335-01A1, RO3HS13234-01 and R25-CA-089017-03. The authors would like to acknowledge the excellent support of Brigham and Women’s technologists Jim Rosato and Kevin Lanctot.
References
- 1.American Cancer Society. Cancer Facts and Figures. 2004.
- 2.Heuck A, Scheidler J, Sommer B, Graser A, Muller-Lisse UG, Massmann J. MR imaging of prostate cancer. Radiologue. 2003;43:464–473. doi: 10.1007/s00117-003-0906-7. [DOI] [PubMed] [Google Scholar]
- 3.Mueller-Lisse UG, Mueller-Lisse UL, Haller S, Schneede P, Scheidler JE, Schmeller N, Hofstetter AG, Reiser MF. Likelihood of prostate cancer based on prostate-specific antigen density by MRI: Retrospective analysis. JCAT. 2002;26:432–437. doi: 10.1097/00004728-200205000-00020. [DOI] [PubMed] [Google Scholar]
- 4.Tuzel E, Sevinc M, Obuz F, Sade M, Kirkali Z. Is magnetic resonance imaging necessary in the staging of prostate cancer? Urol Internat. 1998;61:227–231. doi: 10.1159/000030334. [DOI] [PubMed] [Google Scholar]
- 5.Perrotti M, Han KR, Epstein RE, Kennedy EC, Rabbani F, Badani K, Pantuck AJ, Weiss RE, Cummings KB. Prospective evaluation of endorectal magnetic resonance imaging to detect tumor foci in men with prior negative prostatic biopsy: A pilot study. J Urol. 1999;162:1314–1317. [PubMed] [Google Scholar]
- 6.White S, Hricak H, Forstner R, Kurhanewicz J, Vigneron DB, Zaloudek CJ, Weiss JM, Narayan P, Carroll PR. Prostate cancer: Effect of postbiopsy hemorrhage on interpretation of MR images. Radiology. 1995;195:385–390. doi: 10.1148/radiology.195.2.7724756. [DOI] [PubMed] [Google Scholar]
- 7.Schiebler ML, Schnall MD, Pollack HM, Lenkinski RE, Tomaszewski JE, Wein AJ, Whittington R, Rauschning W, Kressel HY. Current role of MR imaging in the staging of adenocarcinoma of the prostate. Radiology. 1993;189:339–352. doi: 10.1148/radiology.189.2.8210358. [DOI] [PubMed] [Google Scholar]
- 8.Yu KK, Hricak H. Imaging prostate cancer. Radiol Clin North AM. 2000;38:59–85. doi: 10.1016/s0033-8389(05)70150-0. [DOI] [PubMed] [Google Scholar]
- 9.Grossfeld GD, Coakley FV. Benign prostatic hyperplasia: Clinical overview and value of diagnostic imaging. Radiol Clin North Am. 2000;38:31–47. doi: 10.1016/s0033-8389(05)70148-2. [DOI] [PubMed] [Google Scholar]
- 10.Kurhanewicz J, Vigneron DB, Males RG, Swanson MG, Yu KK, Hricak H. The prostate: MR imaging and spectroscopy. Present and Future. Radiol Clin North Am. 2000;38:115–138. doi: 10.1016/s0033-8389(05)70152-4. [DOI] [PubMed] [Google Scholar]
- 11.Ito H, Kamoi K, Yokoyama K, Yamada K, Nishimura T. Visualization of prostate cancer using dynamic contrast-enhanced MRI: comparison with transrectal power Doppler ultrasound. Brit J Radiol. 2003;76:617–624. doi: 10.1259/bjr/52526261. [DOI] [PubMed] [Google Scholar]
- 12.Preziosi P, Orlacchio A, Di Giambattista G, Di Renzi P, Bortolotti L, Fabiano A, Cruciani E, Pasqualetti P. Enhancement patterns of prostate cancer in dynamic MRI. Euro Radiol. 2003;13:925–930. doi: 10.1007/s00330-002-1703-9. [DOI] [PubMed] [Google Scholar]
- 13.Engelbrecht MR, Huisman HJ, Laheij RJF, Jager GJ, van Leenders GJLH, Hulsbergen-Van De Kaa CA, de la Rosette JJMCH, Blickman JG, Barentsz JO. Discrimination of prostate cancer from normal peripheral zone and central gland tissue by using dynamic contrast-enhanced MR imaging. Radiology. 2003;229:248–254. doi: 10.1148/radiol.2291020200. [DOI] [PubMed] [Google Scholar]
- 14.Garcia-Segura JM, Sanchez-Chapado M, Ibarburen C, Viano J, Angulo JC, Gonzalez J, Rodriguez-Vallejo JM. In vivo proton spectroscopy of diseased prostate: Spectroscopic features of malignant versus benign pathology. Magn Reson Imag. 1999;17:755–765. doi: 10.1016/s0730-725x(99)00006-5. [DOI] [PubMed] [Google Scholar]
- 15.Kurhanewicz J, Dahiya R, Macdonald JM, Hong Chang L, James TL, Narayan P. Citrate alterations in primary and metastatic human prostatic adenocarcinomas: 1H magnetic resonance spectroscopy and biochemical study. Magn Reson Med. 1993;29:149–157. doi: 10.1002/mrm.1910290202. [DOI] [PubMed] [Google Scholar]
- 16.Kurhanewicz J, Vigneron DB, Hricak H, Narayan P, Carroll P, Nelson SJ. Three-dimensional H-1 MR spectroscopic imaging of the in situ human prostate with high (0.24–0.7-cm3) spatial resolution. Radiology. 1996;198:795–805. doi: 10.1148/radiology.198.3.8628874. [DOI] [PubMed] [Google Scholar]
- 17.Van der Graaf M, van den Boogert HJ, Jager GJ, Barentsz JO, Heerschap A. Human prostate: Multisection proton MR spectroscopic imaging with a single spin-echo sequence-preliminary experience. Radiology. 1999;213:919–925. doi: 10.1148/radiology.213.3.r99nv07919. [DOI] [PubMed] [Google Scholar]
- 18.Yuen JSP, Thng CH, Tan PH, Khin LW, Phee SJL, Xiao D, Lau WKO, Ng WS, Cheng CWS. Endorectal magnetic resonance imaging and spectroscopy for the detection of tumor foci in men with prior negative transrectal ultrasound prostate biopsy. J Urol. 2004;171:1482–1486. doi: 10.1097/01.ju.0000118380.90871.ef. [DOI] [PubMed] [Google Scholar]
- 19.Hasumi M, Suzuki K, Taketomi A, Matsui H, Yamamoto T, Ito K, Kurokawa K, Aoki J, Endo K, Yamanaka H. The combination of multi- voxel MR spectroscopy with MR imaging improve the diagnostic accuracy for localization of prostate cancer. Anti Canc Res. 2003;23:4223–4227. [PubMed] [Google Scholar]
- 20.Zakian KL, Sircar K, Hricak H, Chen H-N, Shukla-Dave A, Eberhardt S, Muruganandham M, Ebora L, Kattan MW, Reuter VE, Scardini PT, Koutcher JA. Correlation of proton MR spectroscopic imaging with Gleason score based on step-section pathologic analysis after radical prostatectomy. Radiology. 2005;234:804–814. doi: 10.1148/radiol.2343040363. [DOI] [PubMed] [Google Scholar]
- 21.Gibbs P, Tozer DJ, Liney GP, Turnbull LW. Comparison of quantitative T2 mapping and diffusion-weighted imaging in the normal and pathologic prostate. Magn Reson Med. 2001;46:1054–1058. doi: 10.1002/mrm.1298. [DOI] [PubMed] [Google Scholar]
- 22.Liney GP, Turnbull LW, Lowry M, Knowles A, Horsman A. In vivo quantitation of citrate concentration and water T2 relaxation time of the pathologic gland using 1H MRS and MRI. Magn Reson Imag. 1997;15:1177–1186. doi: 10.1016/s0730-725x(97)00182-3. [DOI] [PubMed] [Google Scholar]
- 23.Liney GP, Knowles A, Manton D, Turnbull L, Blackband S, Horsman A. Comparison of conventional single echo and multi-echo sequences with a fast spin-echo sequence for quantitative T2- mapping: Application to the prostate. J Magn Reson Imag. 1996;6:603–607. doi: 10.1002/jmri.1880060408. [DOI] [PubMed] [Google Scholar]
- 24.Chan I, Wells W, III, Mulkern RV, Haker SJ, Zhang J, Zou KH, Maier SE, Tempany CMC. Detection of prostate cancer by integration of line-scan diffusion, T2-mapping and T2-weighted MR imaging; a multi-channel statistical classifier. Med Phys. 2003;30:2390–2398. doi: 10.1118/1.1593633. [DOI] [PubMed] [Google Scholar]
- 25.Issa B. In vivo measurement of the apparent diffusion coefficient in normal and malignant prostatic tissues using echo-planar imaging. J Magn Reson Imag. 2002;16:196–200. doi: 10.1002/jmri.10139. [DOI] [PubMed] [Google Scholar]
- 26.Gudbjartsson H, Maier SE, Mulkern RV, Morocz IA, Patz S, Jolesz FA. Line scan diffusion imaging. Magn Reson Med. 1996;36:509–518. doi: 10.1002/mrm.1910360403. [DOI] [PubMed] [Google Scholar]
- 27.Maier SE, Gudbjartsson H, Patz S, Hsu L, Lovblad KO, Edelman RR, Warach S, Jolesz FA. Line scan diffusion imaging: Characterization in healthy subjects and stroke patients. AJR. 1998;171:85–93. doi: 10.2214/ajr.171.1.9648769. [DOI] [PubMed] [Google Scholar]
- 28.Maier SE, Bogner P, Bajzik G, Mamata H, Mamata Y, Repa I, Jolesz FA, Mulkern RV. Normal brain and brain tumor: Multi-component apparent diffusion coefficient line scan imaging. Radiology. 2001;219:842–849. doi: 10.1148/radiology.219.3.r01jn02842. [DOI] [PubMed] [Google Scholar]
- 29.Mulkern RV, Vajapeyam S, Robertson RL, Caruso PA, Rivkin MJ, Maier SE. Biexponential apparent diffusion coefficient parametrization in adult vs. newborn brain. Magn Reson Imag. 2001;19:659–668. doi: 10.1016/s0730-725x(01)00383-6. [DOI] [PubMed] [Google Scholar]
- 30.Graham SJ, Stanchev PL, Bronskill MJ. Criteria for analysis of multicomponent tissue T2 relaxation data. Magn Reson Med. 1996;35:370–378. doi: 10.1002/mrm.1910350315. [DOI] [PubMed] [Google Scholar]
- 31.Istratov AA, Vyvenko OF. Exponential analysis in physical phenomena. Rev Sci Instr. 1999;70:1233–1257. [Google Scholar]
- 32.Cheng KH. In vivo tissue cha racterization of human brain by chi squares parameter maps: multiparameter proton T2-relaxation analysis. Magn Reson Imag. 1994;12:1099–1109. doi: 10.1016/0730-725x(94)91242-o. [DOI] [PubMed] [Google Scholar]
- 33.Mulkern RV, Gudbjartsson H, Westin CF, Zengingonul HP, Gartner W, Guttmann CRG, Robertson RL, Kyriakos W, Schwartz R, Holtzman D, Jolesz FA, Maier SE. Multi-component apparent diffusion coefficients in human brain. NMR in Biomed. 1999;12:51–62. doi: 10.1002/(sici)1099-1492(199902)12:1<51::aid-nbm546>3.0.co;2-e. [DOI] [PubMed] [Google Scholar]
- 34.Clark CA, Le Bihan D. Water diffusion compartmentation and anisotropy at high b values in the human brain. Magn Reson Med. 2000;44:852–859. doi: 10.1002/1522-2594(200012)44:6<852::aid-mrm5>3.0.co;2-a. [DOI] [PubMed] [Google Scholar]
- 35.Sukstanskii AL, Yablonskiy DA. Effects of restricted diffusion on MR signal formation. J Magn Reson. 2002;157:92–105. doi: 10.1006/jmre.2002.2582. [DOI] [PubMed] [Google Scholar]
- 36.Callaghan PT. Pulsed- gradient spin-echo NMR for planar, cylindrical, and spherical pores under conditions of wall relaxation. J Magn Reson A. 1995;113:53–59. [Google Scholar]
- 37.Peled S, Cory CG, Raymond SA, Kirschner DA, Jolesz FA. Water diffusion, T2, and compartmentation in frog sciatic nerve. Magn Reson Med. 1999;42:911–918. doi: 10.1002/(sici)1522-2594(199911)42:5<911::aid-mrm11>3.0.co;2-j. [DOI] [PMC free article] [PubMed] [Google Scholar]
- 38.Jennings D, Hatton BN, Guo JY, Galons JP, Trouard TP, Raghunand N, Marshall J, Gillies RJ. Early response of prostate carcinoma xenografts to docetaxel chemotherapy monitored with diffusion MRI. Neoplasia. 2002;4:255–262. doi: 10.1038/sj.neo.7900225. [DOI] [PMC free article] [PubMed] [Google Scholar]
- 39.Song SK, Qu ZC, Garabedian EM, Gordon JI, Milbrandt J, Ackerman JJH. Improved magnetic resonance imaging detection of prostate cancer in a transgenic mouse model. Cancer Research. 2002;62:1555–1558. [PubMed] [Google Scholar]
- 40.Dodd NJF, Zhao S. Early detection of tumour response to radiotherapy using MRI. Physica Medica. 1997;13:56–60. [Google Scholar]
- 41.Mardor Y, Pfeffer R, Spiegelmann R, Roth Y, Maier SE, Nissim O, Berger R, Glicksman A, Baram J, Orenstein A, Cohen JS, Tichler T. Early detection of response to radiation therapy in patients with brain malignancies using conventional and high b-value diffusion-weighted magnetic resonance imaging. J Clin Oncol. 2003;21:1094–1100. doi: 10.1200/JCO.2003.05.069. [DOI] [PubMed] [Google Scholar]