

Abstract
Aim
To investigate glutathione and antioxidant status changes in erythrocytes from febrile children receiving repeated supratherapeutic paracetamol doses.
Methods
Fifty-one children aged 2 months to 10 years participated in the study. Three groups were studied: group 1 (n = 24) included afebrile children who did not receive paracetamol; and groups 2 (n = 13) and 3 (n = 14) included children who had fever above 38.5°C for more than 72 h. Patients in group 2 received paracetamol at a dose of 50 ± 15 (30–75) mg kg−1 day−1 and those in group 3 received paracetamol above the recommended therapeutic dose, ie 107 ± 28 (80–180) mg kg−1 day−1. A blood sample was taken for the measurement of liver transaminases, gammaglutamil transferase (GGT), reduced glutathione (GSH), glutathione reductase (GR), glutathione peroxidase (GPX), glutathione S-transferase (GST), superoxide dismutase (SOD) and antioxidant status.
Results
Aspartate aminotransferase activity in group 3 was higher than in the other groups (P = 0.027). GSH, SOD and antioxidant status were significantly lower in group 3 compared with groups 1 and 2 (mean differences: for GSH 3.41 µmol gHb−1, 95% confidence interval (CI) 2.10–4.72, and 2.15 µmol gHb−1, 95% CI 0.65–3.65, respectively; for SOD 856 U min−1 gHb−1, 95% CI 397–1316, and 556 U min−1 gHb−1, 95% CI 30–1082, respectively; and for antioxidant status 0.83 mmol l−1 plasma, 95% CI 0.30–1.36, and 0.63 mmol l−1 plasma, 95% CI 0.02–1.24, respectively). GR activity was significantly lower in groups 3 and 2 in comparison with group 1 (mean differences 3.44 U min−1 gHb−1, 95% CI 0.63–6.25, and 5.64 U min−1 gHb−1, 95% CI 2.90–8.38, respectively). Using multiple regression analysis, paracetamol dose was found to be the only independent variable affecting GR, GST and SOD activities (P = 0.007, 0.003 and 0.008, respectively).
Conclusions
In febrile children, treatment with repeated supratherapeutic doses of paracetamol is associated with reduced antioxidant status and erythrocyte glutathione concentrations. These significant changes may indicate an increased risk for hepatotoxicity and liver damage.
Keywords: antioxidant status, febrile children, glutathione changes, glutathione-dependent enzymes, repeated paracetamol
Introduction
Paracetamol is the most frequently used over-the-counter medication in children in the USA [1]. Paracetamol toxicity is rare when it is given in recommended doses. However, repeated supratherapeutic doses of paracetamol given for therapeutic reasons may cause hepatotoxicity in adults and children [2–5]. Heubi et al. [5] described a series of 47 children who developed severe hepatotoxicity after receiving multiple therapeutic doses of paracetamol. Twenty-four (55%) died and three survived after liver transplantation. In a case series from a paediatric liver transplant centre in Australia 11 out of 18 cases of liver failure were due to chronic paracetamol exposure [6].
The major metabolic pathways of paracetamol are glucuronidation and sulphation. A minor pathway, catalysed by cytochrome P450, produces a highly toxic metabolite, N-acetyl-p-benzoquinoneimine (NAPQI), which is detoxified in the hepatocytes by the glutathione system.
The aim of this study was to compare prospectively glutathione, glutathione-dependent enzymes and antioxidant status between febrile children taking repeated doses of paracetamol (normal or supratherapeutic) and afebrile children who had not received paracetamol.
Patients and methods
The patients comprised a prospective cohort of children 2 months to 10 years of age who presented to the paediatric emergency department and paediatric ambulatory care unit.
The study was approved by the institutional review board for human subject research at the University of Tel-Aviv. Informed written consent was obtained from parents before enrolment.
Three groups of children were studied. Group 1 consisted of afebrile children who did not receive paracetamol and were examined for noninfectious causes. Group 2 consisted of children who had fever above 38.5°C for more than 72 h and had been receiving repeated doses of paracetamol up to 75 mg kg−1 body weight per day during this period. Group 3 consisted of children who had fever above 38.5°C for more than 72 h and received repeated doses of paracetamol exceeding a total daily dose of 75 mg kg−1 body weight.
Patients were excluded from the study if they had known chronic liver disease, suspected viral hepatitis, or treatment with a potentially hepatotoxic drug or with drugs that induce cytochrome P450.
In every child presenting to the paediatric emergency department, a careful history regarding paracetamol administration was taken from the parent or carer. If the reported total daily dose of paracetamol administered was more than 30 mg kg−1 per day for more than 72 h, a questionnaire was filled in by the paediatrician after interviewing the family. The questionnaire included information on the duration of fever, paracetamol doses, frequency and route of administration, and other drugs administered to the child. The total daily dose was verified by asking the parents to recall how many packages of paracetamol were used during the current illness.
Patients for the control group (no fever and no paracetamol treatment) were recruited from the emergency department and from the ambulatory paediatric unit.
Blood was taken from each child, and analysed for aspartate aminotransferase (AST), alanine aminotransferase (ALT), gammaglutamil transferase (GGT), alkaline phosphatase (ALP), urea, creatinine and uric acid. Reduced glutathione (GSH), glutathione reductase (GR), glutathione peroxidase (GPX), glutathione S-transferase (GST) and superoxide dismutase (SOD) were measured in erythrocytes. Antioxidant status was determined in plasma.
Biochemical analysis
Peripheral blood was collected into heparin vacutainer tubes and immediately transferred on ice to the laboratory. The erythrocyte lysate was prepared according to the method of Beutler et al. [7] and rapidly frozen to −70°C.
All activity assays were performed on a Cobas Mira Random Access Chemistry Analyser (F. Hoffmann LaRoche, Ltd. Diagnostic Division, Basel, Switzerland). GPX activity was measured at 340 nm as NADPH oxidized using a commercial kit with cumene hydroperoxide as substrate (Randox Laboratories Ltd, San Francisco, CA, USA). One activity unit was defined as 1 µmol NADPH oxidized min−1 l−1 haemolysate. The lower detection limit was 2.9 µmol l−1 min−1, and the coefficient of variation for the assay was 1.85% at 1048.71 U l−1. GR activity was determined at 340 nm using a commercial kit (Glutathione–reductase; R&D Systems, Oxis International Inc., Portland, OR, USA). One activity unit was defined as 1 µmol NADP (NADPH) formed min−1 l−1 haemolysate. The lower detection limit was 0.14 µmol l−1, and the coefficient of variation was 3% at 2 µmol l−1. GSH content was determined with dithionitrobenzoic acid using the method described by Beutler et al. [8] and was expressed in µmol GSH l−1 haemolysate. The lower detection limit was 5 µmol l−1, and the coefficient of variation was 1% at 20 µmol l−1. SOD was determined using a commercial kit (Randox Laboratories, Ltd) at 500 nm as the inhibitor of xanthine oxidation by xanthine oxidase. Activity was defined as SOD U l−1 haemolysate according to the standard provided in the kit. The lower detection limit was 0.2 U l−1, and the coefficient of variation was 3.8% at 236 U l−1. GST was determined at 340 nm using 1-chloro-2,4-dinitrobenzene as a substrate according to the method described by Habig et al. [9]. One activity unit was defined as 1 µmol complex formed min−1 l−1 haemolysate. The lower detection limit was 7 µmol min−1 l−1 haemolysate, and the coefficient of variation was 5–11% at 7 U l−1. Antioxidant status was measured in plasma using the method described by Miller et al. [10]. AST and ALT were measured in the serum using a chemistry analyser (ILAB, International Laboratories, Milan, Italy).
Statistical analysis
Groups were compared by one-way analysis of variance with post hoc Tukey test for normally distributed variables and by Kruskal–Wallis one-way analysis of variance on ranks with Dunn's method for non-normally distributed variables. Multiple linear regression was used to determine the effect of independent variables on the outcomes. Results are presented as mean ± SD or median as appropriate. P-value of < 0.05 was considered significant.
Results
Fifty-one children participated in the study. Group 1 included 24 children aged 6 ± 3 years who were afebrile and did not receive paracetamol. They presented to the hospital for inguinal hernia repair (n = 12), abdominal pain (n = 8), and cervical lymphadenopathy (n = 4). Group 2 included 13 children aged 3.5 ± 2.6 years with fever above 38.5°C who received paracetamol within the recommended dose [50.3 ± 15 (30–75) mg kg−1 body weight per day] for more than 72 h [4.1 ± 1.8 (3–10) days]. Group 3 included 14 children aged 2.2 ± 1.8 years with fever above 38.5°C who received paracetamol above the recommended therapeutic dose [107 ± 28 (80–180) mg kg−1 body weight per day] for more than 72 h [3.9 ± 1.7 (3–9) days]. All the children in this series received paediatric preparations of paracetamol. The majority of the children in group 3 received high dose of the drug because it was given at intervals shorter than recommended or because parents gave more than the recommended dose in an attempt to control the fever.
The ages, weight, sex, duration of fever and time from the last dose of paracetamol for the different groups are presented in Table 1.
Table 1.
Demographic features of study groups
| Group | n | Sex M/F | Age (years) ± s.d. | Duration of fever (days) | Time from last dose of paracetamol (h) |
|---|---|---|---|---|---|
| 1 | 24 | 12/12 | 6 ± 3 | – | – |
| 2 | 13 | 7/6 | 3.5 ± 2.6 | 4.1 ± 1.8 (3–10) | 4.9 ± 6.9 (1–24) |
| 3 | 14 | 6/8 | 2.2 ± 1.8 | 3.9 ± 1.7 (3–9) | 4.8 ± 6 (1–24) |
There was no significant difference in the duration of fever or time from the last dose of paracetamol (P = 0.7 and P = 0.94, respectively), or admission rates between the groups.
Patients in the control group were older in comparison with patients in groups 2 and 3 (P = 0.042 and P < 0.001, respectively). The difference in ages between groups 2 and 3 was not statistically significant (P = 0.38)
There were no cases of severe hepatotoxicity. The median AST activity in patients treated with high-dose paracetamol was 55 IU compared with 29 IU and 28 IU in groups 1 and 2, respectively (P = 0.027). There were no significant differences between the groups with respect to urea, creatinine, uric acid, ALT, GGT or ALP.
GSH, GST, GR, GPX and SOD levels in erythrocytes are presented in Table 2.
Table 2.
Glutathione and glutathione-related enzyme content in erythrocytes of patients treated with paracetamol and in controls.
| GSH (µmol gHb−1) mean ± SD | GPX (U min−1 gHb−1) median* | GST (U min−1 gHb−1) median* | GR (U min−1 gHb−1) median* | SOD (U min−1 gHb−1) mean ± SD | |
|---|---|---|---|---|---|
| Group 1 | 5.68 ± 1.88† | 44.98§ | 2.18¶ | 10.18 ± 3.92† | 2353.5 ± 461.8†‡ |
| Group 2 | 4.43 ± 1.54‡ | 38.16§ | 3.17 | 6.74 ± 3.18†† | 2053.2 ± 697.8** |
| Group 3 | 2.27 ± 1.06†‡ | 35.76 | 4.58¶ | 4.54 ± 2.35†,†† | 1497 ± 592.7**† |
Distribution of the data was not normal.
P < 0.001;
P = 0.003;
P = 0.045;
P = 0.04;
P = 0.036;
P = 0.013.
Erythrocyte GSH content (Figure 1) was significantly lower in group 3 compared with groups 1 and 2 (mean differences 3.41 µmol gHb−1, 95% CI 2.10–4.72, and 2.15 µmol gHb−1, 95% CI 0.65–3.65, respectively; P < 0.001 and P = 0.003, respectively). Although patients in group 2 had lower GSH content than patients in the control group, this difference was not significant (mean difference 1.26 µmol gHb−1, 95% CI 0.09–2.10, P = 0.071).
Figure 1.
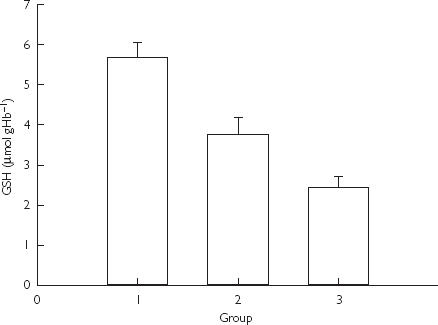
Glutathione (GSH) content in erythrocytes in children treated with paracetamol and in controls. Data presented as mean and standard error (P < 0.001 and P = 0.003 for the difference between group 3 and groups 1 and 2 by anova).
GR activity was significantly lower in febrile patients exposed to recommended and supratherapeutic doses of paracetamol in comparison with controls (mean differences 3.44 µmol min−1 gHb−1, 95% CI 0.63–6.25, and 5.64 µmol min−1 gHb−1, 95% CI 2.90–8.38, respectively; P = 0.013 and P < 0.001, respectively).
Erythrocyte GST activity (Figure 2) was significantly higher in patients treated with high-dose paracetamol compared with controls (mean difference 1.91 µmol min−1 gHb−1, 95% CI 0.57–3.24, P = 0.04). There was no statistically significant difference in GST activity between patients in groups 2 and 3 or between patients in groups 1 and 2.
Figure 2.
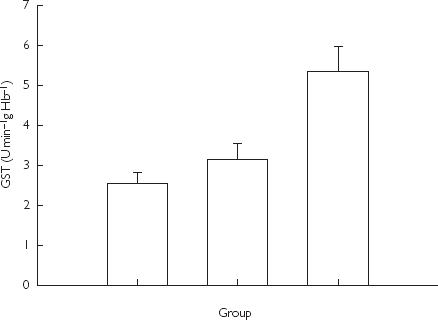
Glutathione S-transferase (GST) activity in erythrocytes in children treated with paracetamol and in controls. Data are presented as group medians and standard deviation (P = 0.04 for differences between groups 3 and 1 by anova).
Erythrocyte GPX activity was lower in patients from group 2 than in patients from group 1 (mean difference 11.5 µmol min−1 gHb−1, 95% CI 1.1–21.9, P = 0.045) (Table 2). SOD activity was significantly lower in patients from group 3 compared with groups 1 and 2 (mean differences 856 U min−1 gHb−1, 95% CI 397–1316, and 556 U min−1 gHb−1, 95% CI 30–1082, respectively; P < 0.001 and P = 0.036) (Table 2).
Mean antioxidant status was 2.066 ± 0.66, 1.86 ± 0.86, and 1.23 ± 0.33 mmol l−1 plasma in groups 1, 2, and 3, respectively. This was significantly lower in group 3 compared with group 1 (mean differences 0.83 mmol l−1 plasma, 95% CI 0.30–1.36, and 0.63 mmol l−1 plasma, 95% CI 0.02–1.24, respectively; P = 0.001 and P = 0.039, respectively).
As there was a significant difference in ages between the groups, we used multiple regression analysis to determine the effects of age and daily paracetamol dose on GR, GST, GPX, GSH and SOD.
Paracetamol dose was the only independent variable affecting GR, GST and SOD levels, with P-values of 0.007, 0.003 and 0.008, respectively.
GSH content was affected by paracetamol dose and age (P < 0.001 and P = 0.021, respectively). The correlation between daily paracetamol dose and GSH is presented in Figure 3.
Figure 3.
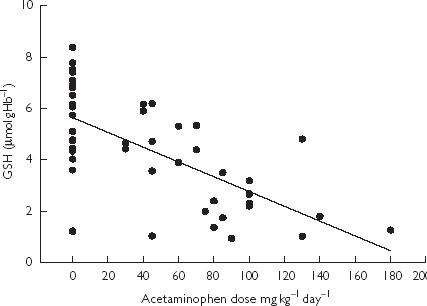
Glutathione (GSH) content in erythrocytes of febrile children treated with paracetamol and controls in relation to dose (R = 0.65).
Discussion
Our data show for the first time that in febrile children, treatment with repeated supratherapeutic doses of paracetamol is associated with reduced erythrocyte glutathione content and antioxidant status.
The major metabolic pathways of paracetamol are glucuronidation and sulphation. Under normal conditions about 5% of paracetamol is metabolized through the cytochrome P450 system, leading to the formation of the highly reactive intermediate NAPQI [11, 12]. NAPQI is conjugated with glutathione and eliminated until glutathione and available liver sulphur stores become critically low. If NAPQI is not removed, it binds to critical intracellular molecules and eventually leads to toxicity and cell death.
Glutathione, in its reduced (GSH) and oxidized (GSSG) forms, is the main intracellular thiol redox system in erythrocytes [13]. One of its major functions is the detoxification of reactive electrophiles and toxic oxygen metabolites generated during the metabolism of endogenous and exogenous substance [14]. Intermediates such as hydrogen peroxide and hydroperoxides are reduced by glutathione peroxidase at the expense of GSH. Oxidized glutathione (GSSG) is reduced by glutathione reductase (GR) in a NADPH-dependent reaction. The normal functioning of this closed system (redox cycle) maintains a high intracellular GSH:GSSG ratio and protects cells against oxidative damage. Many different endogenous and exogenous electrophiles are also detoxified via conjugation with GSH catalysed by glutathione transferase (GST) [15–17].
Drugs that lead to the depletion of GSH or influence the activity of any of these GSH-dependent enzymes may result in toxic responses. Glutathione complexes with NAPQI in the liver [18], depletion of the former increases the risk of hepatotoxicity [18, 19]. There is evidence that glutathione depletion in erythrocytes reflects glutathione depletion in other tissues including liver cells [20]. Although erythrocytes synthesize glutathione, there is an interorgan glutathione cycle, where liver cells transport glutathione into the plasma and erythrocytes [14, 21, 22]. Based on animal studies, it was postulated that an interorgan glutathione redox cycle may be occurring where the liver is central to the reduction of GSSG [23]. It was also shown that other drugs, such as methanol and azathioprine, can cause depletion of both liver and erythrocyte GSH [24–26].
Some animal studies showed that acute paracetamol overdose can deplete erythrocyte glutathione [27, 28], whereas other studies failed to show such an effect [29]. However, repeated paracetamol dosing in rats produced significant changes in glutathione, glutathione-dependent enzymes and antioxidant status [30]. Although the mechanism for the lower glutathione content in our patients is not clear, it may be evidence of depleted intrahepatic glutathione. This hypothesis should be further tested in future studies. A previous study did not demonstrate glutathione depletion in the erythrocytes of children treated with paracetamol [31]. However, unlike our patients, the children in that study were not treated with high doses of paracetamol.
The enzymatic assay [8] used to detect GSH is not totally specific and other nonprotein thiols in the erythrocytes could affect the GSH results. However, GSH is the most abundant nonprotein thiol in the red blood cell, and GSH content measured by HPLC is comparable to that obtained by the enzymatic assay [32, 33]. As the enzymatic assay also used a correction for GSSG, it is reasonable to assume that the reactive thiols are mainly GSH.
The lower SOD activity found in the children treated with repeated supratherapeutic doses of paracetamol is another indication of a reduced antioxidant status. Similar changes have been described in hepatocytes of rats exposed to repeated doses of paracetamol.
In a study by O’Brien et al. [30], rats treated with paracetamol had higher GR activity than the naive animals. It was suggested that this higher GR activity may have a protective effect against paracetamol toxicity. In contrast to these findings, we found lower GR activity in children exposed to repeated high doses of paracetamol, suggesting a lack of this protective mechanism in erythrocytes.
GST content was greater in patients treated with high-dose paracetamol compared with patients receiving therapeutic doses and with controls. Hepatic GST is a sensitive indicator of hepatocellular injury [34]. Compared with naive rats, those exposed to repeated doses of paracetamol have been shown to have higher GST activity in hepatocytes [35]. However, erythrocyte GST differs from hepatic GST [36] and the increase in GST in hepatocytes after exposure to drugs, which involves a higher mRNA expression [35], does not occur in erythrocytes.
The physiological functions of GST in erythrocytes are not fully understood. One role is to catalyse the binding of glutathione to xenobiotics, including paracetamol [14]. Furthermore, higher GST activity in erythrocytes has been described after exposure to oxidative stress [37]. The mechanism for the high GST activity we found in children treated with high-dose paracetamol is not clear. Possible explanations are increased expression of the protein in erythrocytes, as previously described in patients with uraemia [38], or kinetic modulation of the enzyme.
The role of GST in the treatment of chronic supratherapeutic paracetamol toxicity requires further validation and the development of rapid, simple analytical tests [39]. There are other possible explanations for the reduced antioxidative status found in our patients. Decreased calorie intake has been found to be associated with a lowered erythrocyte glutathione content in both animals and human studies [40, 41]. Nonetheless, in humans, only severe malnutrition associated with oedema was associated with low GSH content in erythrocytes [41]. As none of our patients had signs of malnutrition or was oedematous, it is more likely that at least part of the difference in GSH is due to the effect of paracetamol.
Sepsis and inflammation can cause an increased oxidative stress [42]. However, none of our patients had sepsis, there were no differences in the duration of fever between the groups, and patients treated with high-dose paracetamol were not considered to be more ill than patients treated with recommended doses.
The febrile patients were younger than the controls. However, there was no significant age difference between patients treated with high-dose paracetamol and those treated with the recommended doses. Multiple linear regression analysis identified paracetamol dose to be an independent variable affecting GR, GST, GSH and SOD.
Our study has some limitations. First, the dose of paracetamol given to the children was calculated based upon the parent/carer's report, which depended on recall and was prone to reporting bias. We tried to minimize this problem by verifying paracetamol dosage in two different ways. However, the possibility of over- or under-estimation of paracetamol dose cannot be excluded. The methodology used in this study cannot prove a causative effect of paracetamol in decreasing glutathione content as other variables that we did not control may have affected the outcome.
Rivera-Penera et al. [3] suggested that in sick children who receive multiple, supratherapeutic doses of the drug, the therapeutic index for paracetamol may be much lower than that associated with intermittent, therapeutic administration of the drug. It is important to note that the studies [2–6] reporting liver failure after repeated doses of paracetamol in children are case reports or case series. It is possible that in some of these reports the infectious disease itself caused the liver disease, not exposure to paracetamol. Given that millions of children are treated with paracetamol worldwide, and the few cases of hepatotoxicity reported to date, liver damage is probably a rare phenomenon. Our findings may suggest an explanation for this observation. Further studies are needed to assess the role of repeated supratherapeutic doses of paracetamol in depleting intrahepatic glutathione, and to evaluate whether changes in GSH and glutathione-related enzymes in erythrocytes, following paracetamol treatment, are related to an increased risk of liver damage.
References
- 1.Kogan MD, Pappas G, Yu SM, Kotelchuck M. Over-the-counter medication use among US preschool-age children. JAMA. 1994;272:1025–1030. [PubMed] [Google Scholar]
- 2.Eriksson LS, Broome U, Klain M, Lindholm M. Hepatotoxicity due to repeated intake of low dose of paracetamol. J Intern Med. 1992;231:567–570. doi: 10.1111/j.1365-2796.1992.tb00976.x. [DOI] [PubMed] [Google Scholar]
- 3.Rivera-Penera T, Gugig R, Davis J, et al. Outcome of acetaminophen overdose in pediatric patients and factors contributing to hepatotoxicity. J Pediatr. 1997;130:300–304. doi: 10.1016/s0022-3476(97)70359-7. [DOI] [PubMed] [Google Scholar]
- 4.Pershad J, Nichols M, King W. The silent killer: chronic acetaminophen toxicity in a toddler. Pediatr Emerg Care. 1999;15:43–46. [PubMed] [Google Scholar]
- 5.Heubi JE, Barbacci MB, Zimmerman HJ. Therapeutic misadventures with acetaminophen: hepatotoxicity after multiple doses in children. J Pediatr. 1998;132:22–27. doi: 10.1016/s0022-3476(98)70479-2. [DOI] [PubMed] [Google Scholar]
- 6.Miles FK, Kamath R, Dorney SF, Gaskin KL, O'Loughlin EV. Accidental paracetamol overdosing and fulminant hepatic failure. Med J Aust. 1999;171:472–475. doi: 10.5694/j.1326-5377.1999.tb123750.x. [DOI] [PubMed] [Google Scholar]
- 7.Beutler E, Blume KG, Kaplan JC, Lohr GW, Ramot B, Valentine WN. International Committee for Standardization in Haematology: recommended methods for red-cell enzyme analysis. Br J Haematol. 1977;35:331–340. doi: 10.1111/j.1365-2141.1977.tb00589.x. [DOI] [PubMed] [Google Scholar]
- 8.Beutler E, Duron O, Kelly BM. Improved method for the determination of blood glutathione. J Lab Clin Med. 1963;61:882–890. [PubMed] [Google Scholar]
- 9.Habig WH, Pabst MJ, Jakoby WB. Glutathione-S-transferase. J Biol Chem. 1974;249:7130–7139. [PubMed] [Google Scholar]
- 10.Miller NJ, Rice-Evans C, Davies MJ, Gopinathan V, Milner A. A novel method for measuring antioxidant capacity and its application to monitoring the antioxidant status in premature neonates. Clin Sci. 1993;84:407–412. doi: 10.1042/cs0840407. [DOI] [PubMed] [Google Scholar]
- 11.Dahlin DC, Miwa GT, Lu AY, Nelson SD. N-acetyl-p-benzoquinone imine: a cytochrome P-450-mediated oxidation product of acetaminophen. Proc Natl Acad Sci USA. 1984;81:1327–1331. doi: 10.1073/pnas.81.5.1327. [DOI] [PMC free article] [PubMed] [Google Scholar]
- 12.Coles B, Wilson I, Wardman P, Hinson JA, Nelson SD, Ketterer B. The spontaneous and enzymatic reaction of N-acetyl-p-benzoquinonimine with glutathione: a stopped-flow kinetic study. Arch Biochem Biophys. 1988;264:253–260. doi: 10.1016/0003-9861(88)90592-9. [DOI] [PubMed] [Google Scholar]
- 13.Dumaswala UJ, Zhuo L, Mahajan S, et al. Glutathione protects chemokine-scavenging and antioxidative defense functions in human RBCs. Am J Physiol Cell Physiol. 2001;280:C867–C873. doi: 10.1152/ajpcell.2001.280.4.C867. [DOI] [PubMed] [Google Scholar]
- 14.Meister A. Metabolism and function of glutathione. Trends Bioch Sci. 1981;6:231–233. [Google Scholar]
- 15.Dirven HA, Megens L, Oudshoorn MJ, Dingemanse MA, van Ommen B, van Bladeren PJ. Glutathione conjugation of the cytostatic drug ifosfamide and the role of human glutathione S-transferases. Chem Res Toxicol. 1995;8:979–986. doi: 10.1021/tx00049a012. [DOI] [PubMed] [Google Scholar]
- 16.Paumi CM, Ledford BG, Smitherman PK, Townsend AJ, Morrow CS. Role of multidrug resistance protein 1 (MRP1) and glutathione S-transferase A1–1 in alkylating agent resistance. Kinetics of glutathione conjugate formation and efflux govern differential cellular sensitivity to chlorambucil versus melphalan toxicity. J Biol Chem. 2001;276:7952–7956. doi: 10.1074/jbc.M009400200. [DOI] [PubMed] [Google Scholar]
- 17.Roy B, Chowdhury A, Kundu S, et al. Increased risk of antituberculosis drug-induced hepatotoxicity in individuals with glutathione S-transferase M1 ‘null’ mutation. J Gastroenterol Hepatol. 2001;16:1033–1037. doi: 10.1046/j.1440-1746.2001.02585.x. [DOI] [PubMed] [Google Scholar]
- 18.Gillette JR. An integrated approach to the study of chemically reactive metabolites of acetaminophen. Arch Intern Med. 1981;141:375–379. doi: 10.1001/archinte.141.3.375. [DOI] [PubMed] [Google Scholar]
- 19.Mitchell JR, Jollow DJ, Potter WZ, Gillette JR, Brodie BB. Acetaminophen-induced hepatic necrosis. IV. Protective role of glutathione. J Pharmacol Exp Ther. 1973;187:211–217. [PubMed] [Google Scholar]
- 20.Siems W, Mueller M, Garbe S, Gerber G. Damage of erythrocytes by activated oxygen generated in hypoxic rat liver. Free Radic Res Commun. 1987;4:31–39. doi: 10.3109/10715768709088086. [DOI] [PubMed] [Google Scholar]
- 21.Dass PD, Bermes EW, Jr, Holmes EW. Renal and hepatic output of glutathione in plasma and whole blood. Biochim Biophys Acta. 1992;1156:99–102. doi: 10.1016/0304-4165(92)90102-z. [DOI] [PubMed] [Google Scholar]
- 22.McIntyre TM, Curthoys NP. The interorgan metabolism of glutathione. Int J Biochem. 1980;12:545–551. doi: 10.1016/0020-711x(80)90005-1. [DOI] [PubMed] [Google Scholar]
- 23.Punekar NS. Is there an inter-organ glutathione redox cycle? Indian J Biochem Biophys. 1991;28:496–498. [PubMed] [Google Scholar]
- 24.Skrzydlewska E, Farbiszewski R. Glutathione consumption and inactivation of glutathione-related enzymes in liver, erythrocytes and serum of rats after methanol intoxication. Arch Toxicol. 1997;71:741–745. doi: 10.1007/s002040050455. [DOI] [PubMed] [Google Scholar]
- 25.Skrzydlewska E, Farbiszewski R. Lipid peroxidation and antioxidant status in the liver, erythrocytes, and serum of rats after methanol intoxication. J Toxicol Environ Health. 1998;53:637–649. doi: 10.1080/009841098159088. [DOI] [PubMed] [Google Scholar]
- 26.Kaplowitz N. Interaction of azathioprine and glutathione in the liver of the rat. J Pharmacol Exp Ther. 1977;200:479–486. [PubMed] [Google Scholar]
- 27.Suhail M, Ahmad I. In vivo effects of acetaminophen on rat RBC and role of vitamin E. Indian J Exp Biol. 1995;33:269–271. [PubMed] [Google Scholar]
- 28.Gaunt SD, Baker DC, Green RA. Clinicopathologic evaluation of N-acetylcysteine therapy in toxicosis in the cat. Am J Vet Res. 1981;42:1982–1984. [PubMed] [Google Scholar]
- 29.Miller DJ, Pichanick GG, Fiskerstrand C, Saunders SJ. Experimental liver necrosis: hepatic erythrocyte sequestration as a cause of acute anemia. Am J Dig Dis. 1977;22:1055–1059. doi: 10.1007/BF01072856. [DOI] [PubMed] [Google Scholar]
- 30.O'Brien PJ, Slaughter MR, Swain A, et al. Repeated acetaminophen dosing in rats: adaptation of hepatic antioxidant system. Hum Exp Toxicol. 2000;19:277–283. doi: 10.1191/096032700678815918. [DOI] [PubMed] [Google Scholar]
- 31.Bernal MLR, Sinues BP, Lanuza JG, Gracia MC, Mayayo ED, Bartolome MR. Reduced erythrocyte glutathione and urinary thioethers in children undergoing treatment with paracetamol. An Esp Pediatr. 1993;39:501–505. [PubMed] [Google Scholar]
- 32.Mills BJ, Richie JP, Jr, Lang CA. Sample processing alters glutathione and cysteine values in blood. Anal Biochem. 1990;184:263–267. doi: 10.1016/0003-2697(90)90678-3. [DOI] [PubMed] [Google Scholar]
- 33.Richie JP, Jr, Lang CA. The determination of glutathione, cyst(e)ine, and other thiols and disulfides in biological samples using high-performance liquid chromatography with dual electrochemical detection. Anal Biochem. 1987;163:9–15. doi: 10.1016/0003-2697(87)90085-6. [DOI] [PubMed] [Google Scholar]
- 34.Beckett GJ, Hayes JD. Plasma glutathione S-transferase measurements and liver disease in man. J Clin Biochem Nutr. 1987;2:1–24. [Google Scholar]
- 35.Dalhoff K, Laursen H, Bangert K, et al. Autoprotection in acetaminophen intoxication in rats: the role of liver regeneration. Pharmacol Toxicol. 2001;88:135–141. doi: 10.1034/j.1600-0773.2001.d01-94.x. [DOI] [PubMed] [Google Scholar]
- 36.Kurata M, Suzuki M, Agar NS. Antioxidant systems and erythrocyte life-span in mammals. Comp Biochem Physiol B. 1993;106:477–487. doi: 10.1016/0305-0491(93)90121-k. [DOI] [PubMed] [Google Scholar]
- 37.Neefjes VM, Evelo CT, Baars LG, Blanco CE. Erythrocyte glutathione S transferase as a marker of oxidative stress at birth. Arch Dis Child Fetal Neonatal Ed. 1999;81:F130–F133. doi: 10.1136/fn.81.2.f130. [DOI] [PMC free article] [PubMed] [Google Scholar]
- 38.Galli F, Rovidati S, Benedetti S, et al. Overexpression of erythrocyte glutathione S-transferase in uremia and dialysis. Clin Chem. 1999;45:1781–1788. [PubMed] [Google Scholar]
- 39.Beckett GJ, Foster GR, Hussey AJ, et al. Plasma glutathione S-transferase and F protein are more sensitive than alanine aminotransferase as markers of paracetamol (acetaminophen)-induced liver damage. Clin Chem. 1989;35:2186–2189. [PubMed] [Google Scholar]
- 40.Jahoor F, Wykes LJ, Reeds PJ, Henry JF, del Rosario MP, Frazer ME. Protein-deficient pigs cannot maintain reduced glutathione homeostasis when subjected to the stress of inflammation. J Nutr. 1995;125:1462–1472. doi: 10.1093/jn/125.6.1462. [DOI] [PubMed] [Google Scholar]
- 41.Reid M, Badaloo A, Forrester T, et al. In vivo rates of erythrocyte glutathione synthesis in children with severe protein-energy malnutrition. Am J Physiol Endocrinol Metab. 2000;278:E405–E412. doi: 10.1152/ajpendo.2000.278.3.E405. [DOI] [PubMed] [Google Scholar]
- 42.Taylor DE, Piantadosi CA. Oxidative metabolism in sepsis and sepsis syndrome. J Crit Care. 1995;10:122–135. doi: 10.1016/0883-9441(95)90003-9. [DOI] [PubMed] [Google Scholar]