

Abstract
Aims
To investigate CYP3A activity in cancer and noncancer Asian patients using midazolam and to reveal possible alternative traits for phenotyping CYP3A.
Methods
Intravenous midazolam 2.5 mg or 2.5–8 mg was administered to 27 cancer and 24 noncancer patients, respectively. Plasma was sampled at 0, 0.25, 0.5, 1, 1.5, 2, 3.5 and 5 h after intravenous ultrashort, 30 s infusion. Plasma midazolam and 1′-hydroxymidazolam concentrations were determined using GCMS. The disposition of midazolam and 1′-hydroxymidazolam in these patients was compared. Midazolam clearance was correlated with dose-normalized plasma midazolam concentrations (concentration/per dose).
Results
Clearance (CL) and steady state volume of distribution (Vss) of midazolam (mean ± SD, 95% confidence level) in cancer (424 ± 155, 61.3 ml min−1; 1.21 ± 0.46, 0.18 l kg−1) and noncancer (407 ± 135, 57.1 ml min−1; 1.15 ± 0.33, 0.155 l kg−1) patients, respectively, were not different and comparable with published data. Clearance variability was 4–5 fold in both groups. Midazolam clearance correlated significantly with all plasma concentration/per dose at and after the 1-h time point, with a minimum correlation coefficient of r = 0.752, P < 0.001.
Conclusions
CYP3A activities determined with different doses of midazolam in cancer and noncancer Asian patients showed variability of 4–5-fold and were not different between groups. One to two-fold plasma midazolam concentrations per dose may be feasible as a simple alternative phenotypic trait for hepatic CYP3A activity determination.
Keywords: cancer and noncancer Asian patients, CYP3A, midazolam
Introduction
Cytochrome P450 3A (CYP3A) in adults, which usually includes CYP3A4 and CYP3A5, is involved in the metabolism of many structurally different therapeutic drugs [1], including cyclosporin [2], erythromycin [3], midazolam [4], nifedipine [5], docetaxel [6]. The enzymes are present in intestinal epithelium and the liver, leading to variability in first-pass metabolism after oral administration, as well as variability with systemic administration. Additional potential variability arises because of drug–drug interactions relating to enzyme induction and inhibition [1]. Therefore wide interindividual variability is a major characteristic, although the enzyme activity appears to be unimodally distributed [7]. An appropriate in vivo probe or a convenient phenotypic trait for the determination of the enzyme activity would be advantageous, especially if this can predict the pharmacokinetics of another more toxic drug. A number of anticancer agents (e.g. taxanes, etoposide, tamoxifen, Vinca alkaloids) are metabolized by CYP3A enzymes [8]. Phenotyping of CYP3A activity to predict the clearance of anticancer agents would be useful for optimizing cancer therapeutics. Yamamoto et al. [9] reported that docetaxel clearance could be predicted by measuring total 24-h urinary 6β-hydroxycortisol after an intravenous dose of hydrocortisone 300 mg.
A number of in vivo CYP3A probes have been used [10–12]. For example, the CYP3A-mediated hydroxylation of cortisol can be estimated by measuring the 6β-hydroxycortisol : cortisol ratio in urine and the CYP3A-mediated N-demethylation of 14C-erythromycin, whereby 14CO2, the end product in the erythromycin breath test, is measured. A slightly more recent method is the CYP3A-mediated hydroxylation of midazolam (MDZ) to its major metabolite 1′-hydroxymidazolam (1′-OH-MDZ) and the minor metabolite 4′-hydroxymidazolam. All three methods do not correlate well with each other [13]. The most widely accepted and tested probes are the 14C-erythromycin breath test and MDZ clearance (CL). MDZ appears to have many advantages as a probe. CYP3A activity determined with MDZ includes both CYP3A4 and CYP3A5. It is not a substrate of P-glycoprotein [14]. The in vivo activity correlates with in vitro estimations using intestinal or hepatic microsomes. Inhibitors and inducers of CYP3A produce expected changes in MDZ CL [12, 15–18]. MDZ can be administered orally to investigate first-pass metabolism and intravenously for primary systemic clearance by hepatic metabolism. Systemic CL of MDZ is a good phenotypic indicator of liver CYP3A function [12].
The plasma ratio of metabolite 1′-OH-MDZ to the parent MDZ (1′-OH- MDZ/MDZ) at the 30-min time point after intravenous MDZ in liver transplant patients has been reported to be a good phenotypic trait because it correlates well with MDZ CL [15, 19]. However, this phenotypic trait has been found to be less useful in other nonliver transplant patients [20]. Phenotyping CYP3A activity using systemic MDZ CL has the disadvantage of requiring numerous blood samples from each individual. Recently, methods using single-point plasma MDZ [21] and limited sampling strategy [22] to predict CYP3A phenotype or MDZ AUC, respectively, have been reported.
Ethnic differences in hepatic CYP3A activity as measured using MDZ have also been studied in different ethnic groups. CYP3A activity was found to be slightly lower in Japanese men when compared with European-Americans, but the difference became insignificant when body weight was taken into account [23]. Body weight appears to be an important determinant of the wide variability. Similarly, no difference in pharmacokinetics was reported by Balson et al. [24] between Vietnamese and Caucasian subjects. Inter-racial/ethnic differences for nimodipine, another CYP3A substrate, were also not observed [25]. The objectives of this present study were: firstly, to investigate the pharmacokinetics of intravenous MDZ in cancer and noncancer Asian patients, and secondly, using MDZ systemic clearance as the reference phenotypic CYP3A activity, to investigate alternative phenotypic traits for CYP3A activity.
Methods
Patients
Cancer patients and noncancer patients were recruited from the National University Hospital. The study was approved by the Hospital Ethics Committee and the Ministry of Health, Singapore. Written consent was obtained from all patients.
The cancer patients had the following characteristics: a histological or cytological proven solid malignancy, refractory to standard therapies or for which docetaxel is indicated; > 18 years old; a baseline Karnofsky performance score of 60% or more; an adequate haematopoietic (absolute neutrophil count ≥ 1.5 × 10⁹ l−1, platelet count ≥ 100 × 109 l−1, total white blood cell count ≥ 3.0 × 10⁹ l−1, haemoglobin ≥ 9.0 g dl−1), hepatic (bilirubin ≤ 3.0 mg dl−1, aspartate and/or alanine transaminases ≤ five times upper limit of normal) and renal (serum creatinine ≤ 2.0 mg dl−1) function; and a life expectancy of more than 12 weeks at study entry. Patients who had any of the following were ineligible: received systemic biological or cytotoxic therapy in the previous 4 weeks (6 weeks for nitrosoureas and mitomycin C); prior treatment with docetaxel; extensive radiotherapy to more than 25% of the bone marrow within the previous 4 weeks; active brain metastases; or severe intercurrent systemic disease. For these cancer patients, MDZ was administered 2 days before docetaxel was given.
Noncancer patients were a more heterogeneous group. They were eligible if they had no known liver cirrhosis, no severe conditions, e.g. cardiac disease, renal disease or infections. They were given MDZ at titrated doses for minor procedures, mainly colonoscopy and bone marrow aspiration/biopsy.
All patients who had received medications known to be CYP3A substrates, inhibitors and inducers (listed in Table 1) in the month prior to study entry were excluded.
Table 1.
Demography of cancer and noncancer patient groups.
| Sex (F : M) | Race* (C : M : I : O) | Age (years) | Weight (kg) | Height (cm) | Type of cancer or type of procedure | |
|---|---|---|---|---|---|---|
| Cancer (All 27) | 14 : 13 | 23 : 2 : 1 : 0 | 55.9 ± 8.2 | 54.0 ± 10.6 | 159.2 ± 10.3 | Lung 16, gastric 5, breast 3, unknownprimary 2, colorectal 1 |
| Cancer (F 14) | 11 : 2 : 1 : 0 | 52† ± 7.9 | 50.4 ± 9.9 | 151.1‡ ± 4.3 | ||
| Cancer (M 13) | 13 : 0 : 0 : 0 | 60.2† ± 6.3 | 57.9 ± 10.3 | 167.3‡ ± 7.7 | ||
| Noncancer (All 24) | 7 : 17 | 13 : 7 : 3 : 1 | 51.8 ± 17.3 | 65.9 ± 13.9 | 163 ± 8.0 | Colonoscopy 14, bone marrow aspiration 8,sigmoidoscopy 1,** OGD 1 |
| Noncancer (F 7) | 3 : 2 : 2 : 0 | 57.8 ± 23 | 67.7 ± 24.7 | 152.3 ± 5.9 | ||
| Noncancer (M 17) | 10 : 5 : 1 : 1 | 49.6 ± 15 | 65.4 ± 11.0 | 165.1 ± 6.6 |
Ethnic origin: C, Chinese; M, Malays; I, Indians, O, others.
OGD, oesophageal-gastro-duodenoscopy.
P < 0.01 between values
P < 0.0001 between values. Cancer patients according to protocol have adequate haematological, hepatic and renal function as stated in text. Noncancer patients according to protocol have no clinical liver cirrhosis, nor severe active cardiac, renal disease or infections. All patients were screened for presence of known CYP3A substrates (benzphetamine, clarithromycin, codeine, cyclosporin, dapsone, diazepam, erythromycin, felodipine, tacrolimus, indinavir, lovastatin, midazolam, nifedipine, carbamazepine, lorsartan, quinidine, taxol, terfenadine, verapamil), inhibitors (ketoconazole, itraconazole, troleandomycin) and inducers (barbiturates, dexamethasone, rifampicin).
Intravenous midazolam hydrochloride (5 mg in 5 ml vials) was obtained from Hoffmann-La Roche Ltd, (Basle, Switzerland). All cancer patients received 2.5 mg while noncancer patients received varying doses (2.5–8 mg) of MDZ as an ultra-short infusion over 30 s. Blood samples were obtained from patients at 0, 0.25, 0.5, 1, 1.5, 2, 3.5 and 5 h after MDZ infusion from the contralateral arm into heparinized tubes. These samples were immediately centrifuged at 1000 g and the supernatant separated and stored in plain tubes at −20 °C until analysis.
Analysis of midazolam and 1′-hydroxymidazolam
MDZ reference standard was a gift from Hoffmann-La Roche Ltd. 1′-OH-MDZ was purchased from Ultrafine (Manchester, UK). N-(tert-butyldimethylsily)-N-methyltrifluoroacetamide (MTBSTFA) was purchased from Aldrich Chemical Co. (WI, USA). All other reagents and solvents used were analytical grade. The carrier gas, He of 99.9995% purity, was from Singapore Oxygen Air Liquid Pte Ltd, Singapore.
MDZ and 1′-OH-MDZ concentrations were measured using selected ion monitoring (SIM) gas chromatography mass spectrophotometry (GCMS) modified from Thummel et al. [15]. Briefly, plasma samples with added diazepam and temazepam as internal standards were extracted using liquid/liquid extraction. Plasma was alkalinized with NaHCO3, pH 11, and extracted into toluene/ : isoamyl alcohol (19 : 1). The dried and oxygen-free supernatant was derivatized with MTBSTFA to render it volatile for GCMS analysis. The derivatized mixture (2 µl) was injected (splitless mode, injector temperature 260 °C) into the Hewlett Packard gas chromatograph (HP 5890 series II plus; Agilent Technologies, Delaware, USA) connected to a mass selective detector (HP 5972 A) operating in the electron impact mode (70eV). Analytes were separated using a HP 50+ capillary column (30 m × 0.32 mm inner diameter, 0.25 µm film thickness; Agilent Technologies), with a flow rate for the carrier gas (He) of 1 ml min−1. The oven temperature started at 160 °C for 1 min, then increased 5 °C min−1 to 280 °C and was held for 7 min. The transfer line was 280 °C. Selected ions were 256.2 m/z, 310.2 m/z, 357.3 m/z and 398.3 m/z for diazepam, MDZ, temazepam and 1′-OH-MDZ, respectively. Calibration curves using prepared standards in drug-free plasma showed linearity between 1 and 100 ng ml−1 for MDZ and 0.5–30 ng ml−1 for 1′-OH-MDZ (r = 0.9998 for both MDZ and 1′-OH-MDZ). The lower limits of quantification (LLOQ) for MDZ and its 1′-OH-MDZ metabolite were 1 ng ml−1 and 0.5 ng ml−1, respectively. The coefficient of variation of the inter- and intra-day precision of the quality-control samples (3, 40 and 80 ng ml−1 for MDZ; 1.5, 15 and 25 ng ml−1 for 1′-OH-MDZ) ranged from 4.9% to 11.5% and accuracy ranged from 87% to 109%.
Pharmacokinetic analysis
The plasma concentration data were analysed using non-compartmental (NCA) pharmacokinetic analysis with Kinetica® 2001 software (Innaphase Corporation). The area under the concentration-time curve (AUC) and the elimination rate constant (k) were computed. AUC was obtained using mixed log linear AUC option and AUC(0,∞) from calculated last concentration/k. Total AUC (AUC(total)) is sum of AUC(to last concentration) and AUC(0,∞). The ratio of total AUC between metabolite 1′-OH-MDZ and parent drug MDZ (AUCm/AUCp) as well as the half-lives of both MDZ and 1′-OH-MDZ were calculated.
Equations used for determinations of parameters are: Clearance,
 |
Mean residence time,
 |
Half-life,
 |
Steady state volume of distribution,
 |
Using MDZ systemic clearance (MDZ CL) as a reference standard CYP3A activity, correlations were analysed with the ratio of plasma 1′-OH-MDZ : MDZ at all time points especially the 30- and 60-min time points. MDZ CL was also correlated with plasma midazolam concentrations normalized for dose (concentration per dose) at different time points.
Results were expressed as mean ± SD except for MRT, where harmonic mean was used. Statistical tests used were nonparametric two independent samples Mann–Whitney and Kolmogorov–Smirnov tests, linear regression, and stepwise regression (SPSS 11.0; SPSS Inc., IL, USA). A value of P < 0.05 was considered to be statistically significant.
Results
The demography of the 27 cancer and 24 noncancer patients is listed in Table 1. Cancer patients all had adequate haematological, hepatic and renal function as stated in the study protocol. The majority had lung cancer (16 patients) or gastric cancer (5 patients). The noncancer patients according to protocol did not have liver cirrhosis, severe active cardiac or renal disease, or infections. They were given titrated dosages of MDZ mainly for colonoscopy (14 patients) or bone marrow aspiration/biopsy (8 patients). The sex and race distribution for the two groups was different. None of the patients was on medications that were known substrates, inhibitors or inducers of CYP3A.
Figure 1 shows the concentration–time curves of MDZ and 1′-OH-MDZ in cancer and noncancer patients. Mean curves could not be plotted because different doses were administered in the noncancer group. Concentrations of the metabolite 1′-OH-MDZ were always below that of MDZ in cancer patients. In two noncancer patients, ratios of 1′-OH-MDZ : MDZ were much higher, reaching 2 at the 3. 5-h sample and 4.7 at the 5-h sample. The AUCm : AUCp ratios for these two patients were 1.06 and 3.68, respectively. These two patients were given the 5-mg MDZ dose. However, their MDZ CL was 310 and 388 ml min−1, respectively, which was not higher compared with the other patients, as would have been expected.
Figure 1.
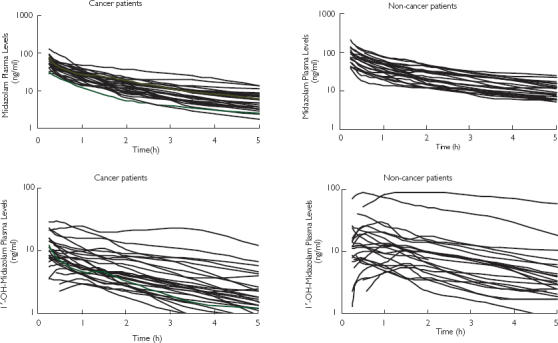
Concentration-time curves of midazolam (MDZ) and 1′-OH-MDZ in cancer (2.5 mg dose, n = 27) and noncancer (2.5–8 mg dose, n = 24) patients after ultrashort i.v. infusion of midazolam.
Table 2 shows the pharmacokinetic parameters (mean ± SD) of MDZ in cancer and noncancer patient groups and for females and males. AUCm : AUCp ratios and t1/2,z of 1′-OH-MDZ are listed for the two groups. Noncancer patients were given variable and higher doses of MDZ than cancer patients and indeed, AUCtotal (P = 0.0001) was significantly higher (Mann-Whitney test). Even the t1/2,z (P = 0.027) and MRT (P = 0.009) were significantly higher (Mann-Whitney test) in the noncancer than in the cancer group. However, MDZ CL (P = 0.97), volume of distribution at steady state (P = 0.966), ratio of AUCm : AUCp (P = 0.962) and t1/2,z of 1′-OH-MDZ (P = 0.380) between the two groups were not statistically different. Two-sample Kolmogorov-Smirnov test (P = 0.776) showed that the shape of distribution of MDZ CL in the two groups was very similar. The variation of MDZ CL in cancer patients was about 4.7 fold while that in the noncancer patients was 4 fold (Figure 2).
Table 2.
Pharmacokinetic parameters (mean ± SD) of midazolam in cancer and noncancer patient groups.
| † Patient group | Dose (mg) | AUCtot (ng ml−1 h) | Half-life MDZ (h) | † MRT (h) | CL (ml min−1) | Vss (l kg−1) | § AUCm : AUCp ratio | Half-life 1′-OH-MDZ (h) |
|---|---|---|---|---|---|---|---|---|
| Cancer (all 27) | 2.5* | 113.2 ± 47.4* | 2.31 ± 0.95* | 2.35 ± 1.18* | 424 ± 155 | 1.21 ± 0.46 | 0.325 ± 0.145 | 2.57 ± 1.03 |
| Cancer (F 14) | 2.5 | 113.5 ± 64 | 2.44 ± 1.26 | 2.18 ± 1.59 | 461 ± 193 | 1.35 ± 0.56 | ||
| Cancer (M 13) | 2.5 | 112.9 ± 20.7 | 2.16 ± 0.45 | 2.56 ± 0.53 | 384 ± 90 | 1.06 ± 0.27 | ||
| Noncancer (all 24) | 4.29 ± 1.35* | 193.8 ± 85.2* | 2.72 ± 0.88* | 2.98 ± 1.09* | 407 ± 135 | 1.15 ± 0.33 | 0.452 ± 0.334 | 2.79 ± 1.06 |
| Non-Cancer (F 7) | 3.43 ± 1.1 | 147.8 ± 58.4 | 2.93 ± 0.92 | 3.37 ± 1.17 | 420 ± 149 | 1.35 ± 0.20 | ||
| Noncancer (M 17) | 4.64 ± 1.3 | 212.7 ± 88.6 | 2.63 ± 0.88 | 2.85 ± 1.07 | 401 ± 133 | 1.1 ± 0.34 |
All patients or F = female and M = male in patient groups. † MRT expressed as harmonic mean.
AUCm : AUCp ratio is the ratio of total AUC of 1′OH-MDZ : total AUC of MDZ.
P < 0.05; significantly different between cancer and noncancer groups using nonparametric Mann–Whitney test for two independent samples.
Figure 2.
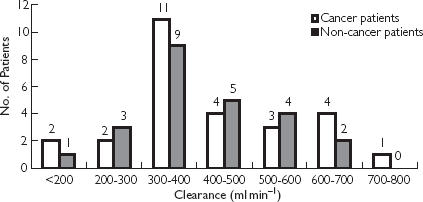
Histogram of midazolam clearance in cancer and noncancer patient groups after ultrashort i.v. infusion of midazolam.
Distribution of males and females in the cancer patient group was about equal. Females appeared to have a more varied and slightly higher mean MDZ CL (461 ± 193 ml min−1) but this was not significantly different from that in male cancer patients (384 ± 90 ml min−1, P = 0.225, Mann-Whitney test). When weights of patients were taken into account the MDZ CL kg−1 in females (9 ± 3.8 ml min−1 kg−1) was still not statistically different from that in males (6.8 ± 2.2 ml min−1 kg−1), P = 0.089, Mann-Whitney test).
When MDZ CL was correlated with 1′-OH-MDZ : MDZ concentration ratio at 30 min and 1 h in the cancer group, a slight correlation (r = 0.48, P < 0.05) for both at 30 min and at 1 h was observed. Correlations were poorer for later time points. As for the noncancer group, no correlation (r = 0.15, P = 0.54 and r = 0.17, P = 0.46 at 30 min and 1 h, respectively) was observed even when the different dosages used were normalized.
As MDZ CL from the two groups of patients had similar distribution and values, CL data were pooled together, resulting in a combined group containing 51 sets of data. MDZ CL was linearly regressed with the plasma concentrations of MDZ/ per mg dose (concentration/ per dose) at the various sampling time points. Table 3 shows the linear regression correlation coefficients (r) between MDZ CL and MDZ concentration/ per dose for (a) the cancer group, (b) the noncancer group and (c) the combined group. From the 1-h time point onwards, the MDZ CL correlated significantly with MDZ concentration/ per dose. The lowest r = 0.752, and the highest r = 0.899 were from the noncancer group at the 1-h and 3. 5-h time points, respectively.
Table 3.
Linear regression coefficients (r) between midazolam clearance (MDZ CL) and MDZ concentration/dose at different sampling time points.
| Concentration per dose at time points (h) | Cancer group n = 27 | Noncancer group n = 24 | Combined groups n = 51 |
|---|---|---|---|
| 0.25 | 0.64 | 0.63 | 0.62 |
| 0.5 | 0.69 | 0.67 | 0.66 |
| 1 | 0.866 | 0.752 | 0.802 |
| 1.5 | 0.821 | 0.81 | 0.807 |
| 2 | 0.817 | 0.857 | 0.827 |
| 3.5 | 0.803 | 0.899 | 0.841 |
| 5 | 0.808 | 0.853 | 0.823 |
| 1 h and 2 h | 0.891 | 0.850 | 0.847 |
| Stepwise regression | 0.952 (1 h and 5 h) | 0.899 (3.5 h) | 0.912 (1 h and 5 h) |
| 0.889 (1 h and 5 h) |
Regressions with two time points (early time points 1 and 2 h concentration/ per dose) resulted in improved correlation coefficients (Table 3). Stepwise regression showed that the 1 h and 5 h concentration/ per dose were the two most significant time points for the cancer and combined groups. The best correlation for the noncancer group was the 3. 5-h time point. Linear relationships were: cancer group [CL = −29.7 × (1 h) + −64.7 × (5 h) + 876.2; r = 0.954]; noncancer group [CL = −85.8 (3.5 h) + 713.3; r = 0.899 or CL = −13.4 × (1 h) + −69.5 × (5 h) + 716.6; r = 0.889] and combined group [CL = −21.8 × (1 h) + −66.3 × (5 h) + 794.2; r = 0.912].
Discussion
Demography and administered doses in the cancer and noncancer groups were different and this resulted in significant differences in some pharmacokinetic values such as AUC. However, the pharmacokinetic parameters of MDZ CL, Vss, and AUCm : AUCp ratios were not different between groups (Table 2).
Midazolam CL in cancer and noncancer Asian patients was similar and varied by about 4–5 fold (Figure 2). Mean MDZ CL in males was 384 and 401 ml min−1 in cancer and noncancer groups, respectively. These were between the values reported for healthy young American (412 ml min−1), young Japanese (311 ml min−1) [23] and young Vietnamese (300 ml min−1) [24] men. The mean age for the male cancer and noncancer groups was 60 and 50 years, respectively, while the mean age of healthy American, Japanese and Vietnamese men was 25–30 years. Albrecht et al. [26] reported that MDZ CL is not affected by age [MDZ CL, 388 ml min−1 in elderly (67–81 years) men vs 399 ml min−1 in young (24–28 years) men]. The female cancer group did show a higher, but not significant (P = 0.089) MDZ CL kg−1. Thummel et al. [20] also did not report a sex difference in MDZ CL. Midazolam CL in cancer and noncancer Asian patients was comparable with reported values.
MDZ was used as a probe drug for hepatic CYP3A activity to relate it to docetaxel pharmacokinetics [27]. The dose used (2.5 mg) for cancer patients was higher than the usual recommended dose [7] for MDZ as a probe for CYP3A. As for the noncancer patients, dosages varied depending on the patient's and the procedural requirement. Only one male patient received 8 mg for bone marrow aspiration. Except for the higher AUC as expected, this patient's other parameters (CL 353.3 ml min−1 and Vss 75.2 l) were no different from other patients. The different dosages did not seem to affect the pharmacokinetics significantly. MDZ pharmacokinetics at these intravenous (i.v.) doses seemed linear, similar to that reported for oral dosages of up to 40 mg [28] and 15 mg [29].
The mean AUCm : AUCp ratios (< 0.5) between the two groups were not significantly different. However, in two noncancer patients the ratios were > 1, but their MDZ CL was not different from other patients. 1′-OH-MDZ rapidly conjugates to form its glucuronide and is excreted. In renal impairment, elimination of the conjugate may be impaired [16, 28, 30]. It is therefore likely that these two patients might have had compromised renal function that was not revealed as severe renal disease in the medical history. The accumulated conjugate could have been unconjugated by the bioanalytical process and quantified as well.
t1/2,z of 1′-OH-MDZ was quite similar to MDZ, as found by others [29, 31, 32], and was not different between the two groups of patients. This t1/2,z is the apparent rate, as the rate of 1′-OH-MDZ formation is rate-limiting in MDZ pharmacokinetics [32]. The actual t1/2,z of 1′-OH-MDZ is much shorter [32].
Confirming other reports, the ratio 1′-OH-MDZ : MDZ at 30 min or 1 h after i.v. MDZ was found not to be a useful phenotypic trait for MDZ CYP3A activity [7, 13, 20]. The possibility exists that the rate of glucuronidation and its elimination might affect the ratio and probably confounded the correlation between MDZ CL and the ratio. On the other hand, it seems that the pharmacokinetics of 1′-OH-MDZ after its formation do not affect MDZ CL, i.e. CYP3A phenotyping in the patients.
Plasma concentrations normalized for dosage (MDZ concentration /per dose) at all time points provided good linear correlation even at 15 min (r = 0.62, P < 0.001) after i.v. MDZ. The optimum time for best correlation between AUC and one plasma concentration is reported to be the harmonic mean of MRT [33]. The harmonic mean MRT for cancer and noncancer groups was 2.4 and 3.0 h, respectively. It is not surprising therefore that the 3. 5-h concentrations seemed to give the best r for the noncancer and combined groups. Stepwise regression indicated that the 1 h and 5 h concentrations could improve r for the cancer and combined groups. On the other hand, earlier time points such as 1 h and 2 h after i.v. MDZ have been shown to result in excellent correlations (Table 3) and would be more convenient. By 2 h the mean plasma MDZ concentrations for all groups would be < 6 ng ml−1 and the patient should be sufficiently awake to leave the hospital instead of staying for the 3. 5-h or 5-h sampling.
There are many optional phenotypic traits in using MDZ as a probe drug for phenotyping CYP3A. Recently, while this study in patients was in progress, Lin et al. [21] and Kim et al. [22], using their much larger database of phenotyped individuals, have published accurate predictors of phenotypic traits for CYP3A activity using a single-point MDZ concentration or a limited sampling strategy to predict MDZ AUC. This study in Asian patients also supported their findings of accurate predictors for CYP3A activity. The initial proposal would be dependent on the number of blood samples that can be taken from the individual. For one blood sample, it can be taken at around the harmonic mean MRT, in our case, 3.5 h; for two samples, these can be taken at 1 and 2 h or 1 and 5 h (depending on time to discharge of the patient). However, this very simple proposal needs to be validated when a much larger database is available.
The advantages of this simple proposal for estimation of CYP3A activity are as follows. Firstly, the i.v. dose of MDZ can be variable (2.5–8 mg) and higher than the usual recommended dose of 14.5 µg kg−1. This means that phenotyping can be performed when MDZ is used clinically in the individual and even in patients with higher than usual accumulation of 1′-OH-MDZ. Secondly, only one to two plasma samples are required as described above after i.v. MDZ. Thirdly, only the MDZ and not the 1′-OH-MDZ concentration is required. Bioanalysis of MDZ concentrations alone is much simpler as the concentrations are still high (≫ 1 ng ml−1 at 5 h with a 2.5 mg dose as in this study). A simple method has been developed using isocratic reverse phase high performance liquid chromatography with a lower limit of quantification at 1 ng ml−1 MDZ and a run time of 18 min for this purpose.
Conclusions
In conclusion, this study has shown that cancer and noncancer Asian patients have similar MDZ CL even when different doses were administered. The variability of CL or CYP3A activity was 4–5-fold. Furthermore, MDZ CL in these patients was comparable with those reported in other ethnic, young and elderly healthy groups [23–26]. It confirmed that the ratio of 1′-OH-MDZ : MDZ is not a useful phenotypic trait for MDZ CYP3A activity. Most significantly, we presented some other options for simple alternative phenotyping trait of just monitoring one to two concentration/ per dose of MDZ at selected times after i.v. administration. Further validation of the method is in progress.
Acknowledgments
We would like to thank the National Medical Research Council of Singapore (NMRC/0391/1999) and the Singapore Cancer Society for financial support in this study.
References
- 1.Wrighton SA, Schuetz EG, Thummel KE, Shen DD, Korzekwa KR, Warkins PB. The human CYP3A subfamily: Practical considerations. Drug Metab Rev. 2000;32:339–361. doi: 10.1081/dmr-100102338. [DOI] [PubMed] [Google Scholar]
- 2.Combalbert J, Fabre I, Fabre G, et al. Metabolism of cyclosporin A; IV. Purification and identification of the rifampicin-inducible human liver cytochrome P-450 (cyclosporin A oxidase) as a product of P450IIIA gene subfamily. Drug Metab Dispos. 1989;17:197–207. [PubMed] [Google Scholar]
- 3.Watkins PB, Murray SA, Winkelman LG, Heuman DM, Wrighton SA, Guaelian PS. Erythromycin breath test as an assay of glucocorticoid-inducible liver cytochromes P-450. J Clin Invest. 1989;83:688–697. doi: 10.1172/JCI113933. [DOI] [PMC free article] [PubMed] [Google Scholar]
- 4.Kronbach T, Mathys D, Umeno M, Gonzalez FJ, Meyer UA. Oxidation of midazolam and triazolam by human liver cytochrome P450IIIA4. Mol Pharmacol. 1989;36:89–96. [PubMed] [Google Scholar]
- 5.Guengerich FP, Martin MV, Beaune PH, Kremers P, Wolf T, Waxman DJ. Characterization of rat and human liver microsomal cytochrome P-450 forms involved in nifedipine oxidation, a prototype for genetic polymorphism in oxidation drug metabolism. J Biol Chem. 1986;261:5051–5060. [PubMed] [Google Scholar]
- 6.Marre F, Saderlink GJ, de Sousa G, Martinet M, Rahmani R. Hepatic biotransformation of docetaxel (Taxotere®) in vitro: Involvement of the CYP3A subfamily in humans. Cancer Res. 1996;56:1296–1302. [PubMed] [Google Scholar]
- 7.Thummel KE, Wilkinson GR. In vitro and in vivo interactions involving human CYP3A. Ann Rev Pharmacol Toxicol. 1998;38:389–430. doi: 10.1146/annurev.pharmtox.38.1.389. [DOI] [PubMed] [Google Scholar]
- 8.Kivisto KT, Kroemer HK, Eichelbaum M. The role of human cytochrome P450 enzymes in the metabolism of anticancer agents: implications for drug interactions. Br J Clin Pharmacol. 1995;40:523–530. doi: 10.1111/j.1365-2125.1995.tb05796.x. [DOI] [PMC free article] [PubMed] [Google Scholar]
- 9.Yamamoto N, Tamura T, Kamiya Y, Sekine I, Kunitoh H, Saijo N. Correlation between docetaxel clearance and estimated cytochrome P450 activity by urinary metabolite of exogenous cortisol. J Clin Oncol. 2000;18:2301–2308. doi: 10.1200/JCO.2000.18.11.2301. [DOI] [PubMed] [Google Scholar]
- 10.Watkins PB. Noninvasive tests of CYP3A enzymes. Pharmacogenetics. 1994;4:171–184. doi: 10.1097/00008571-199408000-00001. [DOI] [PubMed] [Google Scholar]
- 11.Krecic-Shepard ME, Barnas CR, Slimko J, Gorski JC, Wainer IW, Schwartz JB. In vivo comparison of putative probes of CYP3A4/5 activity: erythromycin, dextromethophan, and verapamil. Clin Pharmacol Ther. 1999;66:40–50. doi: 10.1016/S0009-9236(99)70052-4. [DOI] [PubMed] [Google Scholar]
- 12.Streeman DS, Bertino JS, Jr, Nafziger AN. Phenotyping of drug-metabolizing enzymes in adults: a review of in-vivo cytochrome P450 phenotyping probes. Pharmacogenetics. 2000;10:187–216. doi: 10.1097/00008571-200004000-00001. [DOI] [PubMed] [Google Scholar]
- 13.Kinirons MT, O'Shea D, Kim RB, et al. Failure of erythromycin breath test to correlate with midazolam clearance as a probe of cytochrome P4503A. Clin Pharmacol Ther. 1999;66:224–231. doi: 10.1016/S0009-9236(99)70029-9. [DOI] [PubMed] [Google Scholar]
- 14.Kim RB, Wandel C, Leake B, et al. Interrelationship between substrates and inhibitors of human CYP3A and P-glycoprotein. Pharm Res. 1999;16:408–414. doi: 10.1023/a:1018877803319. [DOI] [PubMed] [Google Scholar]
- 15.Thummel KE, Shen DD, Podoll TD, et al. Use of midazolam as a human cytochrome P450, 3A probe: I. In vitro–in vivo correlations in liver transplant patients. J Pharmacol Exp Ther. 1994;271:549–556. [PubMed] [Google Scholar]
- 16.Backman JT, Olkkola KT, Neuvonen PJ. Rifampicin drastically reduces plasma concentrations and effects of oral midazolam. Clin Pharmacol Ther. 1996;59:7–13. doi: 10.1016/S0009-9236(96)90018-1. [DOI] [PubMed] [Google Scholar]
- 17.Olkkola KT, Aranko K, Lunrila H, Hiller A, Saarnivaara L. A potential hazardous interaction between erythromycin and midazolam. Clin Pharmacol Ther. 1993;53:298–305. doi: 10.1038/clpt.1993.25. [DOI] [PubMed] [Google Scholar]
- 18.Kupferschmidt HHT, Ha HR, Ziegler WH, Meire PJ, Krahenbuhl S. Interaction between grapefruit juice and midazolam in humans. Clin Pharmacol Ther. 1995;58:20–28. doi: 10.1016/0009-9236(95)90068-3. [DOI] [PubMed] [Google Scholar]
- 19.Thummel KE, Shen DD, Podoll TD, et al. Use of midazolam as a human cytochrome P450 3A probe: II. Characterization of inter- and intraindividual hepatic CYP3A variability after liver transplantation. J Pharmacol Exp Ther. 1994;271:557–566. [PubMed] [Google Scholar]
- 20.Thummel KE, O'Shea D, Paine MF, et al. Oral first-pass elimination of midazolam involves both gastrointestinal and hepatic CYP3A-mediated metabolism. Clin Pharmacol Ther. 1996;59:491–502. doi: 10.1016/S0009-9236(96)90177-0. [DOI] [PubMed] [Google Scholar]
- 21.Lin YS, Lockwood GF, Graham MA, et al. In-vivo phenotyping for CYP3A by single-point determination of midazolam plasma concentration. Pharmacogenetics. 2001;11:781–791. doi: 10.1097/00008571-200112000-00006. [DOI] [PubMed] [Google Scholar]
- 22.Kim JS, Nafziger AN, Tsunoda SM, et al. Limited sampling strategy to predict AUC of the CYP3A phenotyping probe midazolam in adults: Application to various assay techniques. J Clin Pharmacol. 2002;42:376–382. [PubMed] [Google Scholar]
- 23.Tateishi T, Watanabe M, Nakura H, et al. CYP3A activity in European American and Japanese men using midazolam as an in vivo probe. Clin Pharmacol Ther. 2001;69:333–339. doi: 10.1067/mcp.2001.115447. [DOI] [PubMed] [Google Scholar]
- 24.Balson KR, Morgan DJ, Richmond BH, McAlindon ME, Elliott SL, Yeomans ND. Sedation for endoscopy. Pharmacokinetics of midazolam in Vietnamese subjects. J Gastroenterol Hepatol. 1996;11:1177–1180. doi: 10.1111/j.1440-1746.1996.tb01848.x. [DOI] [PubMed] [Google Scholar]
- 25.Muck W, Tanaka T, Ahr G, Kulmann J. No interethnic differences in steroselective disposition of oral nimodipine between Caucasian and Japanese subjects. Int J Clin Pharmacol Ther. 1996;34:163–171. [PubMed] [Google Scholar]
- 26.Albrecht S, Ihmsen H, Hering W, et al. The effect of age on the pharmacokinetics and pharmacodynamics of midazolam. Clin Pharmacol Ther. 1999;65:630–639. doi: 10.1016/S0009-9236(99)90084-X. [DOI] [PubMed] [Google Scholar]
- 27.Goh BC, Lee SC, Wang LZ, et al. Explaining interindividual variability of docetaxel pharmacokinetics and pharmacodynamics in Asians through phenotyping and genotyping strategies. J Clin Oncol. 2002;20:3683–3690. doi: 10.1200/JCO.2002.01.025. [DOI] [PubMed] [Google Scholar]
- 28.Dundee JW, Halliday NJ, Harper KW, Brogden RN, Midazolam A. review of its pharmacological properties and therapeutic use. Drugs. 1984;28:519–543. doi: 10.2165/00003495-198428060-00002. [DOI] [PubMed] [Google Scholar]
- 29.Bornemann LD, Min BH, Crews T, et al. Dose dependent pharmacokinetics of midazolam. Eur J Clin Pharmacol. 1985;29:91–95. doi: 10.1007/BF00547375. [DOI] [PubMed] [Google Scholar]
- 30.Nakajima M, Suzuki T, Sasaki T, et al. Effects of chronic administration of glucocorticoid on midazolam pharmacokinetics in humans. Ther Drug Monit. 1999;21:507–513. doi: 10.1097/00007691-199910000-00003. [DOI] [PubMed] [Google Scholar]
- 31.Heizmann P, Eckert M, Ziegler WH. Pharmacokinetics and bioavailability of midazolam in man. Br J Clin Pharmacol. 1983;16:43S–49S. doi: 10.1111/j.1365-2125.1983.tb02270.x. [DOI] [PMC free article] [PubMed] [Google Scholar]
- 32.Hotz MA, Ritz R, Linder L, Scollo-Lavizzari G, Haefeli WE. Auditory and electroencephalographic effects of midazolam and á-hydroxy-midazolam in healthy subjects. Br J Clin Pharmacol. 2000;49:72–79. doi: 10.1046/j.1365-2125.2000.00104.x. [DOI] [PMC free article] [PubMed] [Google Scholar]
- 33.Zimmerman CL, Slattery JT. Maintenance-dose prediction based on a single determination of concentration: general applicability to two-compartment drugs with reference to lithium. J Pharm Sci. 1983;72:1262–1266. doi: 10.1002/jps.2600721107. [DOI] [PubMed] [Google Scholar]