

Abstract
Aims
A model describing the population pharmacokinetics of darifenacin and its hydroxylated metabolite was developed from a combined analysis of 18 studies. The relationships between explanatory covariates and pharmacokinetic parameters were explored.
Methods
Plasma concentration data from 337 individuals were pooled from 17 Phase 1 studies (median 28/33 darifenacin/metabolite observations per healthy subject), and one Phase 2 study (median 7/7 darifenacin/metabolite observations per subject) encompassing one intravenous and five different oral formulations (1–45 mg).
Results
Non-linear Mixed Effects Models (NONMEM Version VI) described both the population pharmacokinetics of darifenacin and its hydroxylated metabolite with a two-compartment disposition model with first order absorption. The values (mean ± standard error of the mean) for clearance (CL) and volume of distribution of the central compartment were 40.2 ± 2.0 l h−1 and 34.7 ± 4.6 l h−1, respectively, in a typical male CYP2D6 homozygote-extensive metabolizer (Hom-EM). The absolute bioavailability (F) of darifenacin in a Hom-EM after doses of 7.5, 15 or 30 mg extended release formulation (CR) was 15, 19 and 25%, respectively. Factors influencing F were formulation (70–110% higher for CR compared with immediate release following equivalent daily doses), CYP2D6 genotype [heterozygote-extensive metabolizers (Het-EM) and poor metabolizers (PM) experienced 40 and 90%, respectively, higher exposure than Hom-EM irrespective of dose administered] and saturable first-pass metabolism (dose nonlinearity 1.05–1.43-fold). Race affected F, which was 56% lower in Japanese males. The CYP3A4 inhibitors ketoconazole and erythromycin increased F to approximately 100% and ketoconazole decreased CL by 67.5%. CL was 31% lower in females and 10% lower at night. Formulation affected the metabolite absorption/formation rate. Ketoconazole and erythromycin administration resulted in a decrease of 61.2 and 28.8% in exposure to the metabolite, respectively. The covariates race, gender and circadian rhythm accounted for only approximately half of the variability in the estimated exposures to darifenacin.
Conclusions
The pooled analysis provided a descriptive integration of all characteristics and covariates of the pharmacokinetics of darifenacin and its metabolite, enabling interpolation and extrapolation of these key factors.
Keywords: CYP2D6, darifenacin, pharmacokinetics, pooled analysis, population pharmacokinetics, UK-148, 993
Introduction
Darifenacin (UK-88,525: (S)-2-{1-[2-(2,3,-dihydrobenzofuran-5yl)ethyl]-3-pyrrolidinyl}-2,2-diphenylacetamide) is a novel antimuscarinic agent, which has demonstrated clinical benefit in over-active bladder disease (OAB). Darifenacin is a selective muscarinic M3 receptor antagonist [1–5]. The functional smooth muscle responses induced by cholinergic nerve stimulation to the bladder and gastrointestinal tract are mediated via M3-receptor activation. Its metabolite (UK-148,993) is formed through hydroxylation most probably by cytochromes P4503A4 (CYP3A4) and P4502D6 (CYP2D6) [6]. The polymorphic character of the latter enzyme may give rise to higher darifenacin concentrations in CYP2D6 poor metabolizers (PM) compared with extensive metabolizers (EM). Extensive first-pass saturable metabolism has been observed for orally administered darifenacin, and there are indications that the wall of the gastrointestinal tract is a significant contributor to its metabolism [6].
A multistudy population approach will allow the assessment of all factors influencing the pharmacokinetics of darifenacin from all Phase 1 studies. In contrast, single-study analysis would only allow characterization of one or a few covariates, and would exclude multifactorial modelling of these relationships or identification of possible covariate interactions. Covariate effects (e.g. those of dose, age, race, and gender) will be estimated more accurately in a larger dataset. Determination of the magnitude of this variability, especially that between and within individuals, requires much larger numbers than present in single Phase 1 studies.
The aim of the present study was to describe the population pharmacokinetics of both darifenacin and its hydroxylated metabolite in a large number of healthy subjects and those with OAB using data from intensive sampling over a wide range of doses and formulations. Relationships between pharmacokinetic parameters and key factors such as dose, formulation, CYP2D6 genotype and other covariates are explored.
Methods
Study design
All studies were conducted with approval of the appropriate local ethics committees. Informed consent was obtained from all subjects. For the pharmacokinetic analysis, a total of 337 healthy subjects and those with OAB were pooled from 17 different Phase 1 studies and one Phase 2 study (Tables 1 and 2). Four Phase 1 studies were performed in Japan. The selection of the Phase 1 data sets was based on the diversity of covariate information (e.g. dose range, formulations, single/multiple dose, CYP2D6 genotype and CYP3A4 inhibitors). This diversity increased the relative differences between the concentrations of darifenacin and its metabolite and will enable future estimation of the relative potency of the metabolite for pharmacodynamic endpoints like salivary flow. One Phase 2 study was added to investigate possible differences between healthy subjects and those with OAB.
Table 1. Characteristics of the 337 healthy volunteers and subjects with over-active bladder disease (OAB) from 17 Phase 1 studies and one Phase 2 study, and covariates used in the pharmacokinetic model used for darifenacin.
| Continuous characteristic | Median | Range | Discrete characteristic | Frequency | Description |
|---|---|---|---|---|---|
| Age (years) | 29 | 18–85 | Gender | 293/44 | Males/females |
| Weight*(kg) | 72 | 50–115 | Subject | 292/45 | Volunteer/subject with OAB |
| Height*(m) | 1.76 | 1.49–1.95 | Race | 281/9/42/5 | Caucasian/Black/Japanese/other |
| CONP* | 0.475 | 0–92.15 | Phenotyping method* | 129/16 | Debrisoquine/dextromethorphan |
| SCRT*†(mg dl−1) | 1.05 | 0.418–1.42 | Phenotype* | 152/21 | EM/PM |
| Albumin*†(g dl−1) | 4.4 | 3.4–7.5 | Genotype* | 177/70/28 | Hom-EM/Het-EM/PM |
| Bilirubin*†(mg dl−1) | 0.625 | 0.193–5.85 | Alcohol use | 70/203/21/1 | 0/1–15/16–30/> 30 units/week |
| AST*†(IU l−1) | 20 | 4–68 | Smoking* | 192/95 | Nonsmoker/smoker |
| ALT*†(IU l−1) | 17 | 7–63 | Food† | 256/65/16 | Fasted/high-fat fed/low-fat fed |
| ALKP*†(IU l−1) | 82 | 3–289 | Observation time | 8272/1032 7617/984 | 08.00–24.00 h/24.00–08.00 h darifenacin 08.00–24.00 h/24.00–08.00 h metabolite |
CONP, Phenotype status expressed as metabolic ratio of phenotyping drug; SCRT, serum creatinine; AST, aspartate aminotransferase; ALT, alanine aminotransferase; ALKP, alkaline phosphatase; EM, extensive metabolizer with respect to CYP2D6; PM, poor metabolizer; Hom, homozygote; Het, heterozygote.
Not assessed in all individuals.
Time varying after start in some studies.
Table 2. Description of the 17 Phase 1 studies and the one Phase 2 study.
| Study description | Design | Subjects | Samples* | Doses/formulations |
|---|---|---|---|---|
| Single oral dose escalation | XO | 14♂HV | 7/0 | 1–20 mg SOL |
| SOL-IR, young-elderly | XO | 20♂/7♀HV | 15/16 | 10 mg IR/SOL |
| IV dose escalation | XO | 8♂HV | 49/46 | 0.6, 2, 6 mg IV |
| Effect of food | XO | 22♂HV | 30/34 | 30 mg CR |
| Multiple-dose IR-CR | XO | 13♂HV | 71/71 | 7.5 mg IR TID, 20 mg CRS, CRM, CRF OD |
| Dose escalation IR-CR | XO | 26♂HV | 48/48 | 7.5, 15, 30 mg CR OD 2.5, 5, 10 mg IR TID |
| One tablet CR vs. 2 tablets CR | XO | 23♂HV | 22/22 | 45 mg, 15 + 30 mg CR |
| Relative F IR and CR | XO | 24♂HV | 62/65 | 4 mg IV, 10 mg IR TID, 30 mg CR OD |
| Ketoconazole interaction | PG | 16♂HV | 22/22 | 30 mg CR OD 0, 400 mg ketoconazole |
| Erythromycin interaction | PG | 29♂HV | 21/21 | 30 mg CR OD 0, 400 mg erythromycin |
| Multiple dose SOL | PG | 11♂HV | 55/0 | 10 mg SOL TID |
| Oral contraceptive interaction | XO | 21♀HV | 5/5 | 10 mg IR TID |
| Multiple-dose IR | XO | 16♂HV | 36/36 | 2.5, 5, 10 mg IR TID |
| IR-CR in patients | XO | 29♂/16CPTS | 7/7 | 2.5 mg IR TID, 15, 30 mg CR OD |
| IR-CR in Japanese | XO | 16♂HV | 34/43 | 5, 7.5, 15, 20 mg CR OD, 5, 7.5 mg IR OD |
| Effect of food in Japanese | XO | 8♂HV | 17/19 | 15 mg CR |
| Single-dose CR in Japanese | PG | 6♂HV | 10/11 | 30 mg CR |
| Multiple-dose CR in Japanese | PG | 12♂HV | 32/33 | 15, 30 mg CR |
Samples = median number of darifenacin/metabolite samples per subject. XO, Cross-over; PG, parallel group; HV, healthy volunteer; PTS, patient; SOL, solution; IR, immediate release; CR, (continuous) extended release; CRS, CR; CRM, medium CR; CRF, fast CR; OD, once daily; TID, 3×/day.
CYP2D6 genotype and phenotype information was available in most individuals (Table 3). Genotyping was performed by independent external contractors (Regipharm, Brussels, Belgium; PGL, Uppsula, Sweden; Professor C.R. Wolf, University of Dundee, Dundee, UK).
Table 3. CYP2D6 phenotype and genotype (at baseline) of the 337 healthy subjects and those with over-active bladder disease from 17 Phase 1 studies and the one Phase 2 study on darifenacin used for the pharmacokinetic model.
| Debrisoquine phenotype (n = 129) | Dextromethorphan phenotype (n = 16) | |||||
|---|---|---|---|---|---|---|
| Genotype CYP2D6 | EM | PM | Missing | EM | PM | Missing |
| Homozygote-EM | 64 | 1* | 1 | 11 | 0 | 0 |
| Heterozygote-EM | 36 | 2* | 0 | 3 | 0 | 0 |
| PM | 3* | 7 | 0 | 0 | 2 | 0 |
| Missing | 13 | 2 | 0 | 0 | 0 | 0 |
| Unknown phenotype (n = 192) | All phenotype methods (n = 337) | |||||
|---|---|---|---|---|---|---|
| Genotype CYP2D6 | EM | PM | Missing | EM | PM | Missing |
| Homozygote-EM | 12 | 0 | 88 | 87 | 1* | 89 |
| Heterozygote-EM | 10 | 0 | 19 | 49 | 2* | 19 |
| PM | 0 | 7 | 9 | 3* | 16 | 9 |
| Missing | 0 | 0 | 47 | 13 | 2 | 47 |
Genotype EM classified as phenotype PM or vice versa.
Plasma samples for darifenacin and metabolite quantification were kept on ice after collection and centrifuged within 60 min at 4 °C and at 1500 g for 10 min. Samples were stored at −20 °C pending analysis. Plasma concentrations of darifenacin and its hydroxylated metabolite were determined using Atmospheric Pressure Ionization-Mass Spectrometry, except in one study which used a comparable method with high-performance liquid chromatography (HPLC)-UV [7]. Consistency in bio-analysis between studies was assured throughout. Limits of quantification (LOQ) for darifenacin and metabolite were 0.0586 and 0.113 nm, respectively. Accuracy ranged from 0.6 to 4.6% and precision from 3.6 to 18.8% over a concentration range of 0.0586–4.68 nm darifenacin. No concentrations were below the LOQ.
Several different formulations of darifenacin were evaluated in the Phase 1 programme. Single and multiple dosing schedules were investigated over a wide dose range (0.6–45 mg). In addition to intravenous infusion (0.6–6 mg), the drug was administered orally (1–45 mg) as a solution (SOL), an immediate release (IR) and three different extended release preparations: a slow 18-h release (CR), a medium 8-h release (CRM), and a fast 4-h release (CRF).
The characteristics of the pooled data are presented in Table 4. All outlying concentrations were retained in the dataset, unless they precluded a model fit. For example, some subjects demonstrated an unexplained rise in the concentration of the last (or second last) sample of the elimination phase. This resulted in the exclusion of six darifenacin and two metabolite concentrations.
Table 4. Formulations and dose from 17 Phase 1 studies and the one Phase 2 study.
| Formulation | Number of subjects | Dose range |
|---|---|---|
| IV | 29 | 0.6, 2, 4, 6 mg |
| SOL | 37 | 1, 2.5, 5, 10, 20 mg |
| IR | 155 | 2.5, 5, 7.5, 10, 15, 20 mg |
| CR | 225 | 5, 7.5, 15, 20, 30, 45 mg |
| CRM | 13 | 20 mg |
| CRF | 13 | 20 mg |
IV, 30 min IV infusion; SOL, oral solution; IR, immediate release capsule; CR, slow; CRM, medium; CRF, fast extended release matrix.
Data analysis
Initial data sets for each study were constructed according to the same format and merged for analysis. Pharmacokinetic models were fitted to the data using the population program NONMEM (Non-linear Mixed Effects Modelling, version VI beta-release, double precision) with first order conditional estimation (FOCE) [8, 9]. NONMEM was operated in a UNIX environment (Linux Red-Hat 7.1) using a Fortran compiler (GCC version 2.91.66). All pivotal models were validated by running on NONMEM V (standard release).
Model development
For darifenacin, a model including key covariate relationships was constructed first (‘basic model’). These key covariates were selected based on prior knowledge of the pathways involved in the metabolism of darifenacin [6]. Assessment of additional covariate effects was then performed starting from the ‘basic model’. The covariates tested were age, weight, height, phenotype status (metabolic ratio), serum creatinine, albumin, bilirubin, AST, ALT, alkaline phosphatase, gender, race, healthy subject/patient status, CYP2D6 phenotype, CYP2D6 genotype, alcohol and smoking habits, food intake during drug administration and the time of blood sampling (Tables 1 and 3). Significant relationships between the parameters of the ‘basic model’ and the covariates were introduced into a ‘full model’, which was refined to create a ‘final model’ as described in the Covariate analysis section.
Parent drug model
Darifenacin plasma concentration data were modelled separately from the metabolite. The plasma pharmacokinetics of darifenacin were described by a two-compartment disposition model with first-order absorption (Figure 1). Clearance (CL) from the central compartment depended on CYP2D6 genotype and inhibition of metabolism by ketoconazole (KETOCL) according to the equation CL = (CLPM + CLEM) × (1 −KETOCL). The other structural parameters were volume of distribution of the central compartment (V) and the distribution rate constants to (K23) and from (K32) the peripheral compartment. The model described half-lives of the absorption rate constants (Ka) separately for each formulation (Ka,IR, Ka,SOL, Ka,CRM, Ka,CRF and Ka,CR). Bioavailabilities (F) for the immediate (IR, SOL) and extended release formulations (CR, CRM, CRF) were estimated. The bioavailability (F) in the absence of inhibitors of metabolism (ni) depended on the formulation (immediate =IR or extended =CR), the dose (DOSE, mg) and CYP2D6 genotype according to the equations:
in which TVFIR and TVFCR are the typical values for the bioavailability, DOSEF,IR and DOSEF,CR describe the effect of the dose, and GENOF describes the effect of CYP2D6 genotype. The effect on FCR of coadministration of ketoconazole (KETOF) or erythromycin (ERYF) was only tested with the CR formulation and was described by the equations:
The individual estimates of FIR and FCR were constrained to be between zero and 1 using logit-transformation.
Figure 1.

The ‘final’ structural pharmacokinetic model for darifenacin (two compartments with first-order absorption) and its hydroxylated metabolite (two compartments with first-order absorption). Presystemic metabolite formation was described by simultaneous oral darifenacin and metabolite dosing of equal magnitude.
Metabolite model
The hydroxylated metabolite was modelled sequentially from darifenacin. Simultaneous modelling was not deemed necessary due to the intensive sampling for both darifenacin and the metabolite. The empirical Bayesian predictions of the parameter estimates of darifenacin were used for the metabolite, and a model including key covariate relationships was constructed [6]. No further covariate analysis was performed from the ‘basic metabolite model’. However, the covariates in the model of darifenacin will have an impact on the pharmacokinetics of the metabolite via the individual darifenacin parameters. The metabolite pharmacokinetics were described by a two-compartment disposition model with first-order absorption kinetics (Figure 1). Presystemic formation of the metabolite was simulated in the model by simultaneous oral darifenacin and equimolar metabolite dosing (scaled by the relative metabolite bioavailability) using a hypothetical metabolite absorption compartment. Model parameters estimated were the metabolite clearance (CLM), the metabolite volume of distribution of the central compartment (VM), the distribution rate constants to (K46) and from (K64) the peripheral compartment, the different half-lives of the ‘absorption’ rate constants (describing presystemic and hepatic metabolite formation) for each formulation (Kam,IR, Kam,CRM, Kam,CRF and Kam,CR) and the bioavailabilities for immediate and extended release. The typical value of CLM (TVCLM) was predicted to decrease if ketoconazole or erythromycin was present according to the equation:
Presystemic metabolite formation was described with a hypothetical metabolite absorption compartment as depicted in Figure 1. Owing to the lack of data for metabolite given as an IV infusion, the fraction metabolized and the relative metabolite bioavailability (Fm) were confounded. Therefore, the fraction metabolized was fixed to one (assuming 100% of absorbed darifenacin was metabolized to UK-148,993). The metabolite bioavailabilities were described by the equations:
Fm depended on a typical value for the metabolite bioavailability (TVFm) and the individual empirical Bayes estimate of F for darifenacin. The individual estimates of Fm were constrained to be between 0 and 1 using logit-transformation. No stable fit could be obtained initially, but by fixing the structural parameters of the metabolite (CLM, VM, K46 and K64) to the estimates for the IV data only, successful minimization was obtained.
Interindividual variability
The mixed effect model estimates the typical value of parameters, the interindividual variability components and the magnitude of residual variability, through combining data from all subjects. The parameter estimates for each individual, despite not all receiving the same dose, contribute to the population parameter estimates. Interindividual variability terms were tested initially on all the structural parameters of the basic model. Exponential models were used to account for interindividual variability in most parameters, such that the value of a parameter in an individual (Pi) was a function of the parameter value in the typical individual (Ppop) and an individual deviation represented by ηi. The ηis in the population are symmetrically distributed, zero-mean random variables with a variance that is estimated as part of the model estimation from the equation:
Interindividual variation for CL, V, Ka,IR, Ka,CR were described using exponential error models. In contrast, interindividual variation for FIR and FCR, and interoccasion variability for FIR and FCR were described using additive models within a logit-transform. Each dosing interval during intensive sampling was considered as a separate occasion. Interindividual variations for CLM, VM, Kam,IR, Kam,CR, Fm,IR and Fm,CR were described using exponential error models.
Residual error model
The initial model for the residual error in darifenacin pharmacokinetics incorporated both an additive and a proportional component, and separate residual error magnitudes were included following oral and intravenous administration. The rationale for this model was that data derived following oral administration often display greater variability than data observed after intravenous administration. An additive plus proportional model for untransformed data is described by the equation:
where Y represents the observation (i.e. darifenacin concentration), IPRED the individual predicted concentration and e1 and e2 are symmetrically distributed, zero-mean random variables with variance terms that are estimated as part of the population model fitting process. The magnitude of the variability in e1 can be viewed as the ‘proportional’ component and that of e2 as the ‘additive’ component of the residual error model.
Since data were obtained from different studies in both healthy subjects with those with OAB, it was anticipated that the residual error may not be constant across all individuals. Therefore, the individual contribution to the residual error was accounted for by including an interindividual variability term in the residual error model. However, the estimation of this variability required FOCE with interaction, but this estimation approach proved to be unsatisfactory, because no successful termination with covariance step could be achieved. Therefore, a generalized least squares (GLS) related approach was applied [10]. In a first iteration (#1) the individual predictions (IPRED#1), the individual mean absolute weighted residual (IAAW#1) and population average absolute weighted residual (PAAW#1) were obtained. In the final run the values of IPRED#1, IAAW#1 and PAAW#1 were used to model the residual variability. This two-stage single iteration approach resulted in acceptable individual predictions making further iterations unnecessary. Thus, the residual error was modelled independently from the structural model by using the equation:
Thus, the observed concentration Y depended on the estimate of the individual prediction (IPRED) plus the residual error. The latter was described by the random effects parameters e1 (additive) and e2 (proportional), weighting factors Wadd and Wprop, and the IPRED#1, IAAW#1 and PAAW#1 of the first iteration. Thus, Y depends on the individual prediction of the current run plus a residual error that was based on the individual prediction of the previous run (GLS-like approach) and scaled by its average absolute weighted residual. The additive (Wadd × e1) and proportional (Wprop × e2) errors were best described separately for intravenous and oral data. This was achieved by making e1 and e2 equal to 1 and estimating a different (scaling) θ for each type of administration and error type [11]. The pharmacokinetics of the metabolite were best described by a proportional residual error component using the FOCE algorithm.
Covariate analysis
To assess whether additional variables influenced the pharmacokinetics of darifenacin, individual empirical Bayes estimates of the parameters were generated from the ‘basic’ model, and plots of the difference between these and the population estimates (the ηis) vs. covariates were constructed to visualize potential relationships. Generalized additive modelling (GAM) [12], implemented in Xpose [11], was used to identify possibly influencing variables. To account for time-varying covariates, data from different occasions within an individual were treated as originating from separate individuals. Covariates identified in the GAM as being important were included in the mixed-effects model applying a stepwise procedure. Covariate selection was based on the drop in objective function value (ΔOFV). The OFV is proportional to minus two times the log-likelihood, and the difference in OFV between two nested models (the more complex model can be reduced to the simpler one) is approximately χ2-distributed. A difference in OFV>3.84 is significant at the 5% level (one degree of freedom) if nonlinearity and heteroscedasticity in the model is accounted for [10]. Corresponding values (changes in the OFV) for P = 0.01 and P = 0.001 are 6.63 and 10.83. However, for non-nested models, the OFV cannot be used for formal testing, but we considered the differences mentioned above between models of the same number of parameters to present a real difference in the description of the data. Covariates were first assessed univariately in the model, and ranked according to the ΔOFV associated with their inclusion. Variables were then stepwise tested in the model, in descending order. Only variables producing a decrease in OFV>3.84 on inclusion were incorporated in the model. When no more covariates could be included based on this criterion, a backwards deletion was carried out. A stricter criterion was then applied, only retaining physiological plausible covariates associated with an increase in the OFV of>10.83 on their exclusion. To be retained in the final model the 95% confidence interval on the covariate effect (based on the standard error of the parameter estimate given by NONMEM) should not include the null parameter. Covariate relationships were modelled proportional to the parameter, as the fractional change in the parameter with the covariate. Continuous covariates were centred at their median values. If doubling of a covariate increased a parameter by 100%, then the covariate-effect was expressed as a twofold increase of that parameter. Missing covariates were grouped with the most prevalent group, if categorical, or ignored if continuous. Covariates were only assessed if available in at least 90% of the subjects. Insufficient individuals in all racial groups necessitated dichotomization of the race covariate. Black, White and other races were treated as one group and Japanese as another. Heterozygote EMs were pooled together with those subjects (18%) of unknown genotype, because heterozygote EM is the most prevalent genotype in the general population. However, in subjects of unknown genotype their CYP2D6 phenotype was used when available (24% of individuals with unknown genotype). In order to accommodate differences in metabolic capacity between CYP2D6 PMs, Het-EMs and Hom-EMs, a model including different parameters for clearance and bioavailability for the three different genotypes was tested to construct the final covariate model. Backwards elimination was employed to test the validity of the previously identified covariates when the third genotype category had been added. Refinement of the model was performed by considering mechanistic plausibility of relationships, and substituting correlated covariates. In addition, some interactions between covariates were investigated.
Model evaluation
Basic goodness-of-fit plots including population (PRED) and individual predictions (IPRED) vs. observed concentrations (DV), as well as individual weighted residuals (IWRES) vs. individual predictions, and the distribution of the weighted residuals (WRES) over time, were used for diagnostic purposes. Other diagnostics were the OFV and the precision of the parameter estimates. The internal validity of the population pharmacokinetic model was assessed, principally, by graphical analysis (goodness-of-fit plots) and deletion diagnostics (omitting specific types of data, for instance all IR formulations or specific individuals, and subsequent assessment of parameter estimates). The model validity was also assessed by modelling darifenacin alone for each study, combining clusters of studies and then combining all studies.
Simulations
Deterministic simulations of the darifenacin concentration-time profiles were performed using the ‘final model’ empirical Bayes estimated parameters with their within- and between-subject variabilities and subject characteristics, assuming a schedule of 7.5, 15 or 30 mg CR every day for 10 days. These simulated profiles were used to evaluate the expected variability in pharmacokinetics at these doses of the commercial formulation. In addition, simulations were performed to evaluate the explanatorial influence of the covariates on interindividual variability. The empirical Bayes estimated parameters for CL and F (corrected for dose nonlinearity) were used to obtain the expected exposures (AUC: area under the plasma concentration-time curve) after 7.5, 15 and 30 mg darifenacin. Another simulation was performed using the estimated exposure (AUC) based on the population values from the ‘basic model’ for CL and F (taking differences in dose, CYP2D6 genotype and inhibition of CYP3A4 activity into account). A complete covariate-free model could not be obtained. A comparison was made between both outcomes in order to assess the added value of the additional covariates for the model.
Results
We obtained 9304 darifenacin and 8601 metabolite plasma concentrations from intensive sampling (Table 1). The 17 Phase 1 studies generated a median of 28/33 darifenacin/metabolite observations per healthy subject, and one Phase 2 study generated a median of 7/7 darifenacin/metabolite observations per subject with OAB (Table 2).
The population predictions are based on the typical population parameters in the ‘final model’ as presented in Table 5, and the individual empirical Bayes estimates of the parameters for darifenacin. All pivotal models were reproduced correctly with NONMEM V. For the typical male Caucasian CYP2D6 homozygote-EM, CL was estimated to be 40.2 l h−1, and elimination half-life 3.12 h. The volumes of distribution of the central and peripheral compartments and at steady state were estimated to be 34.7, 128.7 and 163.4 l, respectively. Absorption half-lives ranged from 0.277 to 11.9 h (SOL-CR). The bioavailability of darifenacin in a CYP2D6 Hom-EM following doses of 7.5, 15 or 30 mg extended release (CR) were 15.4, 18.6 and 24.8%, respectively, yielding CL/F values of 261, 216 and 162 l h−1, respectively. The basic goodness-of-fit plots of the population and individual predictions vs. observed concentrations of darifenacin are presented in Figure 2. Some lack of fit is evident in the log-log plot over the lower concentration range (both during early absorption and late elimination). However, it should be noted that these observations represented only 30 out of the 9304 total (all in different subjects).
Table 5. Population pharmacokinetic parameters for darifenacin obtained from NONMEM with first order conditional estimation (FOCE) and generalized least squares (GLS).
| Parameter | Estimate ± SE | Parameter | Estimate ± SE | Variability | Estimate (CV) |
|---|---|---|---|---|---|
| CLEM (l h−1) | 40.2 ± 2.0 | FIR (%) | 12.6 ± 1.05 | IIVCL | 32% (18%) |
| CLPM (l h−1) | 32.1 ± 2.5 | DOSEF,IR (mg−1) | 0.0361 ± 0.0093 | IIVV | 47% (18%) |
| KETOCL | 0.675 ± 0.039 | FCR (%) | 24.8 ± 1.53 | IIVKa,IR | 69% (19%) |
| FemaleCL | −0.311 ± 0.060 | DOSEF,CR (mg−1) | 0.0168 ± 0.0028 | IIVKa,CR | 24% (27%) |
| NightCL | −0.099 ± 0.034 | GENO-HETF | 0.398 ± 0.060 | IIVF,IR | 67% (20%) |
| V (l) | 34.7 ± 4.6 | GENO-PMF | 0.519 ± 0.149 | IIVF,CR | 67% (20%) |
| K23 (h−1) | 6.86 ± 0.77 | RaceF | −0.555 ± 0.0455 | IOVF | 37% (13%) |
| K32 (h−1) | 1.85 ± 0.28 | KETOF | 1 (fixed) | ||
| T1/2,Ka,IR (h) | 1.02 ± 0.15 | ERYF | 0.972 ± 0.0048 | ||
| T1/2,Ka,SOL (h) | 0.277 ± 0.077 | ADDIV (µM) | 0.000215 ± 0.00002 | ||
| T1/2,Ka,CRM (h) | 5.71 ± 0.53 | PROPIV | 18.6% ± 1.5% | ||
| T1/2,Ka,CRF (h) | 1.94 ± 0.30 | ADDORAL (µM) | 0.000137 ± 0.000015 | ||
| T1/2,Ka,CR (h) | 11.9 ± 0.31 | PROPORAL | 36.0% ± 0.46% |
SE and CV represent the standard error of the estimate and coefficient of variation as given by NONMEM. CLEM, Clearance in CYP2D6 extensive metabolizer; CLPM, CL in CYP2D6 poor metabolizer; KETOCL, ketoconazole effect on CL; FemaleCL, gender effect on CL; NightCL, time of observation effect on CL; V, volume of distribution of central compartment; K23, distribution rate constant from central to peripheral compartment; K32, distribution rate constant from peripheral to central compartment; T1/2,Ka, half-life of absorption rate constant; IR, immediate release; SOL, solution; CRM, medium extended release; CRF, fast extended release; CR, (slow) extended release; FIR, bioavailability of IR centred at median dose (10 mg IR tid); DOSEF,IR, dose-effect on FIR; FCR, bioavailability of CR centred at median dose (30 mg CR od); DOSEF,CR, dose-effect on FCR; GENO-HETF, CYP2D6 heterozygote EM-effect on F; GENO-PMF, CYP2D6 PM effect on F; RaceF, race effect on F; KETOF, F with ketoconazole; ERYF, F with erythromycin; ADD, additive residual error; PROP, proportional residual error; IIV, interindividual variability; IOV, interoccasion variability. Covariate effects described as fractional change: P = P × (1 + covariate × effect).
Figure 2.

The observed darifenacin concentrations (DV) vs. the population predictions (PRED) and individual predictions (IPRED) on normal and log-log scale (grey line: spline).
The individual weighted residuals vs. individual predictions, and the distribution of residuals over time are shown in Figure 3. Separate plots for each formulation, dose and study showed similar goodness-of-fit (data not shown). CYP2D6 genotype and treatment with ketoconazole and erythromycin were predicted to influence the CL and F of darifenacin [6]. Therefore, these covariates were included at an early stage of the model development. The formulation effect on Ka decreased the OFV by 3010 points. Inclusion of a formulation and a dose-effect on F resulted in drops in the OFV of 453 and 108 points, respectively. Using a step-function for the dose-effect (decrease in F if dose ≥30 mg) instead of a linear relationship with F, increased the OFV by 124 points. A graphical interpretation of the model predictions of the differences in F and AUC for each dose, formulation and CYP2D6 genotype is presented in Figure 4. Treatment with ketoconazole and erythromycin increased F to 100% and 97%, respectively. The effect of ketoconazole on CL (67.5% decrease) resulted in a drop in the OFV of 31 points. No effect of erythromycin on CL was detected. Various models with lag-time in absorption did not result in an appreciable improvement in fit. One study compared simultaneous intake of a 30- and a 15-mg CR tablet vs. a 45-mg CR tablet. The data were best modelled as both having a dose-effect equal to 45 mg instead of a separate one for each study arm (ΔOFV +37 points), indicating that the dose-effect is related to saturated first-pass metabolism rather than formulation [6].
Figure 3.

The individual weighted residuals (IWRES) vs. the individual predictions (IPRED) of darifenacin and its metabolite concentrations on normal and log-log scale.
Figure 4.

Model predictions of the bioavailability (F) and area under the concentration-time curve (AUC) of darifenacin administered as immediate release (IR, SOL) or extended release formulation (CR, CRM, CRF) in typical CYP2D6 poor (PM) and homozygote (Hom-EM) and heterozygote extensive metabolizers (Het-EM) vs. the dose. CR, CRM, CRF (CYP2D6 PM) (▪); IR, SOL (CYP2D6 PM) (□); CR, CRM, CRF (CYP2D6 Het-EM) (•); IR, SOL (CYP2D6 Het-EM) (○); CR, CRM, CRF (CYP2D6 Hom-EM) (▴); and IR, SOL (CYP2D6 Hom-EM) (▵).
The basic goodness-of-fit plots of the population and individual predictions vs. observed concentrations of the hydroxylated metabolite of darifenacin are presented in Figure 5. The population pharmacokinetic parameters of the metabolite are presented in Table 6. Its clearance (mean ± SEM) was estimated to be 188 ± 21 l h−1, the volume of distribution of the central compartment 499 ± 55 l, and the elimination half-life 14.9 h. Absorption half-lives ranged from 0.4 to 5.5 h (IR-CR).
Figure 5.

The observed metabolite concentrations (DV) vs. the population predictions (PRED) and individual predictions (IPRED) on normal and log-log scale (grey line: spline).
Table 6. Population pharmacokinetic parameters of the hydroxylated metabolite of darifenacin obtained from NONMEM with first order conditional estimation (FOCE).
| Parameter | Estimate ± SE | Parameter | Estimate ± SE | Variability | Estimate (CV) |
|---|---|---|---|---|---|
| CLM (l h−1) | 188 ± 21 | T1/2, Kam,IR(h) | 0.402 ± 0.101 | IIVCLM | 47% (22%) |
| KETOCLM | 0.612 ± 0.021 | T1/2, Kam,CRM(h) | 4.71 ± 0.38 | IIVVM | 50% (28%) |
| ERYCLM | 0.288 ± 0.029 | T1/2, Kam,CRF(h) | 2.08 ± 0.30 | IIVKam,IR | 130% (40%) |
| VM(l) | 499 ± 55 | T1/2, Kam,CR(h) | 5.47 ± 0.43 | IIVKa,CR | 57% (46%) |
| K46(h−1) | 0.601 ± 0.090 | TVFm,IR | 1.10 ± 0.10 | IIVF,IR | 51% (25%) |
| K64(h−1) | 0.129 ± 0.015 | TVFm,CR | 1.14 ± 0.11 | IIVF,CR | 62% (17%) |
| PROP | 35.9% ± 6.0% |
SE and CV represent the standard error of the estimate and coefficient of variation as given by NONMEM. CLM, Clearance of metabolite; KETOCLM, ketoconazole effect on CLM; ERYCLM, erythromycin effect on CLM; VM, volume of distribution of central compartment of metabolite; K46, distribution rate constant from central to peripheral compartment of metabolite; K64, distribution rate constant from peripheral to central compartment of metabolite; T1/2, Kam, half-life of absorption rate constant of metabolite; IR, immediate release; CRM, medium extended release; CRF, fast extended release; CR, (slow) extended release; TVFM,IR, relative metabolite bioavailability of IR; TVFM,CR, relative metabolite bioavailability of CR; PROP, proportional residual error; IIV, interindividual variability. Covariate effects described as fractional change: P = P × (1 + covariate × effect).
The information on covariates was almost complete (no more than 10% missing). After the backwards elimination step, the effect of race on F, the effect of gender and nighttime dosing on CL remained in the model (Table 5). After dichotomization of the races Japanese had a 55.5% lower F than non-Japanese. Not dichotomizing gave similar results. Females had a 31.1% lower CL than males. CL was 9.9% lower at night. Splitting the CYP2D6 genotype effect on F into Hom-EM, Het-EM, and PM slightly improved the fit (ΔOFV −17 points), but the effect of Het-EM on CL was not supported. The covariate model for the other covariates was not changed compared with the two-category model. Thus, the equation for Fni was extended with an additional term for the covariate effect of Het-EM status on F:
CYP2D6 genotype could be substituted for phenotype without a decrease in model fit. No interactions between genotype and the dose or formulation effects on bioavailability were detected.
Variability between individuals in the parameters describing the pharmacokinetics of darifenacin ranged from 24% for the absorption half-life after CR to 69% for that after IR (Table 5). Interoccasion variability in F was estimated at 37% (ΔOFV −715 points). Interindividual variability in the parameters describing pharmacokinetics of the metabolite was larger than that of darifenacin. It ranged from 47% for the clearance of the metabolite to 130% for the absorption half-life after IR (Table 6).
The OFV between FOCE with and without GLS (ΔOFV −4568 points) and individual information content correction (ΔOFV −1777 points) cannot be compared directly (similar to FOCE and FOCE I). However, the benefit from using GLS and individual information content correction for the modelling of the residual error was reflected in the decrease in residual error (the proportional errors for IV and oral data decreased from 26 and 47% to 19 and 36%, respectively) and the improvement of most individual predicted profiles, as well as a more normal WRES distribution. Although the residual error model of the metabolite was less complex, an equal magnitude of residual error was achieved compared with darifenacin (36%) without an additive component.
Deterministic simulations of the darifenacin concentration-time profiles were performed using the ‘final model’ estimates of the parameters with their within- and between-subject variabilities (Table 5) and the characteristics of the 337 individuals (Table 1). A regimen of 7.5, 15 or 30 mg CR every day for 10 days was used. The simulated profiles for all individuals at day 10 (steady state) are presented in Figure 6. The deterministic simulated median (range) AUCs for the 337 individuals studied after 7.5, 15 or 30 mg CR were 34 (3–167), 82 (7–401) and 219 (20–1073) ng h ml−1, respectively. Thus, 70% of this interindividual variability in AUC was explained by the covariates regardless of dose. In contrast, the estimated exposure based on the population values from the ‘basic model’ for CL and F (taking differences in dose, CYP2D6 genotype and administration of CYP3A4 inhibitor into account) was characterized by 190, 165 or 131% interindividual variability following 7.5, 15 or 30 mg CR, respectively.
Figure 6.
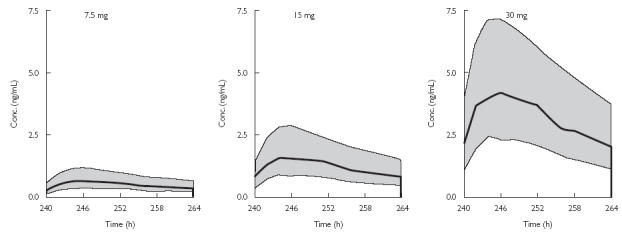
Deterministically simulated concentration-time profiles of darifenacin at steady state (day 10) after receiving 7.5, 15 or 30-mg CR doses for 10 days every day. Simulations were performed using all 337 individuals with model estimates of the typical parameters and their associated interindividual variabilities. The thick line represents median concentration-time profile and grey surface the boundaries of the 1st and 3rd quartile of the population.
Discussion
A population pharmacokinetic model was developed that described the plasma concentrations of darifenacin and its hydroxylated metabolite obtained from a wide range of Phase 1 and 2 studies (population pooled analysis). The model detected key factors influencing the pharmacokinetics of darifenacin such as its saturable first-pass metabolism, its formulation dependency, the CYP2D6 polymorphism, and the effects of CYP3A4 inhibitors.
The pharmacokinetic parameters obtained are similar to the only other published report on darifenacin in humans [6]. Beaumont and co-workers reported that darifenacin was well absorbed from the gut. Oral clearance (CL/F) was estimated to be 226 l h−1 (assuming a bodyweight of 72 kg) after 5 mg IR tid for 5 days (n = 6). Our population model predicted CL/F at this dose and formulation to be 389 l h−1 in CYP2D6 EMs. For all individuals the median value for CL/F was 238 l h−1 ranging from 6 to 3004 l h−1.
Formulation affected the absorption rates of darifenacin. The half-life of absorption was estimated to be 0.28, 1.0, 1.9, 5.7 and 11.9 h for the solution, and the immediate, fast extended, medium extended and slow extended release formulations. This order of absorption half-life is in agreement with the pharmaceutical properties of these formulations. Solution and immediate preparation release should be absorbed the fastest and the rate of absorption of the three extended release formulations was in the same order as their 4-h, 8-h and 18-h matrix-release periods. Darifenacin is completely absorbed, and therefore a maximum absorption half-life of 5–10 h was expected, based on 24–48-h transit through the gastrointestinal tract and complete absorption after five times the absorption half-life. The somewhat higher population value for the absorption of the slow extended release preparation could be explained by the difficulty of estimating this parameter from mainly multiple-dose information, and the variability within the population. Formulation affected the absorption rates of the metabolite. The relative shorter absorption half-life of the metabolite compared with the parent drug indicates that the former is generated more in the upper than in the lower gastrointestinal tract. This is consistent with the upper tract having a higher metabolic capacity. After CR administration both the upper and lower gastrointestinal tract will be exposed to darifenacin. Thus, the largest decrease in absorption half-life of the metabolite compared with its parent is observed with this formulation. Metabolite absorption rate and metabolite-formation rate are unidentifiable within the model, due to lack of IV administration of metabolite data. Hepatic metabolism is not dependent on formulation.
Extended-release formulations (CR, CRM and CRF) were characterized by a higher bioavailability than immediate release ones (IR, SOL). In addition, a higher bioavailability was observed with extended-release formulations compared with an immediate-release one at equivalent doses. This may be explained by a lower CYP3A4 (and CYP2D6) activity in the lower compared with the upper gastrointestinal tract [13]. An immediate-release formulation will predominantly be absorbed in the upper gastrointestinal tract, whereas an extended-release one will reach the lower gastrointestinal tract and thus will meet less metabolic activity during first pass. A typical CYP2D6 homozygote extensive metabolizer receiving 15 mg IR was predicted to have a bioavailability of 14.9%, whereas the formulation 15 mg CR would have given a bioavailability of 18.6%. When comparing the 3 × 2.5 mg IR and 1 × 7.5 CR dosages, the total exposure to the drug after the CR form would be 1.7-fold higher than after the IR form. When comparing the 3 × 15 mg IR and 1 × 45 CR dosages, the total exposure to the drug after the CR form would be 2.1-fold higher than after the IR form. Thus, formulation influenced F, resulting in a 70–110% higher value after the CR form compared with the IR form containing equivalent daily doses. CYP2D6 poor metabolizers were characterized by a decrease of 20.1% in CL and an increase of 51.9% in F compared with homozygote extensive metabolizers. The elimination half-life, which was not dependent on formulation, in poor metabolizers was 3.83 h compared with 3.12 h in extensive metabolizers. Heterozygote extensive metabolizers were characterized by an increase of 39.8% in F compared with homozygote extensive metabolizers. No difference in CL between heterozygote and homozygote EMs was found, thus the data for CL was pooled for these two CYP2D6 genotypes. Since the genotype affected both CL and F, AUC was also changed. CYP2D6 poor metabolizers had a 90.2% higher AUC than homozygote extensive metabolizers, and heterozygote extensive metabolizers had a 39.8% higher AUC than homozygote extensive metabolizers. This genotype effect was not dependent on the dose.
Increasing the dose increased F for the IR formulation in CYP2D6 extensive metabolizers. Increasing the dose also increased F for the CR formulation in extensive metabolizers. The dose effects were different for the formulation types. Because of nonlinearity over the oral dose range (1–45 mg) a 2.2–2.7-fold increase in exposure to the drug after doubling of the dose occurred. Thus, in a typical male homozygote EM an increase in dose from 7.5 mg to 15 mg would result in a 2.4-fold increase in AUC from 28.8 ng h ml−1 to 69.2 ng h−1 ml−1. This supraproportional increase is a consequence of dose-dependency in F; no additional covariate relationships exhibiting dose dependency were found. This dose dependency in F could be explained by saturation of CYP3A4 and CYP2D6 in the gastrointestinal tract wall [6].
Treatment with ketoconazole, a potent inhibitor of CYP3A4, decreased CL by 67.5% and increased F to 100%. Erythromycin affected only F, increasing it to 97.2%. This difference could be explained by the finding that erythromycin is a 50-fold less potent inhibitor of CYP3A4 than ketoconazole. Preclinical investigations have also demonstrated that ketoconazole was the more potent inhibitor of darifenacin metabolism (unpublished data). The ketoconazole and erythromycin treatment resulted in increases in CL of the metabolite of 61.2 and 28.8%, respectively. This is probably due to a decrease in the fraction metabolized from the parent drug, rather than an increase in the elimination of the metabolite.
The Japanese subjects had a 55.5% lower F than Caucasians. No other racial differences in the remaining pharmacokinetics parameters were observed, indicating that the effect on F was caused by increased first-pass metabolism (through CYP2D6 and CYP3A4) rather than a change in absorption or systemic clearance. The distribution of CYP2D6 alleles is known to differ between Caucasian and Japanese populations [14]. However, the CYP2D6 genotype was accounted for separately in the model. Furthermore, no ethnic variations in CYP3A4 activity have been clearly identified [14]. Therefore, it is likely that the racial differences are caused by variation in factors other than CYP3A4 or CYP2D6 activity. The gender difference in CL can be explained by a lower CYP2D6 activity in females [15]. The lower CL during nighttime dosing may be a consequence of circadian rhythm in the pharmacokinetics of darifenacin.
Inspection of the posterior η distributions indicated no correlations between the absorption half-lives and bioavailabilities of the formulations for both darifenacin and its metabolite. This justified the use of a model without off-diagonal elements.
The pragmatic approach of the GLS-like technique and the information content correction resulted in less biased parameter estimates, as indicated by the lower residual error magnitude and improved goodness-of-fit of individual profiles. The GLS-like approach deflated the inflated residual errors by reducing the bias in the estimation of the structural parameters. This was achieved through independent estimation of the residual error and the structural parameters. The metabolite required a less complex residual error model to achieve similar goodness-of-fit. This could be explained by the lower intra-individual variability in the metabolite concentration-time profiles compared with darifenacin. For example, the absorption/formation profile of the metabolite generally was much ‘smoother’ than the absorption profile of darifenacin.
The deterministic simulations of the concentration-time profiles after 7.5, 15 and 30 mg CR yielded the expected variability in the pharmacokinetics of darifenacin after steady-state dosing of the commercial formulation. Although an increase in concentration profiles was observed between doses, each dose is also associated with a marked variability within and between the individual profiles. Simulated interindividual variability in exposure was predicted to be 190–131% following 7.5–30 mg darifenacin dosing. The covariates, race, gender and circadian rhythm, explained only 70% of this variability.
Interstudy variability may be important for the estimation of the structural parameters, if studies are not homogeneous in their experimental design [16]. The present datasets were heterogeneous because of differences in frequency of dosing, different formulations, doses and sampling schedules. Previously, Wakefield et al. reported the population modelling of six combined pharmacokinetic studies of fluticonasole propionate [17]. They described the intra-individual variances being dependent on the study, arguing that changes in the assay between the studies may affect intra-individual variation. However, the individual average absolute weighted residuals and the posterior η distributions did not demonstrate any bias due to a study effect, underwriting the appropriateness of the fit across the pooled studies.
In conclusion, a population pharmacokinetic model for darifenacin and its hydroxylated metabolite using a pooled analysis was developed that incorporated the effect of saturable first-pass metabolism, formulation, the CYP2D6 polymorphism and inhibition of CYP3A4 activity. In addition, a gender and diurnal effect on clearance and an effect of race on bioavailability were found. Explicit modelling of random effects allowed datasets of different precision, and subject groups of different heterogeneity, studied with different designs, to be pooled and analysed together to estimate common parameters more efficiently. The pooled analysis provided a descriptive integration of all characteristics and covariates of the pharmacokinetics of darifenacin and its metabolite, enabling interpolation and extrapolation of these key factors. Only through a pooled analysis, if the residual error is well controlled, could an accurate estimation of covariate effects, variability and proper multifactorial covariate analysis be achieved.
References
- 1.Alabaster AV. Discovery and development of selective M3 antagonists for clinical use. Life Sci. 1997;60:1053–1060. doi: 10.1016/s0024-3205(97)00047-7. [DOI] [PubMed] [Google Scholar]
- 2.Newgreen DT, Naylor AM. Characterisation of functional muscarinic receptors in human bladder. Br J Pharmacol. 1996;119:45P. [Google Scholar]
- 3.Quinn P, McIntyre P, Miner WD, Wallis RM. In vivo profile of darifenacin, a selective muscarinic M3 receptor antagonist. Br J Pharmacol. 1996;119:198P. [Google Scholar]
- 4.Wallis RM, Burges RA, Cross PE, MacKenzie AR, Newgreen DT, Quinn P. Darifenacin, a selective muscarinic M3 antagonist. Pharmacol Res. 1995;31S:54. [Google Scholar]
- 5.Smith CM, Wallis RM. Characterisation of [3H]-darifenacin as a novel radioligand for the study of muscarinic M3 receptors. J Recept Signal Transduct Res. 1997;17:177–184. doi: 10.3109/10799899709036602. [DOI] [PubMed] [Google Scholar]
- 6.Beaumont KC, Cussans NJ, Nichols DJ, Smith DA. Pharmacokinetics and metabolism of darifenacin in the mouse, rat, dog and man. Xenobiotica. 1998;28:63–75. doi: 10.1080/004982598239768. [DOI] [PubMed] [Google Scholar]
- 7.Kaye B, Herron WJ, MacRae PV, et al. Rapid, solid phase extraction technique for the high-throughput assay of darifenacin in human plasma. Anal Chem. 1996;68:1658–1660. doi: 10.1021/ac9507552. [DOI] [PubMed] [Google Scholar]
- 8.Beal SL, Boeckman AJ, Sheiner LW. NONMEM users guide Part VI, PREDPP guide. San Francisco: University of California, NONMEM Project Group; 1992. [Google Scholar]
- 9.Boeckman AJ, Sheiner LW, Beal SL. NONMEM users guide, Part V, Introductory guide. San Francisco: University of California, NONMEM Project Group; 1994. [Google Scholar]
- 10.Wählby U, Jonsson EN, Karlsson MO. Assessment of actual significance levels for covariate effects in NONMEM. J Pharmacokin Biopharmaceut. 2001;28:231–252. doi: 10.1023/a:1011527125570. [DOI] [PubMed] [Google Scholar]
- 11.Jonsson EN, Karlsson MO. Xpose – an S-PLUS based population pharmacokinetic/pharmacodynamic model building aid for NONMEM. Comput Meth Programs Biomed. 1999;58:51–64. doi: 10.1016/s0169-2607(98)00067-4. [DOI] [PubMed] [Google Scholar]
- 12.Mandema JW, Verotta D, Sheiner LB. Building population pharmacokinetic-pharmacodynamic models. I. Models for covariate effects. J Pharmacokin Biopharmaceut. 1992;20:511–528. doi: 10.1007/BF01061469. [DOI] [PubMed] [Google Scholar]
- 13.Paine MF, Khalighi M, Fisher JM, et al. Characterization of interintestinal and intraintestinal variations in human CYP3A-dependent metabolism. J Pharmacol Exp Ther. 1997;283:1552–1562. [PubMed] [Google Scholar]
- 14.Xie H-G, Kim RB, Wood AJJ, Stein CM. Molecular basis of ethnic differences in drug disposition and response. Annu Rev Pharmacol Toxicol. 2001;41:815–850. doi: 10.1146/annurev.pharmtox.41.1.815. [DOI] [PubMed] [Google Scholar]
- 15.Tanaka E. Gender-related differences in pharmacokinetics and their clinical significance. J Clin Pharm Ther. 1999;24:339–346. doi: 10.1046/j.1365-2710.1999.00246.x. [DOI] [PubMed] [Google Scholar]
- 16.Laporte-Simitsidis S, Girard P, Mismetti P, Chabaud S, Decousus H, Boissel J-P. Inter-study variability in population pharmacokinetic meta-analysis: when and how to estimate it? J Pharmaceut Sci. 2000;89:155–167. doi: 10.1002/(SICI)1520-6017(200002)89:2<155::AID-JPS3>3.0.CO;2-2. [DOI] [PubMed] [Google Scholar]
- 17.Wakefield J, Rahman N. The combination of population pharmacokinetic studies. Biometrics. 2000;56:263–270. doi: 10.1111/j.0006-341x.2000.00263.x. [DOI] [PubMed] [Google Scholar]