

Abstract
Aims
Voriconazole is a new triazole antifungal agent, and is metabolized by the cytochrome P450 isoenzymes CYP2C9, CYP2C19, and, to a lesser extent, by CYP3A4. Phenytoin is an inducer of CYP3A4 activity, and a substrate and inducer of CYP2C9 and CYP2C19. The present studies investigated the pharmacokinetic interactions of voriconazole and phenytoin when coadministered.
Methods
Two placebo-controlled parallel-group studies were conducted in healthy male volunteers. Study A was an open-label study and investigated the effect of phenytoin (300 mg once daily) on the steady-state pharmacokinetics of voriconazole (200 mg and 400 mg twice daily). Study B was a double-blind randomized study to investigate the effects of voriconazole (400 mg twice daily) on the steady-state pharmacokinetics of phenytoin (300 mg once daily). Cmax and AUCτ were compared at days 7, 21, and 28 (Study A), and at days 7 and 17 (Study B). All adverse events were recorded.
Results
Study A: 21 subjects were evaluable (10 voriconazole + phenytoin, 11 voriconazole + placebo). For subjects receiving voriconazole (200 mg twice daily) plus phenytoin, the day 21/day 7 ratios for voriconazole Cmax and AUCτ were 60.7% [90% confidence interval (CI) 50.1, 73.6] and 35.9% (90% CI 29.7, 43.3), respectively. Adjusted for voriconazole + placebo, the ratios between the means were 50.7% (90% CI 38.8, 66.1) and 30.6% (90% CI 23.5, 39.7), respectively. When the dose of voriconazole was increased to 400 mg twice daily, the day 28/day 7 ratios for voriconazole Cmax and AUCτ were 134% (90% CI 89.2, 200) and 139% (90% CI 97.3, 199), respectively. Study B: 15 subjects were evaluable for pharmacokinetic assessments (six phenytoin + voriconazole, nine phenytoin + placebo). The ratios between the means for phenytoin + voriconazole/phenytoin + placebo on day 17 vs. day 7 were: phenytoin Cmax 167% (90% CI 144, 193) and phenytoin AUCτ 181% (90% CI 156, 210). All treatments were well tolerated: most adverse events were mild/moderate and transient.
Conclusions
Repeat dose administration of phenytoin decreased the mean steady-state Cmax and AUCτ of voriconazole by approximately 50% and 70%, respectively. Increasing the dose of voriconazole from 200 mg to 400 mg b.d. compensated for this effect. Repeat dose administration of 400 mg b.d. voriconazole increased the mean steady-state Cmax and AUCτ of phenytoin by approximately 70% and 80%, respectively. It is therefore recommended that plasma phenytoin concentrations are monitored and the dose adjusted as appropriate when phenytoin is coadministered with voriconazole.
Keywords: interaction, pharmacokinetics, phenytoin, safety, toleration, voriconazole
Introduction
Voriconazole is a new triazole antifungal agent, developed as oral and intravenous formulations, with potent activity against a broad spectrum of clinically significant pathogens, including Aspergillus and Candida species [1–3], and emerging fungal pathogens, such as Scedosporium and Fusarium species [4, 5].
The pharmacokinetics of voriconazole have been investigated following single and multiple (10–30 days) doses in both healthy volunteers and patients [6–8]. Voriconazole is extensively metabolized by the cytochrome (CYP) P450 system, mainly by the polymorphically expressed CYP2C19 isoenzyme, by CYP2C9, and to a lesser extent by CYP3A4 [9].
Phenytoin is an agent commonly prescribed for the treatment of seizure disorders. It is a known inducer of CYP3A4 activity [10], as well as a substrate and inducer of CYP2C9 and CYP2C19. As a cytochrome P450 inducer, phenytoin could, if coadministered with voriconazole, result in clinically significant reductions in the plasma concentrations of the antifungal agent. Phenytoin, itself, has a narrow therapeutic window of 10–20 µg ml−1 [11], below which seizure control may be lost and above which clinical signs of toxicity (including seizures) are common. Increases in the exposure to phenytoin have been reported following concomitant administration of either fluconazole, a CYP2C9 inhibitor, or itraconazole, a CYP3A4 inhibitor [12, 13]. Therefore, coadministration of voriconazole and phenytoin could also lead to increased levels of phenytoin as a result of cytochrome P450 isoenzyme inhibition by voriconazole. Such interactions have the potential to compromise the therapeutic effect of voriconazole, and/or lead to phenytoin toxicity.
The current studies were therefore conducted to evaluate the pharmacokinetic interactions and safety of coadministered voriconazole and phenytoin by investigating the effect of phenytoin on the steady-state pharmacokinetics of voriconazole and the effect of voriconazole on the steady-state pharmacokinetics of phenytoin.
Methods
Study populations
The ethics committee of the Kent and Canterbury Hospital NHS Trust approved the study protocols, and subjects who had given written fully informed consent were screened for eligibility within 3 weeks of study entry. Screening involved a medical history, a physical examination and 12-lead electrocardiogram (ECG), clinical laboratory tests (haematology, clinical chemistry, and urinalysis), and a urine drug screen. Ophthalmological tests were conducted at screening and at follow-up in Study B only as an additional safety parameter. All test results were reviewed prior to study entry to ensure that all subjects fulfilled the entrance criteria.
Male subjects aged 18–45 years, weighing 60–100 kg, with a body mass index (Quetelet's index: mass height−2) of 18–28 kg m−2 were eligible. Volunteers were excluded if they had laboratory abnormalities, a history of allergies (especially drug-related hypersensitivity), or any evidence of clinically significant disease. In addition, volunteers who had previously experienced clinically significant visual disturbances (except hypermetropia and/or myopia) were excluded from Study B.
Study design
Study A
In this open, placebo-controlled, parallel-group study, subjects received either voriconazole + placebo or voriconazole + phenytoin in one study period which lasted 21 or 28 days, respectively.
All subjects received a loading dose of voriconazole 200 mg four times daily on day 1, followed by 200 mg twice daily on days 2–6, and a single dose of 200 mg on the morning of day 7. On days 8–21, subjects received either phenytoin 300 mg once daily or placebo. In addition, subjects received a further loading dose of voriconazole 200 mg four times daily on day 15, followed by voriconazole 200 mg twice daily on days 16–21, respectively. Those subjects who received phenytoin and voriconazole on days 15–21 remained in the unit and continued dosing with voriconazole 400 mg twice daily and phenytoin 300 mg once daily on days 22–28.
Study B
This was a double-blind, randomized, parallel-group study. On day 1, subjects received an oral loading dose of phenytoin, calculated on the basis of their body weights at admission, using the following formula: Loading dose (mg) = V · [(Cdesired − Cobserved)/S · F] × body weight (kg), where V is the apparent volume of distribution (assumed to be 0.65 l kg−1), Cdesired is the target concentration (15 µg ml−1), Cobserved is the concentration prior to administration of the loading dose (zero), S is the salt form factor (0.92) and F is the bioavailability (assumed to be 1.0).
Subjects subsequently received oral maintenance doses of phenytoin 300 mg every morning on days 2–17. In addition, voriconazole 400 mg or placebo twice daily was administered on days 8–17.
In both studies, the drugs were administered orally with up to 250 ml of water while the subject was sitting or standing. Subjects were not permitted to lie down for at least 1 h after dosing. Voriconazole was administered at 12-h intervals but not within 1 h of food. Phenytoin was administered between 08.30 and 10.30 hours but with no food restrictions. A mouth check was performed after each dose to ensure treatment compliance. Subjects were not permitted to consume methylxanthines, grapefruit, grapefruit juice, or alcohol, or to take unaccustomed exercise during the 48 h prestudy or for the duration of the study.
Pharmacokinetic sampling
All blood samples (5 ml) were collected in heparinized tubes and were centrifuged at 1500 g at 4 °C for 10 min within 1 h, and stored at −20 °C in screw-capped polypropylene tubes within 2 h of collection.
In Study A, blood samples for voriconazole determination were collected prior to dosing on days 1–6, 15–20, and 22–27. In addition, on days 7, 21, and 28, blood samples were taken predose and at 0.25, 0.5, 1, 1.5, 2, 2.5, 3, 4, 6, 8, 10, and 12 h postdose. In Study B, blood samples for voriconazole determination were collected prior to the morning dose on days 9–17.
Blood samples for phenytoin determination were collected prior to dosing on days 8–28 in Study A. Additional blood samples for the rapid assay of phenytoin were also taken for safety assessments predose on days 10, 12, 13, 15, 17, 19, 22, 24, and 26. In Study B, blood samples for phenytoin determination were collected prior to dosing on days 1–6 and 9–16. In addition, on days 7 and 17 blood samples were taken predose and at 1, 2, 4, 6, 8, 12, 18, and 24 h post phenytoin dose. Additional blood samples for the rapid assay of phenytoin for safety assessments were taken predose on days 3, 5, 6, 7, 8, 9, 11, 13, and 15.
Assays
All samples were assayed for voriconazole using a previously validated high-performance liquid chromatography (HPLC) method [14]. Over the calibration range 25–2500 ng ml−1, the interbatch imprecision of the method was 2.9–7.3% (Study A) and 1.2–4.1% (Study B), and the inaccuracy was 1.1–4.5% (Study A) and 1.5–4.4% (Study B). The lower limit of quantification was 10 ng ml−1 with an imprecision of 0.5% (Study A) and 0.6% (Study B) at this limit, as determined from back-calculated concentrations of the calibration standards.
Samples were assayed for phenytoin using a previously validated HPLC method. Following protein precipitation using perchloric acid, separation of the analytes was achieved by reverse-phase HPLC prior to UV detection at 210 nm. In Study B, plasma samples collected 8 h postdose on days 7 and 17 were dialysed against buffer solution, prior to the phenytoin assay and determination of phenytoin protein binding.
In Study A, the interbatch imprecision ranged from 5.74% at a phenytoin concentration of 1.0 µg ml−1 to 1.74% at 25 µg ml−1, with an inaccuracy of 5.5–9.16%, respectively. In Study B, the imprecision over the same concentration range varied from 1.71 to 3.40% and the inaccuracy from −10.8 to 0.98%. The lower and upper limits of quantification for phenytoin in both studies were 1 µg ml−1 and 25 µg ml−1, respectively.
Safety assessments
Safety was assessed on the basis of adverse events, clinical laboratory tests, physical examinations, and 12-lead ECGs. Adverse events were recorded throughout the study and included adverse drug reactions, illnesses with onset during the study, exacerbations of pre-existing illnesses, and objective test findings resulting in a change in study drug dose or discontinuation.
Clinical laboratory tests (haematology, clinical chemistry, and urinalysis), physical examination (including supine blood pressure and pulse rate), 12-lead ECG and ophthalmological tests (Study B only) were performed at routine intervals throughout both studies. Blood samples were regularly checked using a rapid assay technique to ensure that phenytoin levels did not exceed 20 µg ml−1. These assays were performed using an enzyme immunoassay technique (EMIT) run on a COBAS Mira analyser.
Parameter calculations
The maximum observed plasma concentration (Cmax) and the time to the first postdose occurrence of Cmax (tmax) were obtained directly from the recorded plasma concentration–time data. The area under the plasma concentration–time curve within a dosing interval (AUCτ) was calculated using the linear trapezoidal method.
Statistical analysis
A sample size of 24 subjects (12 per treatment group) was chosen in both studies to allow for five Study A or six Study B subjects to be dropped for exceeding the toleration threshold for phenytoin (20 µg ml−1) or for not reaching steady state. This sample size was sufficient to detect a difference of 30% between study drugs in changes from baseline for AUCτ (Study A) or Cmax (Study B) with at least 80% power when testing (two-sided) at the 5% level. This calculation assumed that a day 7 baseline was used in the analysis and was based upon previous pharmacokinetic studies conducted by the sponsor (Pfizer Inc, data on file).
Log-transformed AUCτ and Cmax and untransformed tmax were subjected to an analysis of variance (anova) appropriate for a parallel-group study with repeated measures. The anova allowed for variation due to subject, day, group, and day by group interaction. The last term was tested against within-subject variation to form an overall test for equality of changes from baseline (day 7) between treatment groups.
In both studies, changes in pharmacokinetic parameters and 90% confidence intervals (CI) were calculated for each group separately (day 21 vs. day 7 in Study A, day 17 vs. day 7 in Study B). In addition, the differences and 90% CI between the treatment groups were calculated for changes between day 7 and day 21 (Study A) or day 7 and day 17 (Study B). In Study A, day 28 vs. day 7 changes in pharmacokinetic parameters and 90% CI were also calculated for the voriconazole + phenytoin group.
Results
Subjects
In Study A, 24 subjects received study drug (12 voriconazole + phenytoin; 12 voriconazole + placebo). Five subjects in the voriconazole + phenytoin group withdrew from the study, four as a result of plasma phenytoin levels which exceeded the predefined safety limit (20 µg ml−1) and one due to symptoms related to a dental abscess. Two of the four subjects with elevated plasma phenytoin levels were discontinued without completing the voriconazole + phenytoin dosing period, and were consequently excluded from the pharmacokinetic analyses, due to insufficient data. Thus a total of 10 subjects in the voriconazole + phenytoin group were included in the pharmacokinetic analysis. One subject in the voriconazole + placebo group withdrew as a result of nonstudy drug-related nausea, vomiting, diarrhoea, and headache, and was not evaluable for pharmacokinetic assessment. All 24 subjects were included in the safety analysis (Table 1).
Table 1.
Baseline demographic characteristics of all subjects.
| Study A | Study B | |||
|---|---|---|---|---|
| Voriconazole + phenytoin | Voriconazole + placebo | Phenytoin → phenytoin + voriconazole | Phenytoin → phenytoin + placebo | |
| Number of subjects | ||||
| Treated | 12 | 12 | 11 | 11 |
| Analysed for PK | 10 | 11 | 6 | 9 |
| Analysed for safety | 12 | 12 | 11 | 11 |
| Mean age, years (range) | 29 (20–44) | 29 (20–42) | 26 (18–39) | 28 (19–37) |
| Mean weight, kg (range) | 76 (59–93) | 77 (61–91) | 70 (60–86) | 75 (62–86) |
| Mean height, cm (range) | 179 (159–187) | 177 (166–185) | 175 (167–184) | 178 (169–186) |
In Study B, 25 subjects were randomized to study drug, three of whom were withdrawn in the initial ‘phenytoin only’ phase. Two subjects were withdrawn due to plasma phenytoin levels exceeding 20 µg ml−1 and one withdrew consent for reasons unrelated to study drug administration. The remaining 22 subjects were randomized to receive either phenytoin + voriconazole or phenytoin + placebo (11 subjects per group). Five of the 11 subjects in the phenytoin + voriconazole group withdrew from the study due to study drug-related events: three due to trough plasma phenytoin levels exceeding 20 µg ml−1, one due to a maculopapular rash, and one due to intermittent vomiting. Two of the 11 subjects in the phenytoin + placebo group did not complete the study due to study drug-related adverse events: one due to a rash and the other due to a combination of symptoms, including moderate dizziness, headache, and nausea. The five subjects withdrawn from the phenytoin + voriconazole group, and the two withdrawn during phenytoin + placebo administration were included in the safety assessments, but were excluded from the pharmacokinetic analyses (Table 1).
The demographic characteristics of the groups within each study indicated that the subjects were well matched for age, height, and weight (Table 1).
Pharmacokinetic parameters
Effect of phenytoin on voriconazole (Study A)
The mean plasma voriconazole concentrations up to 12 h postdose on days 7 and 21 were similar when voriconazole was administered either alone or with placebo (Figure 1a). However, when voriconazole was administered with phenytoin, there was a reduction in the mean plasma voriconazole concentrations up to 12 h postdose on day 21 (Figure 1b). Increasing the dose of voriconazole from 200 mg twice daily to 400 mg twice daily compensated for the effect of phenytoin on plasma voriconazole levels (Figure 1b).
Figure 1.

Mean plasma voriconazole concentrations up to 12 h postdose in the (a) voriconazole + placebo group on days 7 and 21 (n = 11) and (b) voriconazole + phenytoin group on days 7, 21 (n = 10) and 28 (n = 7).
Phenytoin caused a decrease in the mean Cmax and AUCτ of plasma voriconazole (Table 2). In the voriconazole + phenytoin group, the day 21/day 7 ratio for Cmax was 60.7%. When the change in the day 21/day 7 ratio for the voriconazole + placebo group (120%) was taken into account, this was reduced to 50.7% (90% CI 38.8, 66.1). Similarly, the day 21/day 7 ratio for AUCτ was 35.9% for voriconazole + phenytoin, which decreased to 30.6% (90% CI 23.5, 39.7) when the change in AUCτ in the voriconazole + placebo group (117.3%) was taken into account.
Table 2.
Summary of mean pharmacokinetic parameters for voriconazole in plasma (Study A).
| Voriconazole 200 mg + phenytoin 300 mg (n = 10) | Voriconazole 200 mg + placebo (n = 11) | Voriconazole 400 mg + phenytoin 300 mg (n = 7) | |||||||
|---|---|---|---|---|---|---|---|---|---|
| Parameter | Day 7* | Day 21 | Day 21/day 7 (90% CI) | Day 7* | Day 21 | Day 21/day 7 (90% CI) | Day 7* | Day 28 | Day 28/day 7 (90% CI) |
| Cmax (ng ml−1)† | 2160 | 1311 | 60.7% | 1998 | 2 394 | 120% | 2194 | 2 931 | 134% |
| (50.1, 73.6) | (99.8, 144) | (89.2, 200) | |||||||
| AUCτ (ng·h ml−1)† | 8613 | 3089 | 35.9% | 9416 | 11 048 | 117% | 8852 | 12 303 | 139% |
| (29.7, 43.3) | (98.0, 141) | (97.3, 199) | |||||||
| tmax (h)‡ | 1.0 | 1.1 | 0.1 | 1.5 | 1.5 | − 0.1 | 1.1 | 1.6 | 0.5 |
| (− 0.4, 0.5) | (− 0.5, 0.3) | (− 0.4, 1.4) | |||||||
Day 7 data: 200 mg voriconazole in all cases.
Adjusted geometric mean; day 21/day 7 comparison expressed as a percentage.
Adjusted arithmetic mean; day 21–day 7 comparison.
In the subjects for whom the dose of voriconazole was increased from 200 mg to 400 mg twice daily, the day 28/day 7 ratios were 134% (90% CI 89.2, 200) for Cmax and 139% (90% CI 97.3, 199) for AUCτ. Furthermore, Cmax and AUCτ on day 28 were similar to values in the voriconazole + placebo group on day 21 (Table 2).
Effect of voriconazole on phenytoin (Study B)
Visual inspec-tion of mean plasma phenytoin concentrations in both groups up to 24 h postdose on days 7 and 17 showed that concomitantly administered voriconazole increased plasma phenytoin levels (Figure 2).
Figure 2.
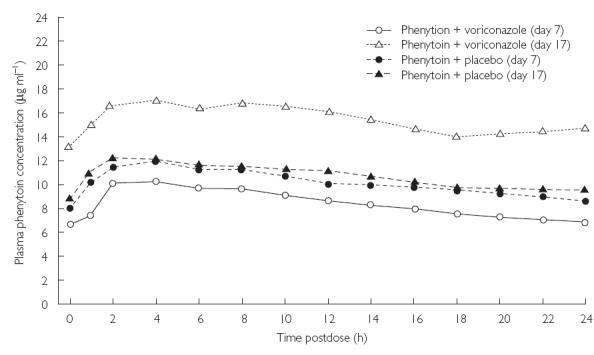
Mean plasma phenytoin concentrations up to 24 h postdose in the phenytoin + voriconazole (n = 6) and phenytoin + placebo (n = 9) groups on days 7 and 17.
The coadministration of phenytoin with voriconazole increased the Cmax and AUCτ of plasma phenytoin. For Cmax, the ratio between the day 17/day 7 ratio in the phenytoin + voriconazole group (168%) and the day 17/day 7 ratio in the phenytoin + placebo group (101%) was 167% (90% CI 144, 193; Table 3). For AUCτ, the ratio between the day 17/day 7 ratio in the phenytoin + voriconazole group (185%) and the day 17/day 7 ratio in the phenytoin + placebo group (102%) was 181% (90% CI 156, 210; Table 3). The difference between the day 17–day 7 tmax value in the phenytoin + voriconazole group (0.7 h) and the day 17–day 7 tmax value in the phenytoin + placebo group (− 1.3 h) was 2.0 h (90% CI −0.4, 4.4; Table 3).
Table 3.
Summary of mean pharmacokinetic parameters for phenytoin in plasma (Study B).
| Phenytoin + voriconazole (P + V) | Phenytoin + placebo (P + P) | ||||||
|---|---|---|---|---|---|---|---|
| Parameter | Day 7 | Day 17 | Day 17/day 7 (90% CI) | Day 7 | Day 17 | Day 17/day 7 (90% CI) | P + V/P + P (90% CI) |
| Cmax (µg ml−1)* | 10.15 | 17.09 | 168% | 11.91 | 12.04 | 101% | 167% |
| (150, 189) | (92.2, 111) | (144.0, 193) | |||||
| AUCτ (µg·h ml−1)* | 197 | 364 | 185% | 237 | 243 | 102% | 181% |
| (165, 208) | (93.2, 112) | (156, 210) | |||||
| tmax (h)† | 4.0 | 4.7 | 0.7 | 4.4 | 3.1 | − 1.3 | 2.0 |
| (−1.2, 2.5) | (− 2.8, 0.2) | (− 0.4, 4.4) | |||||
Geometric mean; day 21/day 7 comparison expressed as a percentage.
Arithmetic mean; day 21–day 7 comparison.
There were no clinically significant differences between groups in levels of phenytoin protein binding at either time point. In the phenytoin + voriconazole group, 13.8 ± 1.3% (day 7) and 14.1 ± 1.0% (day 17) of phenytoin was protein bound (mean ± SD). Similarly, 12.4 ± 2.0% (day 7) and 13.8 ± 2.5% (day 17) was protein bound in the phenytoin + placebo group.
Safety
Both studies demonstrated that voriconazole and phenytoin, administered either alone or in combination, were well tolerated by the majority of subjects.
In Study A, most adverse events were mild or moderate in nature, with only two severe study drug-related events, headache and ataxia, experienced by subjects in the voriconazole + phenytoin group (Table 4). Neither of these events resulted in discontinuation, or dose reductions. Four subjects in the voriconazole + phenytoin group were withdrawn from the study due to elevated phenytoin levels (trough plasma concentrations >20 µg ml−1). At the time of withdrawal, these subjects had trough plasma phenytoin concentrations of 21.0 µg ml−1 (day 26), 22.0 µg ml−1 (day 19), 22.9 µg ml−1 (day 24), and 23.4 µg ml−1 (day 17), respectively.
Table 4.
Number of subjects reporting treatment-related adverse events and withdrawals.
| Study A | Study B | |||
|---|---|---|---|---|
| Adverse event | Voriconazole + phenytoin (n = 12) | Voriconazole + placebo (n = 12) | Phenytoin → phenytoin + voriconazole (n = 11) | Phenytoin → phenytoin + placebo (n = 11) |
| Total | 9 | 5 | 10 | 8 |
| Headache* | 6 (1)‡ | 3 | 3 | 6 (1)‡ |
| Nausea* | 5 | 0 | 1 | 3 |
| Abnormal vision* | 2 | 1 | 3 | 2 |
| Dizziness* | 0 | 1 | 1 | 4 |
| Withdrawals | ||||
| Elevated phenytoin level† | 4 | 0 | 3 | 0 |
| Adverse events | 0 | 0 | 2 | 2 |
Adverse events reported by more than two subjects in any treatment group.
Trough plasma concentration >20 µg ml−1.
Values in parentheses indicate number of severe adverse events.
The patterns of adverse events in Study B were similar for both treatment groups. Two subjects in each group discontinued due to study drug-related adverse events (including rash, vomiting, and dizziness/headache). In addition, three subjects in the phenytoin + voriconazole group were discontinued due to elevated trough plasma phenytoin concentrations (Table 4). At the time of withdrawal, trough plasma phenytoin concentrations in these subjects were 21.3 µg ml−1 (day 14), 22.7 µg ml−1 (day 11), and 23.3 µg ml−1 (day 12), respectively. The majority of adverse events reported were either mild or moderate in intensity. Two subjects in each group reported severe adverse events: increased phenytoin levels and epistaxis in the phenytoin + voriconazole group, and headache and rash in the phenytoin + placebo group. In common with Study A, headache, nausea, and abnormal vision were the most commonly reported events.
Study drug-related visual events were reported in two subjects in each group in Study A. In addition, four subjects in the phenytoin + voriconazole group and two subjects in the phenytoin + placebo group in Study B reported similar events. Most events were classified as abnormal vision, all were mild in nature and of short duration, and all resolved without intervention. Ophthalmological tests, conducted in Study B only, included visual acuity, visual fields, external tests and funduscopy and were considered normal for all subjects both at screening and follow-up.
There were no clinically significant laboratory test abnormalities that could be attributed to the administration of voriconazole or phenytoin in either study.
Discussion
These investigations show that phenytoin reduces plasma voriconazole concentrations when the latter is given at a dose of 200 mg twice daily, but that this reduction can be compensated for by increasing the voriconazole dose to 400 mg twice daily. In addition, administration of voriconazole at the higher dose regimen of 400 mg twice daily resulted in increases in plasma levels of phenytoin. Voriconazole and phenytoin appeared to be well tolerated when administered either individually or together.
Phenytoin reduced voriconazole Cmax and AUCτ by 49% and 69%, respectively, compared with steady-state voriconazole levels achieved with 200 mg twice-daily dosing. However, when the voriconazole dose was increased to 400 mg twice daily, Cmax and AUCτ were increased by 34% and 39%, respectively. Considering the normal interindividual variations observed in voriconazole pharmacokinetics [15], and the fact that the range of plasma levels was comparable to those in previous studies, these increases in plasma voriconazole concentrations are unlikely to be of clinical significance.
In contrast, compensating for the effects of induction of voriconazole metabolism by increasing the dose of voriconazole to 400 mg bid, increased phenytoin Cmax and AUCτ by 67% and 81%, respectively, compared with placebo. Given that phenytoin has a narrow therapeutic window, such increases in plasma concentrations have the potential to lead to clinical signs of toxicity. Therefore, frequent monitoring of plasma phenytoin concentrations and phenytoin-related adverse events is recommended when phenytoin is coadministered with voriconazole. The upper limit of plasma phenytoin concentrations chosen for this study was based on the upper limit of the accepted therapeutic window of 10–20 µg ml−1 [11].
The pharmacokinetic interactions observed between voriconazole and phenytoin in these studies are to be expected. Studies reporting reduced Cmax concentrations of ketoconazole, itraconazole, and fluconazole in the presence of phenytoin have been published [12, 13, 16]. Phenytoin is known to induce the CYP3A4 isoenzyme involved in the metabolism of other azoles [10], as well as acting as both a substrate and inducer of CYP2C19 and CYP2C9. Furthermore, increased levels of phenytoin in the presence of fluconazole have also been reported [17, 18]. Such interactions are clinically very important, causing failure of antifungal therapy and symptomatic phenytoin toxicity, respectively.
Based on the results of our studies, the reduced plasma concentrations of voriconazole in the presence of phenytoin can be compensated for by increasing the voriconazole dose, without apparent safety or tolerability implications. All the treatments were well tolerated by the majority of subjects, with most adverse events being classified as either mild or moderate. The only severe study drug-related adverse events which were reported in this investigation (headache and ataxia) are well-known side-effects of phenytoin [11]. Voriconazole at either 200 mg or 400 mg twice daily administered with 300 mg phenytoin once daily was well tolerated.
In conclusion, when voriconazole is coadministered with phenytoin, doubling the dose of voriconazole to 400 mg twice daily restores steady-state voriconazole plasma concentrations to the levels observed following voriconazole 200 mg twice daily alone. It is recommended that phenytoin levels should be routinely monitored and its dose adjusted to ensure the maintenance of therapeutic plasma levels when phenytoin is coadministered with voriconazole.
Acknowledgments
HPLC analyses of plasma voriconazole concentrations were undertaken by Huntingdon Life Sciences (Huntingdon, UK). Phenytoin HPLC and protein binding assays were conducted by Medeval Ltd (Manchester, UK). Dialysis of plasma samples prior to phenytoin analyses was performed by Clinical Innovations Ltd (Kenilworth, UK).
References
- 1.Cuenca-Estrella M, Rodriguez-Tudela JL, Mellado E, Martinez-Suarez JV, Monzon A. Comparison of the in vitro activity of voriconazole (UK-109,496), itraconazole and amphotericin B against clinical isolates of Aspergillus fumigatus. J Antimicrob Chemother. 1998;42:531–533. doi: 10.1093/jac/42.4.531. [DOI] [PubMed] [Google Scholar]
- 2.Espinel-Ingroff A. In vitro activity of the new triazole voriconazole (UK-109496) against opportunistic filamentous and dimorphic fungi and common and emerging yeast pathogens. J Clin Microbiol. 1998;36:198–202. doi: 10.1128/jcm.36.1.198-202.1998. [DOI] [PMC free article] [PubMed] [Google Scholar]
- 3.Chandrasekar PH, Manavathu E. Voriconazole: a second-generation triazole. Drugs Today. 2001;37:135–148. doi: 10.1358/dot.2001.37.2.614849. [DOI] [PubMed] [Google Scholar]
- 4.Torre-Cisneros J, Gonzalez-Ruiz A, Hodges MR, Lutsar I. Program and Abstracts of the 38th Annual Meeting of the Infectious Diseases Society of America. New Orleans, LA: September 2000. Voriconazole (VORI) for the treatment of S. apiospermum and S. prolificans infection. Abstract 305, September. [Google Scholar]
- 5.Perfect J, Gonzalez-Ruiz A, Lutsar I. Program and Abstracts of the 38th Annual Meeting of the Infectious Diseases Society of America. New Orleans, LA: September 2000. Voriconazole (VORI) for the treatment of resistant and rare fungal pathogens. Abstract 303, September. [Google Scholar]
- 6.Sheehan DJ, Hitchcock CA, Sibley CM. Current and emerging azole antifungal agents. Clin Microbiol Rev. 1999;12:40–79. doi: 10.1128/cmr.12.1.40. [DOI] [PMC free article] [PubMed] [Google Scholar]
- 7.Koltin Y, Hitchcock CA. Progress in the search for new triazole antifungal agents. Curr Opin Chem Biol. 1997;1:176–182. doi: 10.1016/s1367-5931(97)80007-5. [DOI] [PubMed] [Google Scholar]
- 8.Patterson BE, Coates PE. Program and Abstracts of the 35th Interscience Conference on Antimicrobial Agents and Chemotherapy. San Francisco: 1995. UK 109,496, a novel, wide-spectrum triazole derivative for the treatment of fungal infections: Pharmacokinetics in man. Abstract F78, September. [Google Scholar]
- 9.Patterson BE, Roffey S, Jezequel SG, Jones B. Program and Abstracts of the 35th Interscience Conference on Antimicrobial Agents and Chemotherapy. San Francisco: 1995. UK 109,496, a novel, wide-spectrum triazole derivative for the treatment of fungal infections: disposition in man. Abstract F79, September. [Google Scholar]
- 10.Nishibe Y, Hirata M. Induction of cytochrome P450 3A (CYP 3A) by E 5110, a non-steroidal anti-inflammatory agent (NSAID), and typical CYP 3A inducers in primary cultures of dog hepatocytes. Biol Pharm Bull. 1995;18:1142–1144. doi: 10.1248/bpb.18.1142. [DOI] [PubMed] [Google Scholar]
- 11.Physicians' Desk Reference. 52. Montvale, NJ: Medical Economics Group, Inc; 1998. pp. 2087–2092. [Google Scholar]
- 12.Touchette MA, Chandrasekar PH, Milad MA, Edwards DJ. Contrasting effects of fluconazole and ketoconazole on phenytoin and testosterone disposition in man. Br J Clin Pharmac. 1992;34:75–78. doi: 10.1111/j.1365-2125.1992.tb04111.x. [DOI] [PMC free article] [PubMed] [Google Scholar]
- 13.Ducharme MP, Slaughter RL, Warbasse LH, et al. Itraconazole and hydroxyitraconazole serum concentrations are reduced more than tenfold by phenytoin. Clin Pharmacol Ther. 1995;58:617–624. doi: 10.1016/0009-9236(95)90017-9. [DOI] [PubMed] [Google Scholar]
- 14.Stopher DA, Gage R. Determination of a new antifungal agent, voriconazole, by multidimensional high-performance liquid chromatography with direct plasma injection onto a size-exclusion column. J Chromatogr B Biomed Sci Appl. 1997;691:441–448. doi: 10.1016/s0378-4347(96)00408-2. [DOI] [PubMed] [Google Scholar]
- 15.Purkins L, Wood N, Ghahramani P, Greenhalgh K, Allen MJ, Kleinermans D. Pharmacokinetics and safety of voriconazole following intravenous to oral dose escalation regimens. Antimicrob Agents Actions. 2002;46:2546–2553. doi: 10.1128/AAC.46.8.2546-2553.2002. [DOI] [PMC free article] [PubMed] [Google Scholar]
- 16.Tucker RM, Denning DW, Hanson LH, et al. Interaction of azoles with rifampin, phenytoin, and carbamazepine: in vitro and clinical observations. Clin Infect Dis. 1992;14:165–174. doi: 10.1093/clinids/14.1.165. [DOI] [PubMed] [Google Scholar]
- 17.Cadle RM, Zenon GJ, 3rd, Rodriguez-Barrxadas MC, Hamill RJ. Fluconazole-induced symptomatic phenytoin toxicity. Ann Pharmacother. 1994;28:191–195. doi: 10.1177/106002809402800206. [DOI] [PubMed] [Google Scholar]
- 18.Blum RA, Wilton JH, Hilligoss DM, et al. Effect of fluconazole on the disposition of phenytoin. Clin Pharmacol Ther. 1991;49:420–425. doi: 10.1038/clpt.1991.49. [DOI] [PubMed] [Google Scholar]