

Abstract
Aims
Voriconazole is a potent new triazole with broad-spectrum antifungal activity against clinically significant and emerging pathogens. The present study evaluated the safety, toleration, and pharmacokinetics of oral voriconazole after single and multiple dosing.
Methods
Sixty-four healthy subjects were randomized to receive treatment and 56 completed the study. Groups of eight subjects each received voriconazole doses of 2 mg kg−1 twice daily, 4 mg kg−1 once daily, 2 mg kg−1 three times daily, or 3 mg kg−1 twice daily. Eleven subjects received 1.5 mg kg−1 three times daily, and 21 subjects were administered placebo.
Results
Voriconazole exhibited nonlinear (dose- and time-dependent) pharmacokinetics. This deviation from linear pharmacokinetics was confirmed by linearity ratios of >1 and decreasing kel values on multiple dosing, with a consequent increase in the terminal phase t1/2. There was also notable intersubject variability in Cmax and AUCτ. The absorption of voriconazole was rapid (mean tmax = 0.9–1.7 h) after single and multiple dosing and the decline in plasma concentration–time curves after tmax was generally biphasic. By day 12, the Cmax, AUCτ, tmax, and t1/2 values for the 3 mg kg−1 twice-daily group were 2356 ng ml−1, 11 170 ng·h ml−1, 1.1 h, and 6.4 h, respectively. The observed accumulation of voriconazole after multiple dosing was greater than predicted from single-dose data. Accumulation ratios for Cmax and AUCτ, which were 1.97 and 3.55, respectively, for the group given voriconazole 3 mg kg−1 twice daily, varied between treatment groups and appeared to be influenced by total daily dose and the frequency and duration of dosing. Visual inspection of Cmin values together with statistical analyses of Cmax and AUCτ values suggest that steady-state levels were achieved by the fifth to sixth day of multiple dosing. Plasma concentrations of voriconazole were well above the minimum inhibitory concentrations (MICs) for Aspergillus spp., Candida spp., and for most emerging fungal pathogens (Cmin > 0.8 µg ml−1). Voriconazole was well tolerated: most treatment-related adverse events (abnormal vision, headache, dizziness) were mild and resolved within an hour of dosing.
Conclusions
The oral dosing regimen selected for subsequent Phase II/III clinical trials on the basis of these results was 200 mg twice daily, equivalent to 3 mg kg−1 twice daily.
Keywords: pharmacokinetics, safety, tolerability, voriconazole
Introduction
Life-threatening opportunistic fungal infections are becoming an increasingly important clinical problem in patients who are severely immunocompromised due to cancer chemotherapy, organ or bone marrow transplantation, acquired immune deficiency syndrome (AIDS) or long-term antibiotic therapy [1–3]. Candida spp. (particularly C. albicans) and Aspergillus spp. are the most common organisms causing potentially fatal, secondary fungal infections in severely immunocompromised patients [4–6]. However, an increasingly divergent range of fungi, including Scedosporium and Fusarium spp., have emerged as clinically important pathogens in these patients [7–10]. Infections with these species are often refractory to conventional antifungal therapies, including amphotericin B and azole derivatives, such as ketoconazole, itraconazole, and fluconazole [11–13].
Amphotericin B has been the gold standard for the treatment of life-threatening opportunistic infections for many years. However, mortality rates in some patients with Aspergillus infection have been reported to be as high as 75–100%, despite amphotericin B therapy [14]. Furthermore, intravenous infusion of amphotericin B can result in side-effects such as fever, nausea, and renal toxicity [15, 16]. Although lipid formulations appear to be better tolerated than conventional amphotericin B, their use can be limited by cost considerations [17], and dosing recommendations have yet to be finalized [18].
Itraconazole has been used successfully to treat invasive aspergillosis in immunocompromised patients [19–23]. However, variable absorption following oral administration limits the utility of itraconazole in many patients, and low serum itraconazole concentrations have been correlated with treatment failure and poor outcome [19, 20]. Intravenous formulations of itraconazole, which result in improved bioavailability, are regarded as at least as effective as conventional amphotericin B [17], although direct clinical data comparing these agents are lacking [24].
The older azole antifungal agents, such as ketoconazole, fluconazole, and miconazole, are effective against many pathogenic fungi, but have only limited activity against Aspergillus spp. [25, 26]. Moreover, ketoconazole also has the potential to cause hepatotoxicity [27, 28].
Voriconazole is a new triazole antifungal agent, developed as oral and intravenous formulations, with potent activity against a wide spectrum of clinically significant pathogens, including Aspergillus and Candida spp. [29–31], and emerging fungal pathogens, such as Scedosporium and Fusarium spp. [32, 33].
The objectives of this study were to evaluate the safety, toleration, pharmacokinetics, and dose proportionality of voriconazole after single and multiple oral dose adminis-tration to healthy male volunteers. The doses of 2 mg kg−1 twice daily, 4 mg kg−1 once daily, 1.5 mg kg−1 three times daily, 2 mg kg−1 three times daily, and 3 mg kg−1 twice daily were selected to identify the most appropriate dosing regimen with which to evaluate voriconazole in subsequent Phase II/III clinical trials.
Methods
Study subjects
Healthy male volunteers aged 18–45 years, weighing 60–94 kg, with a body mass index of between 18 and 25 according to Quetelet's index [weight(kg)/height2(m)] were eligible for inclusion in this study. Volunteers were excluded if they had laboratory or physical abnormalities, or a history of clinically significant allergies, especially to medical treatments.
Study design
This single-blind, multiple-dose, placebo-controlled, parallel-group, dose-finding study was conducted according to a study protocol approved by an independent review board at the study site (Besselaar Clinical Research Unit, Leeds, UK).
Five groups of 12 healthy men were randomized to receive either oral voriconazole at doses up to 6 mg kg−1 day−1 (i.e. 2 mg kg−1 twice daily, 1.5 mg kg−1 three times daily, 2 mg kg−1three times daily, 3 mg kg−1twice daily, 4 mg kg−1 once daily) or placebo (active : placebo ratio 2 : 1) for 10 days. Subjects received a single dose at approximately 08.00 hours on day 1. On days 3–11 the twice-daily dose regimen was administered at approximately 08.00 and 20.00 hours and the three-times daily dose regimen was administered at approximately 08.00, 16.00 and 24.00 hours. A final dose was given at 08.00 hours on day 12. The dosage regimen for each treatment group is shown in Table 1.
Table 1.
Dosing regimens – subjects received either active drug in the regimens shown or matched placebo (active : placebo ratio 2 : 1).
| Treatment group | Day 1 | Days 3–11 | Day 12 |
|---|---|---|---|
| 1 | 1.5 mg kg−1 once daily | 1.5 mg kg−1 three-times daily | 1.5 mg kg−1 once daily |
| 2 | 2 mg kg−1 once daily | 2 mg kg−1 three-times daily | 2 mg kg−1 once daily |
| 3 | 3 mg kg−1 once daily | 3 mg kg−1 twice daily | 3 mg kg−1 once daily |
| 4 | 2 mg kg−1 once daily | 2 mg kg−1 twice daily | 2 mg kg−1 once daily |
| 5 | 4 mg kg−1 once daily | 4 mg kg−1 once daily | 4 mg kg−1 once daily |
Pharmacokinetic sampling
Venous blood samples (sufficient to provide 3 ml plasma) were collected by repeated venepuncture or via an indwelling cannula, and transferred into heparinized tubes. On day 1, these were collected immediately before dosing, at frequent intervals for up to 12 h post morning dose, and at 18, 24, 32, and 48 h. On day 12, plasma samples were taken at comparable times to day 1 with additional samples collected at 28 and 40 h following the morning dose in all groups. Frequent samples were collected up to 12 h following the morning dose on days 3 and 7 (Groups 1–3) and days 5 and 8 (Groups 4 and 5). Samples were also collected at 18 and 24 h from subjects in Group 5 (days 5 and 8). On days 4–11 (Groups 1–3) and days 3–11 (Groups 4 and 5) blood samples were additionally collected prior to the morning dose.
Blood samples were centrifuged at 1500 g for 10–15 min at 4 °C within 30 min of collection. Prior to analysis, the plasma samples were stored in screw-capped polypropylene tubes at −20 °C.
Voriconazole assay
Plasma samples were assayed using a previously validated high-performance liquid chromatography assay with UV detection [34]. The lower limit of quantification was 10 ng ml−1and the calibration range was 10–3000 ng ml−1. Where samples had a concentration of >3000 ng ml−1, a 0.2-ml sample was diluted with 0.5 ml of blank human plasma. Nine calibration standards covering the range 10–3000 ng ml−1 and six quality control samples were analysed daily with the samples. The samples were randomized in each run.
Safety assessments
All adverse events that occurred during treatment or up to 7 days after treatment were recorded. Where possible, information on the severity, time of onset and duration of adverse events was recorded, together with the investigator's assessment of their relationship to treatment. Investigators were also requested to report any serious adverse events occurring up to 30 days after the end of the study.
Routine clinical laboratory tests, haematology, clinical chemistry, and urinalysis were performed on samples taken at screening and at the following time points; 0 (predose), 24 and 48 h postdose on day 1; 0 (premorning dose) on day 7; 0 (predose), 24 and 48 h postdose on day 12.
Measurements of vital signs (supine and standing systolic and diastolic blood pressure and pulse rate) and a 12-lead electrocardiogram (ECG) were performed at screening, before administration, and at regular intervals throughout the study. In addition, a 24-h Holter recording was performed at screening, and starting 30 min before administration of the morning dose on days 1, 7, and 12.
Pharmacokinetic parameters
The maximum observed plasma concentration (Cmax) and the time to the first occurrence of Cmax (tmax) were obtained directly from the plasma concentration–time curves. The area under the plasma concentration–time curve to the last sample time above the limit of quantification (AUCt) and from time zero (predose) until the end of the dosing interval (AUCτ) were obtained by the linear trapezoidal rule. The area under the plasma concentration–time curve extrapolated to infinity (AUCinf) was calculated from AUCt + Ct/kel, where Ct is the concentration at the last sample time above the limit of quantification and kel is the terminal elimination phase rate constant. kel was estimated by log-linear regression analysis on those data points visually assessed to be on the terminal log-linear phase. The terminal elimination phase half-life (t1/2) was calculated as 0.693/kel. Accumulation ratios were calculated from Cmax and AUCτ and the deviation from linearity was assessed from the ratio AUCτ(multiple dose)/AUC(single dose). The predicted accumulation was calculated from the ratio AUC(day1)/AUCτ(day1). Dose proportionality was assessed by visual examination of the data only.
Statistical analysis
For each treatment group, natural log-transformed Cmax and AUCτ and untransformed tmax and kel were subjected to an analysis of variance procedure, which allowed for variation due to subjects and days. For Cmax and AUCτ, treatment means were back transformed to provide geometric means on the original scale of measurement. Natural log-transformed Cmax and AUCτ accumulation ratios and the linearity ratio were subjected to analysis of variance procedure, which allowed for variation due to subjects and treatments. All analyses and tabulations were performed using SAS/STAT® (SAS Institute Inc., North Carolina, USA) software [35].
Results
Subject demographics
The demographic characteristics are summarized in Table 2. Three of the eight subjects originally randomized to receive voriconazole 1.5 mg kg−1 three times daily (Group 1) were withdrawn early and replaced by three further subjects. Therefore, a total of 11 subjects received voriconazole 1.5 mg kg−1 three times daily. A total of 21 subjects received placebo. All subjects who received voriconazole were included in the safety evaluation. Six subjects were excluded from the pharmacokinetic evaluation because they failed to complete the study; one of these subjects asked to be withdrawn from the study voluntarily.
Table 2.
Baseline demographic characteristics of all randomized subjects.
| Voriconazole | ||||||
|---|---|---|---|---|---|---|
| 2 mg kg−1twice daily (Group 4) | 4 mg kg−1once daily (Group 5) | 1.5 mg kg−1three-times daily (Group 1) | 2 mg kg−1three-times daily (Group 2) | 3 mg kg−1three-times daily (Group 3) | Placebo | |
| Number of subjects | 8 | 8 | 11 | 8 | 8 | 21 |
| Mean age in years (range) | 26 (20–36) | 25 (20–37) | 27 (20–45) | 31 (21–44) | 25 (18–30) | 26 (18–43) |
| Mean weight in kg (range) | 74 (66–89) | 74 (66–94) | 73 (60–90) | 74 (64–87) | 73 (61–87) | 70 (61–86) |
| Mean height in cm (range) | 180 (174–182) | 178 (171–186) | 178 (172–192) | 177 (165–186) | 179 (171–188) | 178 (167–189) |
Pharmacokinetics
Mean plasma concentration–time profiles of voriconazole after single-dose (day 1) and multiple-dose (day 12) administration are illustrated in Figures 1 and 2. Mean pharmacokinetic parameters in plasma are summarized in Table 3. Mean tmax values after the single dose were similar in all treatment groups, ranging from 0.9 h in the 1.5 mg kg−1 three times daily group to 1.1 h in the 3 mg kg−1 twice daily group. After multiple dosing, the values for tmax were similar to those seen after single dosing, ranging from 0.9 h in the 2 mg kg−1 twice daily group to 1.7 h in the 3 mg kg−1 twice daily group. Plasma concentration and tmax values indicated that voriconazole was absorbed rapidly after oral administration and there was a biphasic decline in plasma levels once tmax had been attained.
Figure 1.
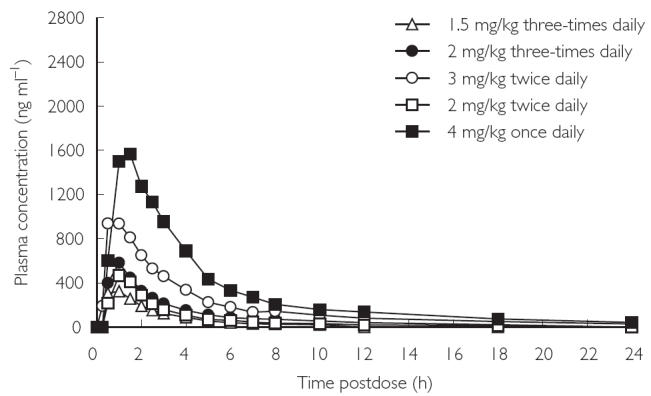
Mean plasma concentration–time profiles at day 1 (single dose).
Figure 2.

Mean plasma concentration–time profiles at day 12 (multiple dose).
Table 3.
Summary of mean pharmacokinetic parameters for voriconazole in plasma.
| Parameter | Day | 2 mg kg−1twice daily | 1.5 mg kg−1three-times daily | 4 mg kg−1once daily | 2 mg kg−1three-times daily | 3 mg kg−1twice daily |
|---|---|---|---|---|---|---|
| Cmax (ng ml−1)* | 1 | 485 | 364 | 1570 | 646 | 1194 |
| 12 | 1007 | 1106 | 2066 | 2184 | 2356 | |
| AUCτ (ng·h ml−1)* | 1 | 1179 | 882 | 5896 | 1435 | 3145 |
| 12 | 4296 | 3789 | 13 185 | 9044 | 11 170 | |
| tmax (h)† | 1 | 1.0 | 1.0 | 1.1 | 0.9 | 1.0 |
| 12 | 1.1 | 0.9 | 1.7 | 1.1 | 1.1 | |
| kel (h−1)† | 1 | 0.146 | 0.207 | 0.116 | 0.130 | 0.125 |
| 12 | 0.107 | 0.108 | 0.105 | 0.095 | 0.109 | |
| t1/2 (h)‡ | 1 | 4.7 | 3.3 | 6.0 | 5.3 | 5.5 |
| 12 | 6.5 | 6.4 | 6.6 | 7.3 | 6.4 |
Geometric mean.
Arithmetic mean.
Harmonic mean.
Visual inspection of Cmin plasma concentration–time profiles (Figure 3) and a statistical analysis of the contrast between individual days for Cmax and AUCτ indicated that steady state was attained by day 5 for the 2 mg kg−1 twice-daily and 4 mg kg−1 once-daily groups and day 7 for the 1.5 mg kg−1 three-times daily, 2 mg kg−1 three-times daily, and 3 mg kg−1 twice-daily groups. For the 2 mg kg−1 twice-daily and 4 mg kg−1 once-daily groups, there was no significant difference in Cmax or AUCτ between days 5 and 8 or days 8 and 12. For the 1.5 mg kg−1 three-times daily, 2 mg kg−1 three-times daily, and 3 mg kg−1 twice-daily groups, there was no significant difference in Cmax or AUCτ between days 7 and 12.
Figure 3.
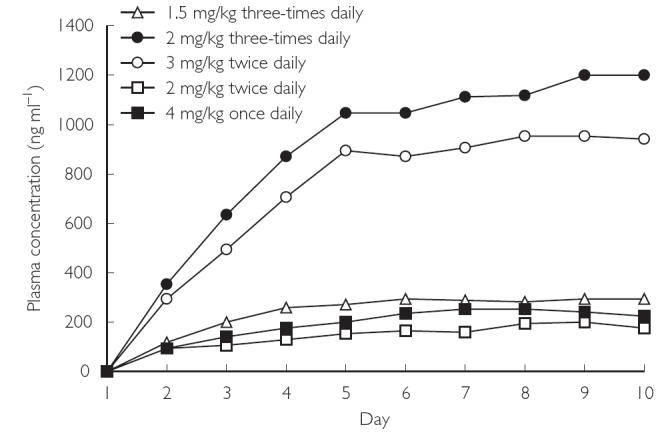
Mean Cmin values of multiple-dose oral regimens, days 1–10.
Comparison of single-dose and multiple-dose data across the treatment groups showed that the increase in adjusted geometric mean values of Cmax and AUCτ was not proportional to the increase in dose. Further-more, linearity ratios calculated from AUCτ(multiple dose)/AUC(single dose) on day 12 were >1 (range 2.12–4.37). This supports the evidence from single-dose data that voriconazole has nonlinear pharmacokinetics with respect to dose (Table 4).
Table 4.
Accumulation ratios after multiple dosing – relationship to frequency of administration.
| Accumulation ratio | Predicted | Linearity | ||
|---|---|---|---|---|
| Treatment group | AUCτ | Cmax | ratio | ratio |
| 4 mg kg−1 once daily | 2.24 | 1.32 | 1.06 | 2.12 |
| 2 mg kg−1 twice daily | 3.64 | 2.07 | 1.19 | 3.03 |
| 3 mg kg−1 twice daily | 3.55 | 1.97 | 1.19 | 2.98 |
| 1.5 mg kg−1 three times daily | 4.30 | 3.04 | 1.26 | 3.43 |
| 2 mg kg−1 three times daily | 6.30 | 3.38 | 1.44 | 4.37 |
Multiple dosing resulted in significant accumulation of voriconazole across all dosage groups. Observed mean accumulation ratios ranged from 1.32 to 3.48 for Cmax and from 2.24 to 6.30 for AUCτ, which were greater than predicted from single-dose data (range 1.06–1.35). Accumulation was generally associated with an apparent increase in mean terminal t1/2 and was not directly dose related, although it did appear to increase with increasing frequency of administration (Table 4).
There was wide intersubject variability in pharmacokinetic parameters, as evidenced by the standard deviations for Cmax, tmax, kel, AUCτ and t1/2. Mean t1/2 values were greater after multiple dosing than after the single dose, with the most marked difference evident in the 2 mg kg−1 twice-daily group (Table 3).
Safety
Five of the subjects who received voriconazole withdrew from the study due to the following adverse events: visual disturbances (n = 3) reported during the 2 mg kg−1 three-times daily treatment, a short run of ventricular tachycardia (three beats) (n = 1), and ST depression (n = 1) reported on days 7 and 9 of the 1.5 mg kg−1 three times daily treatment, respectively. None of these events was thought to be related to treatment. Two subjects from the placebo group withdrew from the study, one as the result of a vasovagal attack following the provision of a blood sample, and another as a consequence of a possible epileptic seizure.
Treatment-emergent adverse events were recorded for 29/43 (67%) subjects who received voriconazole treatment compared with 17/21 (81%) subjects who received placebo. One subject in the placebo group experienced a serious adverse event, a possible epileptic seizure, but the majority of events were reported as mild in nature. The most common adverse events are summarized in Table 5.
Table 5.
Numbers of subjects reporting adverse events (n > 2 in any treatment group).
| Voriconazole | ||||||
|---|---|---|---|---|---|---|
| Adverse event | 2 mg kg−1twice daily (n = 8) | 4 mg kg−1once daily (n = 8) | 1.5 mg kg−1three-times daily (n = 11) | 2 mg kg−1three-times daily (n = 8) | 3 mg kg−1twice daily (n = 8) | Placebo (n = 21) |
| Abnormal vision | 0 | 5 | 0 | 4 | 6 | 5 |
| Photophobia | 0 | 1 | 0 | 0 | 3 | 1 |
| Headache | 0 | 3 | 4 | 6 | 7 | 12 |
| Dizziness | 0 | 2 | 1 | 1 | 3 | 6 |
Visual disturbances, including abnormal vision, conjunctivitis, eye pain, lacrimation disorder, and photophobia were reported by a total of 16 subjects on active treatment; six subjects with voriconazole 4 mg kg−1 once daily and 3 mg kg−1 twice daily, and four subjects with voriconazole 2 mg kg−1 three times daily. Fourteen of the 16 subjects reported a change in brightness of vision. With the exceptions of a single moderate case of photophobia in the 3 mg kg−1 group and a single report of moderate conjunctivitis in the 2 mg kg−1 group, all visual adverse events were mild in nature. Visual adverse events were also reported by six subjects in the placebo group. All visual adverse events cleared without intervention or following discontinuation of study drug. Examination of the blood pressure, pulse rate, ECG and Holter data did not identify any trends associated with voriconazole administration.
Discussion
This study evaluated the pharmacokinetic and safety profile of single and multiple oral dosing regimens of the new antifungal agent voriconazole in healthy male volunteers.
The pharmacokinetic data from this study show that voriconazole exhibits nonlinear (dose- and time-dependent) pharmacokinetics after single and multiple dosing. In particular, increases in Cmax and AUCτ were not in proportion with increasing dose. The deviation from linear pharmacokinetics was confirmed in this multiple-dosing study by linearity ratios with values >1, as well as decreased kel values, which led to an increase in the terminal phase t1/2 compared with the single dose. There was also wide intersubject variability in pharmacokinetic parameters, particularly Cmax and AUCτ. Voriconazole was rapidly absorbed (mean tmax 0.9–1.7 h) after single and multiple dosing and the decline in plasma concentration following the attainment of Cmax was generally biphasic. After multiple dosing, voriconazole accumulation was greater than was predicted from the single-dose data, and was generally associated with an increase in mean terminal t1/2. Accumulation ratios for Cmax and AUCτ varied widely between dosage groups and appeared to be influenced by the total daily dose, as well as the frequency and duration of dosing. Visual inspection of Cmin values with statistical analyses of Cmax and AUCτ values suggested that steady-state levels were achieved by the third or fifth day of multiple dosing. The nonlinear pharmacokinetics of voriconazole may possibly be explained by partial saturation of hepatic first-pass metabolism and of systemic clearance with increasing exposure to the drug.
Multiple-dose administration of oral voriconazole was very well tolerated, even at daily doses of up to 6 mg kg−1. The most commonly reported adverse events were transient episodes of visual disturbance, headache, and dizziness. In addition, no clinically significant changes in laboratory safety tests or vital signs were reported in any of the subjects who received voriconazole. The visual adverse events were experienced by approximately 35% of voriconazole-treated subjects, and approximately 30% of placebo-treated subjects. All of these events were mild to moderate in nature, transient, and resolved spontaneously.
This study demonstrates that the concentrations of voriconazole achieved in plasma after oral administration are well above the minimum inhibitory concentrations (MICs) of voriconazole for Aspergillus spp. [geometric mean (GM) MIC 0.35–0.58 µg ml−1], Candida spp. (GMMIC 0.001–0.39 µg ml−1), and for many emerging fungal pathogens [36, 37]. The results justify further studies to establish the clinical efficacy of voriconazole in patients with opportunistic fungal infections. The 200 mg twice-daily (equivalent to 3 mg kg−1 twice daily) oral dosage regimen was selected for Phase II/III trials on the basis of its toleration, Cmin values that remained above the MIC of the key opportunistic pathogens on multiple dosing, and the practicality of a twice-daily dosing regimen.
References
- 1.Holmberg K, Meyer RD. Fungal infections in patients with AIDS and AIDS-related complex. Scand J Infect Dis. 1986;18:179–192. doi: 10.3109/00365548609032326. [DOI] [PubMed] [Google Scholar]
- 2.Glatt AE, Chirgwin K, Landesman SH. Treatment of infections associated with human immunodeficiency virus. N Engl J Med. 1988;318:1439–1448. doi: 10.1056/NEJM198806023182206. [DOI] [PubMed] [Google Scholar]
- 3.Armstrong D. Treatment of opportunistic fungal infections. Clin Infect Dis. 1988;16:1–7. doi: 10.1093/clinids/16.1.1. [DOI] [PubMed] [Google Scholar]
- 4.Banerjee SN, Emori TG, Culver DH, et al. Secular trends in nosocomial bloodstream infections in the United States, 1980–1989. National Nosocomial Infections Surveillance System. Am J Med. 1991;91(Suppl 3B):86S–89S. doi: 10.1016/0002-9343(91)90349-3. [DOI] [PubMed] [Google Scholar]
- 5.Jarvis WR. Epidemiology of nosocomial fungal infections, with emphasis on Candida species. Clin Infect Dis. 1995;20:1526–1530. doi: 10.1093/clinids/20.6.1526. [DOI] [PubMed] [Google Scholar]
- 6.Hadley S, Karchmer AW. Fungal infections in solid organ transplant recipients. Infect Dis Clin N Am. 1995;9:1045–1074. [PubMed] [Google Scholar]
- 7.Groll AH, Walsh TJ. Uncommon opportunistic fungi: new nosocomial threats. Clin Microbiol Infect. 2001;7(Suppl 2):8–24. doi: 10.1111/j.1469-0691.2001.tb00005.x. [DOI] [PubMed] [Google Scholar]
- 8.Ponton J, Ruchel R, Clemons KV, et al. Emerging pathogens. Med Mycol. 2000;38(Suppl 1):225–236. doi: 10.1080/mmy.38.s1.225.236. [DOI] [PubMed] [Google Scholar]
- 9.Morrison VA, Haake RJ, Weisdorf DJ. The spectrum on non-Candida fungal infections following bone marrow transplantation. Medicine. 1993;72:78–89. doi: 10.1097/00005792-199303000-00002. [DOI] [PubMed] [Google Scholar]
- 10.Dixon DM, McNeil MM, Cohen ML, Gellin BG, La Montagne JR. Fungal infections: a growing threat. Public Health Report. 1996;111:226–235. [PMC free article] [PubMed] [Google Scholar]
- 11.Warnock DW. Fungal infections in neutropenia: current problems and chemotherapeutic control. J Antimicrob Chemother. 1998;41(Suppl D):95–105. doi: 10.1093/jac/41.suppl_4.95. [DOI] [PubMed] [Google Scholar]
- 12.Munoz P, Marin M, Tornero P, et al. Successful outcome of Scedosporium apiospermum disseminated infection treated with voriconazole in a patient receiving corticosteroid therapy. Clin Infect Dis. 2000;31:1499–1501. doi: 10.1086/317496. [DOI] [PubMed] [Google Scholar]
- 13.Guerrero A, Torres P, Duran MT, et al. Airborne outbreak of nosocomial Scedosporium prolificans infection. Lancet. 2001;357:1267–1268. doi: 10.1016/S0140-6736(00)04423-8. [DOI] [PubMed] [Google Scholar]
- 14.Denning DW, Stevens DA. Antifungal and surgical treatment of invasive aspergillosis: review of 2,121 published cases. Rev Infect Dis. 1990;11:1147–1201. doi: 10.1093/clinids/12.6.1147. [DOI] [PubMed] [Google Scholar]
- 15.Goodwin SD, Cleary JD, Walawander CA, Taylor JW, Grasela TH., Jr Pretreatment regimens for adverse events related to infusion of amphotericin B. Clin Infect Dis. 1995;20:755–761. doi: 10.1093/clinids/20.4.755. [DOI] [PubMed] [Google Scholar]
- 16.Sawaya BP, Briggs JP, Schnermann J. Amphotericin B nephrotoxicity: the adverse consequences of altered membrane properties. J Am Soc Nephrol. 1995;6:154–165. doi: 10.1681/ASN.V62154. [DOI] [PubMed] [Google Scholar]
- 17.Meis JF, Verweij PE. Current management of fungal infections. Drugs. 2001;61(Suppl 1):13–25. doi: 10.2165/00003495-200161001-00002. [DOI] [PubMed] [Google Scholar]
- 18.Ellis M. Amphotericin B preparations: a maximum tolerated dose in severe invasive fungal infections? Transpl Infect Dis. 2000;2:51–61. doi: 10.1034/j.1399-3062.2000.020203.x. [DOI] [PubMed] [Google Scholar]
- 19.Denning DW, Lee JY, Hostetler JS, et al. NIAID Mycoses Study Group multicenter trial of oral itraconazole therapy for invasive aspergillosis. Am J Med. 1994;97:135–144. doi: 10.1016/0002-9343(94)90023-x. [DOI] [PubMed] [Google Scholar]
- 20.Grant SM, Clissold SP. Itraconazole. A review of its pharmacodynamic and pharmacokinetic properties, and therapeutic use in superficial and systemic mycoses. Drugs. 1989;37:310–344. doi: 10.2165/00003495-198937030-00003. [DOI] [PubMed] [Google Scholar]
- 21.Hostetler JS, Denning DW, Stevens DA. US experience with itraconazole in Aspergillus, Cryptococcus and Histoplasma infections in the immunocompromised host. Chemotherapy. 1992;38(Suppl 1):12–22. doi: 10.1159/000239048. [DOI] [PubMed] [Google Scholar]
- 22.Viviani MA, Tortorano AM, Pagano A, et al. European experience with itraconazole in systemic mycoses. J Am Acad Dermatol. 1990;23:587–593. doi: 10.1016/0190-9622(90)70260-o. [DOI] [PubMed] [Google Scholar]
- 23.Dupont B. Itraconazole therapy in aspergillosis: study in 49 patients. J Am Acad Dermatol. 1990;23:607–614. doi: 10.1016/0190-9622(90)70263-h. [DOI] [PubMed] [Google Scholar]
- 24.Slain D, Rogers PD, Cleary JD, Chapman SW. Intravenous itraconazole. Ann Pharmacother. 2001;35:720–729. doi: 10.1345/aph.10262. [DOI] [PubMed] [Google Scholar]
- 25.Guinet R, Marlier H. Sensitivity of Aspergillus to ketoconazole and itraconazole using a standardized micromethod. Pathol Biol (Paris) 1990;38:572–574. [PubMed] [Google Scholar]
- 26.Martinez J, Torres JM, Arteaga F, Foz-Tena A. Determination of the minimal inhibitory concentration of amphotericin B and miconazole for 21 strains of Aspergillus. Mycopathologia. 1978;64:147–151. doi: 10.1007/BF00576365. [DOI] [PubMed] [Google Scholar]
- 27.Bennett JE. Antimicrobial agents: antifungal agents. In: Gilman AG, Rall TW, Nies AS, Taylor P, editors. Goodman and Gilman's the Pharmacological Basis of Therapeutics. 8. New York: Pergamon Press; 1990. pp. 1165–1181. [Google Scholar]
- 28.British Society for Antimicrobial Chemotherapy Working Party. Chemoprophylaxis for candidosis and aspergillosis in neutropenia and transplantation: a review and recommendations. J Antimicrob Chemother. 1992;32:5–21. doi: 10.1093/jac/32.1.5. [DOI] [PubMed] [Google Scholar]
- 29.Cuenca-Estrella M, Rodriguez-Tudela JL, Mellado E, Martinez-Suarez JV, Monzon A. Comparison of the in vitro activity of voriconazole (UK-109,496), itraconazole and amphotericin B against clinical isolates of Aspergillus fumigatus. J Antimicrob Chemother. 1998;42:531–533. doi: 10.1093/jac/42.4.531. [DOI] [PubMed] [Google Scholar]
- 30.Espinel-Ingroff A. In vitro activity of the new triazole voriconazole (UK-109496) against opportunistic filamentous and dimorphic fungi and common and emerging yeast pathogens. J Clin Microbiol. 1998;36:198–202. doi: 10.1128/jcm.36.1.198-202.1998. [DOI] [PMC free article] [PubMed] [Google Scholar]
- 31.Chandrasekar PH, Manavathu E. Voriconazole: a second-generation triazole. Drugs Today. 2001;37:135–148. doi: 10.1358/dot.2001.37.2.614849. [DOI] [PubMed] [Google Scholar]
- 32.Torre-Cisneros J, Gonzalez-Ruiz A, Hodges MR, Lutsar I. Voriconazole (VORI) for the treatment of S. apiospermum and S. prolificans infection. Program and Abstracts of the 38th Annual Meeting of the Infectious Diseases Society of America; New Orleans, LA. 2000. Abstract 305, September. [Google Scholar]
- 33.Perfect J, Gonzalez-Ruiz A, Lutsar I. Voriconazole (VORI) for the treatment of resistant and rare fungal pathogens. Program and Abstracts of the 38th Annual Meeting of the Infectious Diseases Society of America; New Orleans, LA. 2000. Abstract 303, September. [Google Scholar]
- 34.Stopher DA, Gage R. Determination of a new antifungal agent, voriconazole, by multidimensional high-performance liquid chromatography with direct plasma injection onto a size-exclusion column. J Chromatogr B Biomed Sci Appl. 1997;691:441–448. doi: 10.1016/s0378-4347(96)00408-2. [DOI] [PubMed] [Google Scholar]
- 35.SAS/STAT User's Guide. 4. Cary, NC: SAS Institute Inc.; 1989. Version 6. [Google Scholar]
- 36.Hitchcock CA, Pye GW, Oliver GP, Troke PF. UK-109,496, a novel, wide-spectrum triazole derivative for the treatment of fungal infections: antifungal activity and selectivity in vitro. Program and Abstracts of the 35th Interscience Conference on Antimicrobial Agents and Chemotherapy; San Francisco. 1995. Abstract F72, September. [Google Scholar]
- 37.Sheehan DJ, Hitchcock CA, Sibley CM. Current and emerging azole antifungal agents. Clin Microbiol Rev. 1999;12:40–79. doi: 10.1128/cmr.12.1.40. [DOI] [PMC free article] [PubMed] [Google Scholar]