

Abstract
Aims
Voriconazole is a new triazole antifungal agent with activity against a range of clinically important and emerging pathogens. This study determined the effect of food on the pharmacokinetics of voriconazole in healthy volunteers.
Methods
This was an open, randomized, two-way crossover, multiple-dose study in male volunteers. Twelve subjects received voriconazole 200 mg twice daily for 6.5 days. Each dose was administered either with food or in the fasted state, i.e. not within 2 h of food. Treatment periods were separated by a minimum 7-day washout period. Plasma samples were taken for the estimation of voriconazole plasma concentrations on days 1 and 7. Safety and toleration were assessed by monitoring of both laboratory safety tests and adverse events.
Results
Administering voriconazole with food significantly decreased both day 7 AUCτ and Cmax by approximately 35% (9598–7520 ng·h ml−1; P = 0.003) and 22% (2038–1332 ng ml−1; P = 0.008), respectively. Administering voriconazole with food statistically significantly delayed absorption, evident from tmax values; the mean difference for tmax on day 7 was 1.1 h. The terminal phase rate constant was unchanged by administering voriconazole with food. The fasted terminal phase half-life was 7.3 h compared with 6.6 h for the fed state. Visual inspection of Cmin values suggests that steady state was achieved after 5 days in both dietary states. Voriconazole accumulation, as assessed by ratios of Cmax and AUCτ on days 1 and 7, was statistically significantly greater when administered with food (Cmax, P = 0.010, AUCτ, P = 0.006). Mean Cmax accumulation in the fasted state was 2.1-fold compared with 3.5-fold in the fed state. AUCτ accumulation in the fasted state was 3.1-fold compared with 4.2-fold in the fed state. There were no discontinuations due to adverse events or laboratory abnormalities. Treatment-related mild-to-moderate visual disturbances were experienced by six out of 12 subjects.
Conclusions
The bioavailability of twice-daily 200 mg voriconazole is reduced by approximately 22% as measured by AUCτ after multiple dosing when taken with food, compared with fasting.
Keywords: bioavailability, pharmacokinetics, tolerability, voriconazole
Introduction
Voriconazole is a new triazole antifungal agent, developed as oral and intravenous formulations, with potent activity against a broad spectrum of clinically significant pathogens, including Aspergillus and Candida species [1–3], and emerging fungal pathogens, such as Scedosporium and Fusarium species [4, 5]. The pharmacokinetics of voriconazole have been investigated following single and multiple (10–30 days) doses in both healthy volunteers and patients [6–8].
A number of investigators have studied the influence of concomitant food intake on the oral absorption of azole antifungal agents. Food does not appear to reduce ketoconazole absorption or significantly alter peak serum concentrations, although a food-related delay in achieving peak serum concentrations has been reported [9]. Food has an unpredictable effect on the bioavailability of oral itraconazole [10]. Maximal absorption of itraconazole is dependent on low stomach pH, long gastric retention time and a high fat content of the coadministered meal [11]. On an empty stomach, the bioavailability of itraconazole is reduced to 54–59% relative to that after a full meal [11, 12]. Consequently, itraconazole capsules should be administered shortly after a meal to ensure optimal bioavailability [13]. This may limit the use of this agent in seriously ill patients who are unable to ingest adequate quantities of food, although a cyclodextrin-based oral solution of itraconazole has been reported to have a more favourable pharmacokinetic profile [14, 15]. In contrast, the bioavailability of fluconazole appears to be unaffected by food intake [11, 16, 17].
The purpose of the current study was to evaluate the effect of dietary status on the pharmacokinetic profile of orally administered voriconazole in 12 healthy male volunteers.
Methods
Study subjects
A total of 12 healthy men were screened and enrolled following the provision of written informed consent. All subjects were to be aged 18–45 years, weighing 60–90 kg and within the permitted range for their height and frame [18]. Subjects were to have supine and standing blood pressures within the range 90/60–150/90 mmHg, and supine and standing pulse rates within the range 40–90 beats min−1.
Volunteers were to be excluded if evidence of clinically significant disease, a clinically significant laboratory test abnormality (excepting bilirubin, alkaline phosphatase and urea, which were to be within 10% of the normal range), a history of asthma, eczema or any other allergic condition, were observed at screening. In addition, volunteers were excluded if they had any condition likely to influence drug absorption, hypersensitivity to any drug, or a history of fits, fainting or unexplained loss of consciousness.
Study design
This was an open, randomized, two-way crossover study, which compared the pharmacokinetics of multiple 200-mg doses of voriconazole, administered for 6.5 days, in capsule formulation to fed and fasted healthy male subjects in two study periods. Dietary status was to be separated by a 7-day minimum washout phase. The study was conducted according to Good Clinical Practice regulations and the protocol was reviewed and approved by the ethics committee at the study site (Clinical Research Ethics Committee, Anatole France Street, Brussels, Belgium).
Subjects were admitted to the study unit on the evening prior to dosing having not consumed any alcohol, methylxanthine- or caffeine-containing food, nor undertaken any strenuous exercise during the 48 h prior to dosing. All subjects were fasted from 22.30 hours.
On the morning of day 1, prior to dosing, blood and urine samples were taken for laboratory testing. The first single oral dose of voriconazole 200 mg was administered to both fed and fasted subjects between 07.30 and 07.52 hours.
Subjects who received the drug in the fed state consumed a high-fat breakfast (approximate fat content 45 g, providing 55% of the meal's energy) and subsequently received voriconazole within 30 min of the start of breakfast. Fasted subjects received a low-fat breakfast (approximate fat content 9 g, providing 40% of the meal's energy) 2 h after dosing. All subjects received a standard lunch at 13.00 hours.
Fasted and fed subjects received a standard evening meal (approximate fat content 50–70 g, providing 45–55% of the meal's energy) at 18.00 and at 19.10 hours, respectively. All subjects received the second dose of voriconazole at 20.00 hours and were provided with a light snack at 22.00 hours. After each dose, subjects were instructed not to lie flat for 1 h. Twice-daily administration of voriconazole was continued until the end of day 6, and the last dose was administered on the morning of day 7. Prior to leaving the unit on the morning of day 9, each subject received a physical examination and laboratory safety tests were performed.
Subjects returned to the unit for a second study period not less than 7 days after the initial dosing day. This second study period was run in exactly the same manner as the first, with the exception that subjects randomized to the fed state in study period 1 were in the fasted state for study period 2, and vice versa.
Pharmacokinetic sampling
Venous blood samples were collected by repeated venepuncture or via an indwelling cannula, and transferred into lithium heparin-containing polypropylene tubes. Blood samples were taken for the evaluation of voriconazole pharmacokinetics before the morning dose and at frequent intervals up to 12 h after the morning dose on days 1–7. Pre-morning dose samples were collected on days 2–7. On day 7 additional samples were taken at frequent intervals up to 12 h and at 18, 24, 36 and 48 h after the last dose.
Blood samples were centrifuged at 1500 g for 15 min at 4 °C within 30 min of collection. Prior to analysis, the plasma samples were stored in screw capped polypropylene tubes at −20 °C.
Voriconazole assay
Voriconazole was isolated from plasma proteins by size-exclusion using a Sephadex column. Plasma samples were assayed using a previously validated high-performance liquid chromatography assay with UV detection at 255 nm [19]. The lower limit of quantification was 10 ng ml−1 (imprecision of 0.6% at this limit) and the interbatch imprecision of the method was 5–8% over the calibration range 25–2500 ng ml−1. The accuracy of the assay as determined from plasma samples spiked with voriconazole was 102.8 ± 7.8% (n = 121).
Calibration standards and quality controls were prepared in control human plasma prior to the study and stored at −20 °C until taken for analysis.
Safety assessments
All adverse events that occurred during treatment or up to 7 days after treatment were recorded and documented according to their severity, time of onset and duration, and the investigator's assessment of their relationship to treatment. Events involving adverse drug reactions, illnesses with onset during the study, or exacerbations of pre-existing conditions were recorded. Investigators were also requested to report immediately any serious adverse events occurring during the study or in the period after treatment, regardless of treatment group or suspected relationship to drug.
Routine clinical laboratory tests, haematology, clinical chemistry and urinalysis were performed on samples taken at screening and at the following time points: day 1 (predose) and day 2, predischarge on day 9, and at the follow-up visit.
A physical examination was performed at the prestudy screen, on the evening of admission, at the start of each study period, at the end of each dosing period (day 9), and at the follow-up examination.
Measurements of vital signs (supine and standing systolic and diastolic blood pressure and pulse rate) and a 12-lead electrocardiogram (ECG) were performed at the prestudy screening and at the follow-up visit.
Pharmacokinetic parameters
The maximum observed plasma concentration (Cmax) and the time to the first occurrence of Cmax (tmax) were obtained directly from the plasma concentration–time curves (days 1 and 7). The area under the plasma concentration–time curve within a dosing interval (AUCτ; days 1 and 7) and from time 0 to Ct, where Ct is the concentration at the last sample time above the limit of quantification (AUCt; day 7), were calculated by the linear trapezoidal rule. Where possible, the area under the plasma concentration–time extrapolated to infinity (AUCinf) was calculated from AUCt + Ct/kel (day 7), where kel is the terminal elimination phase rate constant. kel was estimated by linear regression of the log concentration vs. time profile (day 7). Only those points judged to derive the terminal log–linear decline were used in the regression. The terminal elimination phase half-life (t1/2) was calculated as 0.693/kel (day 7). Accumulation ratios were calculated as Cmax(day 7)/Cmax(day 1) and AUCτ (day 7)/AUCτ (day 1).
Statistical analysis
Natural log transformed AUCτ, AUCt, Cmax, and accumulation ratios, and untransformed tmax and kel from days 1 and 7 were subjected to an analysis of variance (anova) model containing sequence, subject within sequence, period and treatment (fed or fasted) effects.
Sequence was tested against subject within sequence at the 10% level. Treatment effects were tested at the 5% level. Adjusted means were produced for all variables analysed. For transformed variables (Cmax and AUCτ), adjusted means on the log scale were back-transformed to provide geometric means on the original scale of measurement. Treatment contrasts (differences for the untransformed variables and ratios for transformed variables) were estimated and 90% confidence intervals (CI) calculated using fasted values as reference. The ratios (%) between the back-transformed means, and the 90% CI for the ratios, were calculated using fasted values as reference. Subjects were included in the statistical analysis if the data were available for both periods. All analyses and tabulations were performed using SAS/STAT® (SAS Institute Inc., North Carolina, USA) software [20].
Results
Subjects
Twelve male subjects, with an age and body weight range of 20–36 years and 60–82 kg, respectively, were randomized to treatment with voriconazole (Table 1). All 12 subjects completed treatment, and underwent pharmacokinetic and safety evaluations in both the fed and fasted state.
Table 1.
Baseline demographic characteristics of all randomized subjects.
| Fasted/fed | Fed/fasted | |
|---|---|---|
| Number of subjects | 6 | 6 |
| Mean age, years (range) | 29 (23–36) | 23 (20–26) |
| Mean weight, kg (range) | 74 (67–82) | 68 (60–77) |
| Mean height, cm (range) | 179 (173–184) | 179 (172–184) |
Pharmacokinetics
Statistical analyses of the pharmacokinetic data indicated that, compared with fasting, food lowered the bioavailability and delayed absorption after single and multiple administration of voriconazole 200-mg capsules. The sequence effect was not statistically significant for any variable, kel (and hence AUC and t1/2) was determined for seven subjects in the fed state and nine subjects in the fasted state, with seven subjects having data for both treatments.
Single dose
Following the first dose of voriconazole (day 1), the geometric means calculated for Cmax and AUCτ after food were 39.5% and 56.9% of those seen after fasting, respectively (Figure 1, Table 2). The two treatments were statistically significantly different. The arithmetic mean observed for tmax following the first dose of voriconazole administered after food was significantly longer (P < 0.001) than that observed after fasting with a mean difference of 1.2 h (90% CI 0.8, 1.6).
Figure 1.
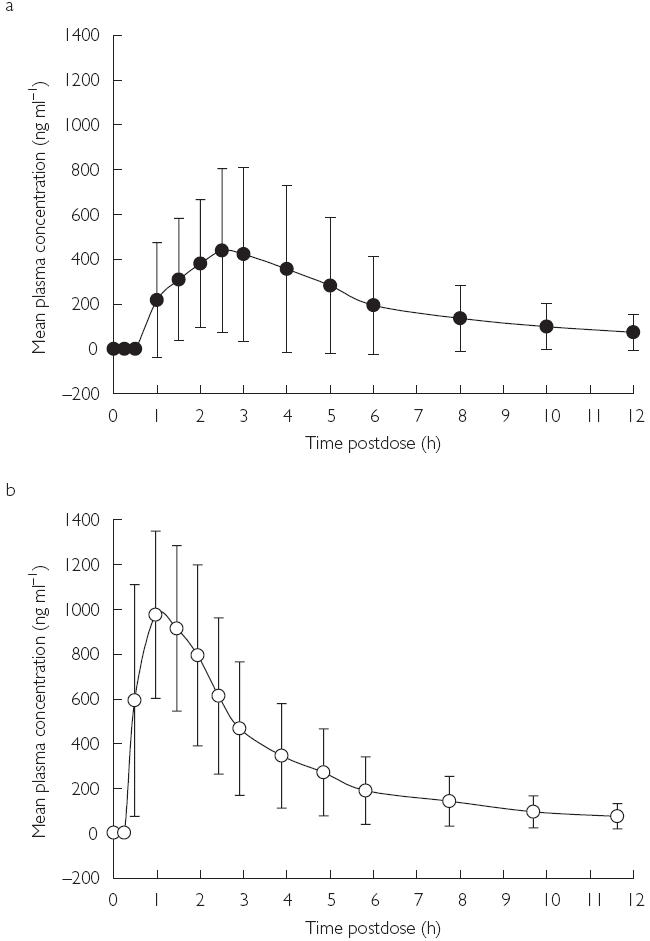
Mean plasma concentration–time profiles of voriconazole ± s.d. at day 1 (single dose); (a) fed, (b) fasted.
Table 2.
Summary of mean pharmacokinetic parameters for voriconazole in plasma.
| Voriconazole 200 mg | Difference/ratio between means*(90% CI) | |||
|---|---|---|---|---|
| Parameter | n | Fasted | Fed | |
| Day 1 | ||||
| Cmax (ng ml−1)† | 12 | 956 ± 382 | 377 ± 388 | 39.5% |
| (534–1830) | (83–1331) | (28.3, 55.1) | ||
| AUCτ (ng·h ml−1)† | 12 | 3141 ± 2075 | 1787 ± 2257 | 56.9% |
| (1807–8178) | (539–7159) | (46.1, 70.1) | ||
| tmax (h)‡ | 12 | 1.0 ± 0.3 | 2.3 ± 0.9 | 1.2 |
| (0.5–1.5) | (1.5–4.0) | (0.8, 1.6) | ||
| Day 7 | ||||
| Cmax (ng·ml−1)† | 12 | 2038 ± 1158 | 1332 ± 1105 | 65.4% |
| (1101–4489) | (432–3902) | (51.8, 82.4) | ||
| AUCτ (ng·h ml−1)† | 12 | 9598 ± 12107 | 7520 ± 11429 | 78.3% |
| (4170–38545) | (2205–35350) | (70.0, 87.7) | ||
| AUCt (ng·h ml−1)† | 12 | 12511 ± 23091 | 10284 ± 21372 | 82.2% |
| (4838–69160) | (2703–63880) | (74.4, 90.9) | ||
| AUC (ng·h ml−1)† | 7 | 19258 ± 27716 | 13065 ± 23945 | 83.4% |
| (5077–70576) | (2901–64681) | (69.4, 100.2) | ||
| tmax (h)‡ | 12 | 1.5 ± 0.6 | 2.6 ± 0.9 | 1.1 |
| (1.0–2.5) | (1.5–4.0) | (0.5, 1.7) | ||
| kel (h−1)‡ | 7 | 0.0947 ± 0.0095 | 0.1086 ± 0.0245 | 0.0098 |
| (0.0850–0.1095) | (0.0771–0.1555) | (− 0.0059, 0.0255) | ||
| t1/2 (h)§ | 7 | 7.3 | 6.4 | – |
| (6.3–8.2) | (4.5–9.0) | |||
| Accumulation ratios | ||||
| Cmax (ng ml−1)† | 12 | 2.1 ± 0.9 | 3.5 ± 2.1 | 165.6% |
| (1.1–4.0) | (1.7–8.0) | (123.9, 221.4) | ||
| AUCτ (ng·h ml−1)† | 12 | 3.1 ± 1.8 | 4.2 ± 2.1 | 137.7% |
| (1.6–8.2) | (2.5–9.5) | (116.7, 162.6) | ||
Ratio (%) between means shown for Cmax, AUC, AUCt, and AUCτ, difference between means for tmax and kel.
Geometric mean ± s.d. (range).
Arithmetic mean ± s.d. (range).
Harmonic mean ± s.d. (range). s.d., standard deviation.
Steady state
Analysis of the day 7 (steady-state) results indicated a similar trend in these pharmacokinetic parameters. The geometric means calculated for Cmax and AUCτ after food were 65.4% (P = 0.008) and 78.3% (P = 0.003) of those seen after fasting, respectively (Figure 2, Table 2). The corresponding ratio for AUCt was 82.2% (P = 0.005). tmax at steady state was on average 1.1 h longer (P = 0.008) in the fed than fasted state. The individual subject concentration–time profiles on day 7 are shown in Figure 3. Visual inspection of Cmin data indicates that the majority of subjects had reached steady state in 5 days. In addition, there appeared to be no difference in time to steady state between patients in the fed and fasted groups (Figure 4).
Figure 2.
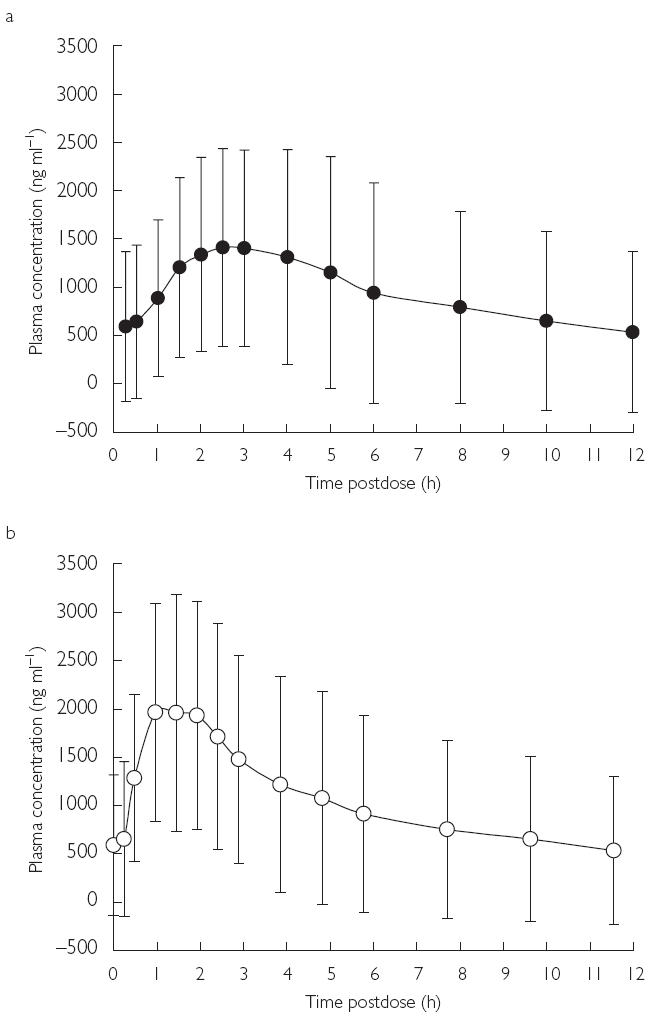
Mean plasma concentration–time profiles of voriconazole ± s.d. at day 7 (multiple dose); (a) fed, (b) fasted.
Figure 3.

Individual subject plasma concentration–time profiles of voriconazole at day 7 (multiple dose); (a) fed, (b) fasted.
Figure 4.

Mean Cmin values of voriconazole at days 2–7.
There was no difference in the rate of elimination of voriconazole between dietary states: the means for kel after fasting and food were not statistically significantly different (P = 0.26).
Accumulation ratios
The accumulation ratios for oral voriconazole capsules were both significantly greater when the drug was administered to fed subjects than when it was administered to fasted subjects, irrespective of whether it was calculated using Cmax (166%; P = 0.010) or AUCτ (138%; P = 0.006) (Table 2).
Safety
There were no discontinuations from treatment due to adverse events or clinical laboratory test abnormalities.
A total of six subjects reported treatment-related adverse events. Of these, five subjects reported an adverse event during the fasted state, as did two of the same subjects and an additional subject during the fed state (Table 3). All these subjects reported mild-to-moderate visual disturbances (blurred vision, increased perception of light), which resolved spontaneously.
Table 3.
Numbers of subjects reporting adverse events.
| Fasted (n = 12) | Fed (n = 12) | |
|---|---|---|
| All causalities | ||
| Adverse events | 9 (0)* | 7 (0)* |
| Laboratory test abnormalities | 5 | 6 |
| Treatment-related | ||
| Adverse events | 5 | 3 |
Values in parentheses indicate number of severe adverse events.
Five subjects in the fasted state and six subjects in the fed state had clinically significant laboratory test abnormalities after receiving voriconazole. Elevated serum potassium was the most commonly reported abnormality (three fed subjects, two fasted subjects). A single subject reported transiently elevated alanine transaminase (SGPT), gamma glutamyl transpeptidase (γ-GT) and alkaline phosphatase activities during the fasted state that later decreased in the fed state. One subject had moderately increased bilirubin levels during both the fed and fasted states. No clinically relevant changes in vital signs or ECG were recorded.
Discussion
This open, randomized two-way crossover study in 12 healthy male subjects showed that, at steady state, the bioavailability of voriconazole 200 mg twice daily, administered in capsule formulation, was lowered and the absorption delayed when administered with food compared with administration in the fasted state. Following the first dose (day 1) of voriconazole, the geometric means of Cmax and AUCτ in the presence of food were 39.5% and 56.9% of those seen after fasting. The corresponding percentages at steady state (day 7) were 65.4% and 78.3%.
In the fed state, tmax occurred statistically significantly later than in the fasted state with a mean difference of 1.1 (90% CI 0.5, 1.7). Visual inspection of Cmin values suggests that there was no difference in time to steady state between the two dietary states (5 days). There was no difference in the rate of elimination of voriconazole between the dietary states.
Treatment-related mild-to-moderate visual disturbances (blurred vision, enhanced perception of light) were experienced by six out of 12 subjects. These events occurred in three subjects receiving voriconazole in the fasted state only and by one patient in the fed state only. In addition, two subjects experienced visual disturbances in both dietary states. All visual adverse events were of mild severity and short duration and spontaneously resolved. Five subjects had clinically significant elevations in serum potassium concentration: three while receiving voriconazole in the fasted state and two while receiving the drug in the fed state. However, two of these elevations were attributed to sample haemolysis (one in each dietary state).
In summary, the bioavailability of twice-daily voriconazole 200 mg administered in capsule form is reduced by approximately 22% (based on day 7 AUCτ data) when taken with food compared with fasting. Voriconazole was well tolerated; mild-to-moderate visual disturbances were the most clinically significant adverse event. The results of this study suggest that, in order to maximize bioavailability, voriconazole should not be administered immediately following a meal.
References
- 1.Cuenca-Estrella M, Rodriguez-Tudela JL, Mellado E, Martinez-Suarez JV, Monzon A. Comparison of the in vitro activity of voriconazole (UK-109,496), itraconazole and amphotericin B against clinical isolates of Aspergillus fumigatus. J Antimicrob Chemother. 1998;42:531–533. doi: 10.1093/jac/42.4.531. [DOI] [PubMed] [Google Scholar]
- 2.Espinel-Ingroff A. In vitro activity of the new triazole voriconazole (UK-109496) against opportunistic filamentous and dimorphic fungi and common and emerging yeast pathogens. J Clin Microbiol. 1998;36:198–202. doi: 10.1128/jcm.36.1.198-202.1998. [DOI] [PMC free article] [PubMed] [Google Scholar]
- 3.Chandrasekar PH, Manavathu E. Voriconazole: a second-generation triazole. Drugs Today. 2001;37:135–148. doi: 10.1358/dot.2001.37.2.614849. [DOI] [PubMed] [Google Scholar]
- 4.Torre-Cisneros J, Gonzalez-Ruiz A, Hodges MR, Lutsar I. Program and Abstracts of the 38th Annual Meeting of the Infectious Diseases Society of America. New Orleans, LA: 2000. Voriconazole (VORI) for the treatment of S. apiospermum and S. prolificans infection. Abstract 305, September. [Google Scholar]
- 5.Perfect J, Gonzalez-Ruiz A, Lutsar I. Program and Abstracts of the 38th Annual Meeting of the Infectious Diseases Society of America. New Orleans, LA: 2000. Voriconazole (VORI) for the treatment of resistant and rare fungal pathogens. Abstract 303, September. [Google Scholar]
- 6.Sheehan DJ, Hitchcock CA, Sibley CM. Current and emerging azole antifungal agents. Clin Microbiol Rev. 1999;12:40–79. doi: 10.1128/cmr.12.1.40. [DOI] [PMC free article] [PubMed] [Google Scholar]
- 7.Koltin Y, Hitchcock CA. Progress in the search for new triazole antifungal agents. Curr Opin Chem Biol. 1997;1:176–182. doi: 10.1016/s1367-5931(97)80007-5. [DOI] [PubMed] [Google Scholar]
- 8.Patterson BE, Coates PE. Program and Abstracts of the 35th Interscience Conference on Antimicrobial Agents and Chemotherapy. San Francisco: 1995. UK 109,496, a novel, wide-spectrum triazole derivative for the treatment of fungal infections: pharmacokinetics in man. Abstract F78, September. [Google Scholar]
- 9.Daneshmend TK, Warnock DW, Ene MD, et al. Influence of food on the pharmacokinetics of ketoconazole. Antimicrobial Agents Chemother. 1984;25:1–3. doi: 10.1128/aac.25.1.1. [DOI] [PMC free article] [PubMed] [Google Scholar]
- 10.Zimmermann T, Yeates RA, Albrecht M, Laufen H, Wildfeuer A. Influence of concomitant food intake on the gastrointestinal absorption of fluconazole and itraconazole in Japanese subjects. Int J Clin Pharmacol Res. 1994;14:87–93. [PubMed] [Google Scholar]
- 11.Zimmermann T, Yeates RA, Laufen H, Pfaff G, Wildfeuer A. Influence of concomitant food intake on the oral absorption of two triazole antifungal agents, fluconazole and itraconazole. Eur J Clin Pharmacol. 1994;46:147–150. doi: 10.1007/BF00199879. [DOI] [PubMed] [Google Scholar]
- 12.Barone JA, Koh JG, Bierman RH, et al. Food interaction and steady-state pharmacokinetics of itraconazole capsules in healthy male volunteers. Antimicrob Agents Chemother. 1993;37:778–784. doi: 10.1128/aac.37.4.778. [DOI] [PMC free article] [PubMed] [Google Scholar]
- 13.Van Peer A, Woestenborghs R, Heykants J, Gasparini R, Cauwenbergh G. The effects of food and dose on the oral systemic availability of itraconazole in healthy subjects. Eur J Clin Pharmacol. 1989;36:423–426. doi: 10.1007/BF00558308. [DOI] [PubMed] [Google Scholar]
- 14.Van de Velde VJ, Van Peer AP, Heykants JJ, et al. The effect of food on the pharmacokinetics of a new hydroxypropyl-β-cyclodextrin formulation of itraconazole. Pharmacotherapy. 1996;16:424–428. [PubMed] [Google Scholar]
- 15.Barone JA, Moskovitz BL, Guarnieri J, et al. Food interaction and steady-state pharmacokinetics of itraconazole oral solution in healthy volunteers. Pharmacotherapy. 1998;18:295–301. [PubMed] [Google Scholar]
- 16.Yeates RA, Zimmermann T, Laufen H, Albrecht M, Wildfeuer A. Comparative pharmacokinetics of fluconazole and of itraconazole in Japanese and German subjects. Int J Clin Pharmacol Ther. 1995;33:131–135. [PubMed] [Google Scholar]
- 17.Debruyne D. Clinical pharmacokinetics of fluconazole in superficial and systemic mycoses. Clin Pharmacokinet. 1997;33:52–77. doi: 10.2165/00003088-199733010-00005. [DOI] [PubMed] [Google Scholar]
- 18.Height and Weight Standards. New York: Metropolitan Life Insurance Company; 1993. [Google Scholar]
- 19.Stopher DA, Gage R. Determination of a new antifungal agent, voriconazole, by multidimensional high-performance liquid chromatography with direct plasma injection onto a size-exclusion column. J Chromatogr B Biomed Sci Appl. 1997;691:441–448. doi: 10.1016/s0378-4347(96)00408-2. [DOI] [PubMed] [Google Scholar]
- 20.SAS/STAT User's Guide. 4. Cary, NC: SAS Institute Inc; 1989. Version 6. [Google Scholar]