

Abstract
Aims
Status epilepticus is common in children with severe falciparum malaria and is associated with poor outcome. Phenytoin is often used to control status epilepticus, but its water-soluble prodrug, fosphenytoin, may be more useful as it is easier to administer. We studied the pharmacokinetics and clinical effects of phenytoin and fosphenytoin sodium in children with severe falciparum malaria and status epilepticus.
Methods
Children received intravenous (i.v.) phenytoin as a 18 mg kg−1 loading dose infused over 20 min followed by a 2.5 mg kg−1 12 hourly maintenance dose infused over 5 min (n = 11), or i.v. fosphenytoin, administered at a rate of 50 mg min−1 phenytoin sodium equivalents (PE; n = 16), or intramuscular (i.m.) fosphenytoin as a 18 mg kg−1 loading dose followed by 2.5 mg kg−1 12 hourly of PE (n = 11). Concentrations of phenytoin in plasma and cerebrospinal fluid (CSF), frequency of seizures, cardiovascular effects (respiratory rate, blood pressure, trancutaneous oxygen tension and level of consciousness) and middle cerebral artery (MCA) blood flow velocity were monitored.
Results
After all routes of administration, a plasma unbound phenytoin concentration of more than 1 µg ml−1 was rapidly (within 5–20 min) attained. Mean (95% confidence interval) steady state free phenytoin concentrations were 2.1 (1.7, 2.4; i.v. phenytoin, n = 6), 1.5 (0.96, 2.1; i.v. fosphenytoin, n = 11) and 1.4 (0.5, 2.4; i.m. fosphenytoin, n = 6), and were not statistically different for the three routes of administration. Median times (range) to peak plasma phenytoin concentrations following the loading dose were 0.08 (0.08–0.17), 0.37 (0.33–0.67) and 0.38 (0.17–2.0) h for i.v. fosphenytoin, i.v. phenytoin and i.m. fosphenytoin, respectively. CSF: plasma phenytoin concentration ratio ranged from 0.12 to 0.53 (median = 0.28, n = 16). Status epilepticus was controlled in only 36% (4/11) following i.v. phenytoin, 44% (7/16), following i.v. fosphenytoin and 64% (7/11) following i.m. fosphenytoin administration, respectively. Cardiovascular parameters and MCA blood flow were not affected by phenytoin administration.
Conclusions
Phenytoin and fosphenytoin administration at the currently recommended doses achieve plasma unbound phenytoin concentrations within the therapeutic range with few cardiovascular effects. Administration of fosphenytoin i.v. or i.m. offers a practical and convenient alternative to i.v. phenytoin. However, the inadequate control of status epilepticus despite rapid achievement of therapeutic unbound phenytoin concentrations warrants further investigation.
Keywords: fosphenytoin, malaria, pharmacokinetics, phenytoin, status epilepticus
Introduction
Falciparum malaria is a common cause of convulsions in children admitted to hospitals in malaria endemic tropical regions. The convulsions are often focal, prolonged and repetitive and many occur when the child is afebrile [1]. Multiple convulsions, irrespective of the aetiology, are often refractory to treatment [2]. Status epilepticus in children with malaria is associated with increased mortality, and neurological and cognitive deficits [1, 3]. Over 60% of children admitted to hospital with cerebral malaria have convulsions on the ward and most of the convulsions are prolonged or repetitive [4, 5]. Seizures also cause perturbations in cerebral haemodynamics in severe malaria [6]. Termination and prevention of convulsions may improve the outcome of children with falciparum malaria.
Phenytoin is a drug of choice in the management status epilepticus [2] but it has two main disadvantages. First, it cannot be administered intramuscularly (i.m.) due to precipitation at the site of injection, thus delaying absorption and also causing tissue necrosis [7]. For treatment of status epilepticus, it has to be administered by slow intravenous (i.v.) infusion. This is not always possible at most peripheral health facilities in malaria endemic areas. Secondly, rapid i.v. administration is associated with the development of cardiovascular side-effects such as hypotension [8], which require the patient to be monitored closely. Fosphenytoin, a water-soluble ester prodrug of phenytoin overcomes these disadvantages since it can be administered both i.v. as a bolus and i.m. Fosphenytoin causes little pain or irritation at the injection site [9] and may offer both practical and clinical advantages over i.v. phenytoin at peripheral health facilities in resource-poor countries. Although the pharmacokinetics and safety of fosphenytoin have been evaluated in Caucasian children [10], no such studies have been conducted in African children or patients with severe malaria.
We evaluated i.v. phenytoin sodium and i.v. and i.m. fosphenytoin sodium in children with severe falciparum malaria and status epilepticus to assess: (a) whether the dosage regimen currently used produces total and free plasma phenytoin concentrations within the reported therapeutic reference range of 10–20 mg l−1 and 1–2 mg l−1, respectively [11]; (b) how rapid and complete is the conversion of fosphenytoin to phenytoin following i.m. and i.v. administration, and (c) the degree of seizure control following administration of the two drugs. We also monitored cardiovascular effects (heart rate, transcutaneous oxygen saturation, blood pressure, and cerebral haemodynamics).
Methods
The study was approved by the Kenya Medical Research Institute (KEMRI) Ethics Committee, and was carried out at the KEMRI/Wellcome Trust high dependency unit at the Kilifi District Hospital on the Kenyan Coast.
Subjects
Children were recruited into the study if: (i) they were aged between 6 months and 13 years; (ii) they had severe malaria characterized by prostration, deep breathing and coma [12], (iii) they had status epilepticus with convulsions lasting for more than 15 min or more than 3 convulsions lasting <5 min within 1 h [13], and (iv) the parent/guardian gave written informed consent. Consent was obtained on admission and children were recruited with intent to treat. Children were excluded if (i) they had a history of epilepsy and (ii) they had received phenytoin prior to admission to hospital or at the data analysis point if phenytoin was detected in the baseline plasma sample. Children were removed from the study if consent was withdrawn.
Study protocol
Children were recruited sequentially as they were admitted to the high dependency unit. A clinical history was taken and physical examination performed on admission. Venous access was obtained by inserting Teflon cannulae ( JelcoTM, Ethicon S.p.A, Italy), one for i.v. administration of fluids and drugs and another in the opposite arm for blood sampling. A blood sample (6 ml) was drawn for quantitative parasite count, blood culture, measurement of glucose, electrolytes, total protein, albumin and differential blood count. A portion of the blood was centrifuged (1500 g, 3 min) and plasma was stored at −20 °C until assayed for baseline concentrations of phenytoin, magnesium and salicylate. Other details of clinical management have been described elsewhere [13]. Since the symptoms of severe falciparum malaria resemble those of bacterial meningitis, and some of the children may have had concomitant bacterial infection [14], all received chloramphenicol (25 mg kg−1 6 hourly) and benzyl penicillin (60 mg kg−1 6 hourly) whilst awaiting the results of blood and CSF culture or before lumbar puncture. The latter is often delayed as children with cerebral malaria may have increased intracranial pressure [15].
Convulsions were treated as described previously [13]. Phenytoin (Faulding Pharmaceuticals plc., UK) was diluted with normal saline to a final concentration of 8 mg ml−1 and a loading dose of 18 mg kg−1 was infused over 20 min. A maintenance dose of 2.5 mg kg−1 infused over 5 min was administered 12 hourly for 48 h. Fosphenytoin sodium (Pro-Epanutin®; Parke-Davis, Eastleigh, UK) was also diluted with normal saline to a final concentration of 12.5 mg ml−1 before i.v. administration at a rate of 50 mg min−1[9] at the same dose expressed as phenytoin equivalents (PE). Fosphenytoin sodium was administered undiluted i.m. as an injection into the anterior aspect of the thigh and the area was rubbed for 30 s. A loading dose of 18 mg kg PE was used followed by a 12 hourly maintenance dose of 2.5 mg kg−1 PE. If there was a recurrence of convulsions within 24 h after stopping phenytoin, the child was treated with i.v. phenobarbitone sodium (Laboratory & Allied Ltd, Nairobi, Kenya; 15 mg kg−1), infused over 20 min followed by a maintenance dose of 5 mg kg−1 daily. Convulsions not terminated with phenytoin and phenobarbitone were treated with thiopentone (Rotexmedica, GmbH, Germany), administered as a 4 mg kg −1 bolus over 30 s, followed by a maintenance dose of 4 mg kg−1 h−1 infused over 2 h under close medical supervision.
Blood and CSF sampling
A blood sample (0.4 ml) for measuring plasma concentrations of phenytoin and fosphenytoin was withdrawn at 5, 10, 15, 20, 25, 30, 40, 60 min, and 2, 4, 6, 8, 12, 24, 36, 48, 54, 60 and 72 h after phenytoin or fosphenytoin administration. The cannula was flushed with 1 ml sterile heparinized (20 IU ml − 1) normal saline after each sample collection. Residual saline in the cannula was removed before each sample was withdrawn. The blood was mixed in lithium heparin tubes and centrifuged (1500 g for 3 min) at room temperature to separate plasma. This was stored in polyvinyl vials at −20 °C until analysis for phenytoin and fosphenytoin.
An additional blood sample (1.5 ml) obtained 0.3 h after phenytoin or 2 h after fosphenytoin loading dose administration was centrifuged (1500 g, 5 min) to obtain plasma for the determination of unbound phenytoin concentrations. Plasma (1 ml) was placed in a Centrifree® micropartition filter unit (Amicon, Inc., Beverly, MA, USA) and centrifuged (1500 g, 15 min) at 4 °C to obtain plasma water. In those patients who had a lumbar puncture performed for diagnostic reasons after administration of phenytoin and fosphenytoin, an aliquot of CSF (100 µl) and a corresponding plasma sample prepared from a blood sample obtained at the same time were stored at −20 °C until analysis for phenytoin.
Clinical measurements
A specifically designed proforma was used to record details of the convulsions (type, duration, lowest oxygen saturation and blood glucose during the seizure) and a 5-min postictal evaluation of the level of consciousness, respiratory rate and transcutaneous oxygen saturation was performed in all children admitted to the unit [16]. In some children, transcranial pulsed Doppler (TCD) sonography was used to measure middle cerebral artery (MCA) blood velocity. The ultrasound measurements were performed using a 2 MHz pulsed transcranial Doppler (Uberling, Germany). The right MCA was insonated with the child lying supine and with the head in the mid line position [17]. The mean peak flow velocities and Gosling's pulsatility index averaged over 10 cardiac cycles were recorded [18] for the first 6 h after drug administration. All children had their heart rate, blood pressure, respiratory rate, transcutaneous oxygen saturation (TCO2) and level of consciousness recorded at every blood sampling time point. The children also had 4 hourly measurements of temperature, pulse, level of consciousness (Blantyre coma score and Adelaide coma score) [19] and pupillary light reaction. Hypotension was defined as a mean blood pressure of less than 50 mmHg, respiratory depression as a respiratory rate of less than 20 breaths min − 1 and a transcutaneous oxygen saturation of less than 96% and bradycardia as a heart rate of less than 80 beats min −1. All patients in this study had electrocardiographic (ECG) monitoring for 6 h from the start of drug administration. The parents/guardians were requested to bring the children for review to document recurrent convulsions and neurological sequelae (hearing loss, speech and behaviour disorders, paraparesis, paraplegia and blindness) 3 months after discharge.
Clinical outcome definitions
Seizures were considered to be abolished if they stopped within 30 min from the start of drug administration. Status epilepticus was considered to be adequately controlled if the patient did not require another anticonvulsant after the termination of the seizures. Status epilepticus characterized by short duration recurrent convulsions was considered to be controlled if there were no convulsions within 12 h following phenytoin or fosphenytoin administration.
Analytical procedures
Plasma fosphenytoin and phenytoin and CSF phenytoin concentrations were determined by HPLC [20, 21]. Briefly, phenytoin, fosphenytoin and the internal standards were extracted from acidified plasma into organic solvent. This was evaporated under white spot nitrogen gas, and the residue reconstituted in mobile phase prior to injection onto a C18 reversed-phase column. Phenytoin quality control (QC) samples corresponding to low (LQC), medium (MQC) and high (HQC) concentrations on the calibration curve were 3.0, 9.0 and 17 µg ml−1, respectively. The intra-assay coefficients of variation (CVs) for the QC samples were 9.9, 6.0 and 6.4% (n = 6 in all cases), respectively, and the interassay CVs were 3.4, 6.8 and 5.3% (n = 5 in all cases), respectively. Intra-assay CVs for fosphenytoin at 1.5 and 18 µg ml−1 were 6.9% (n = 5) and 8.3% (n = 6), respectively. Salicylate and magnesium concentrations were determined on the admission (time zero) plasma sample. Plasma salicylate concentrations were determined using the Abbott TDxFLx® fluorescence polarization immunoassay (Abbott Laboratories, Diagnostics Division, Abbott Park IL, USA). The target (range) concentrations for the LQC, MQC and HQC concentrations were 75 (63.8–86.3), 300 (270–330) and 600 (540–660) mg l−1, respectively. Plasma magnesium concentration was measured by a colourimetric method (Randox MG573, Crumlin, UK). Calibration curves were linear for magnesium concentrations up to 2.67 mmol l−1. Samples with higher concentrations were diluted before assay.
Pharmacokinetic and pharmacodynamic analysis
Area under the plasma phenytoin concentration-time curve (AUC) and fosphenytoin elimination half-life were determined using the pharmacokinetic programme TopFit [22]. Fosphenytoin half-life was determined from plasma fosphenytoin concentration-time data obtained after administration of the loading dose. Maximum plasma phenytoin concentration (Cmax) and the corresponding time (tmax) after the first dose were noted directly from the data. Steady-state was assumed to have been attained following administration of the loading dose and maintenance doses. Therefore, mean steady state phenytoin concentrations (Css) were estimated by dividing the AUC over the dosing interval by the dosing interval (τ) [23]. In the present study, this was calculated as mean of the sum of AUC(0,12 h), AUC(12,24 h), AUC(24,36 h) and AUC(36,48 h) divided by 12 h (τ). Area under the effect-time curve (AUE) for the cardiovascular measurements was determined as described previously [24].
Statistical analysis
The 95% confidence intervals (CI) for the differences between the means of the pharmacokinetic parameters were calculated using the programme CIA [25]. Parameters were also compared by the Mann–Whitney U-test using Stata statistical software (version 6.0). P < 0.05 was taken as statistically significant.
Results
Demographics
Thirty-eight children (median age 29 months [range: 13–156 months]) were recruited into the study (11 (M/F: 7/4) in the i.v. phenytoin, 16 (8/8) in the i.v. fosphenytoin and 11 (6/5) in the i.m. fosphenytoin arm). The admission laboratory parameters were not statistically different between the study arms except the geometric mean parasitaemia, which was higher in the i.v. fosphenytoin group. However, this is unlikely to have affected the estimated pharmacokinetic parameters.
Drug analysis and pharmacokinetics
Figures 1 a and b show total and free plasma phenytoin concentrations following i.v. phenytoin, i.v. fosphenytoin and i.m. fosphenytoin. The pharmacokinetic parameters are summarized in Table 1. Fosphenytoin was rapidly eliminated (median t1/2: 8 min, range 4–16 min) from the body, and unbound phenytoin concentrations within the therapeutic range (1–2 µg ml−1) were achieved within 5–20 min after all the three routes of administration. Mean steady state unbound concentrations were maintained within this range for 48 h. Maximum plasma phenytoin concentrations were achieved most rapidly with i.v. fosphenytoin. There was no statistically significant difference in mean AUC(0,72 h) for total and unbound phenytoin between i.v. phenytoin and i.m. fosphenytoin. However, mean AUC(0,72 h) for phenytoin following i.v. fosphenytoin administration was significantly smaller compared with i.v. phenytoin (Table 1). The CSF : plasma phenytoin concentration ratio ranged from 0.12 to 0.53 (median 0.28, n = 16). Only one child in the i.v. phenytoin group had detectable salicylate concentrations (22.6 mg l−1), and his AUC(0,72 h) for total phenytoin was 738.7 µg ml−1 h, which is considerably lower than the mean and outside the 95% confidence interval for the group. However, the steady state unbound phenytoin concentration of this patient was within the therapeutic range.
Figure 1.
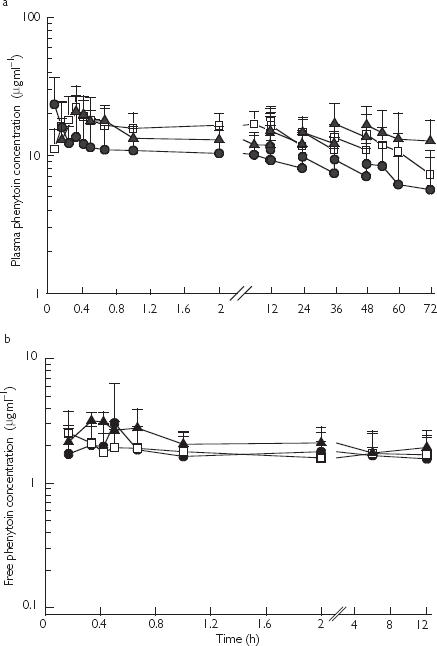
a) Mean (SD) plasma total phenytoin concentrations (µg ml−1) after a 18 mg kg−1 loading dose followed by 2.5 mg kg−1 maintenance dose of i.v. phenytoin sodium (▴, n = 10) or after a 18 mg phenytoin sodium equivalents (PE) kg−1 loading dose followed by 2.5 mg PE kg−1 maintenance dose of i.v. fosphenytoin (□, n = 16) or after i.m. fosphenytoin (•, n = 11). Maintenance doses were given at 12, 24, 36 and 48 h. b) Mean (SD) plasma free phenytoin concentrations (µg ml−1) following i.v. phenytoin sodium (▴, n = 6), i.v. fosphenytoin sodium (□, n = 7) and i.m. fosphenytoin sodium (•, n = 7) determined from plasma total phenytoin concentrations shown in Figure 1a
Table 1.
Pharmacokinetic parameters following i.v. phenytoin, i.v. fosphenytoin and i.m. fosphenytoin administration
| i.v. phenytoin | i.m. fosphenytoin | i.v. fosphenytoin | ||||
|---|---|---|---|---|---|---|
| Drug and route | Total | Free | Total | Free | Total | Free |
| Number of children | 10 | 6 | 11 | 7 | 16 | 7 |
| tmax (h)§† | 0.33 (0.33–0.67) | 0.37 (0.33–0.67) | 0.33 (0.17–1.0) | 0.38 (0.17–2.0) | 0.08 (0.08–0.17) | 0.08 (0.08–0.17) |
| Cmax (µg ml−1)§† | 23.2 (14–31) | 3.2 (2.7–4.2) | 26.7 (11–35) | 2.2 (1.4–4.3) | 22.2 (5–56) | 4.4 (1.7–10.6) |
| Css (µg ml−1) | 13.7 (12.2, 15.3) | 2.1 (1.7, 2.4) | 12.5 (9.3, 15.7) | 1.43 (0.49, 2.4) | 10.4 (7.7, 13) | 1.5 (0.96, 2.1) |
| AUC(0,72 h) (µg ml−1 h) | 1046 (825, 1267) | 164 (116, 213) | 899 (810, 998) | 100 (32, 169) | 641 (486, 996)* | 102 (77, 127)* |
Values are expressed as mean (95% confidence interval) or
median (range).
Significantly different from i.v. phenytoin.
After loading dose.
Mean (95% CI) plasma magnesium concentrations were 0.75 (0.66, 0.85), 0.88 (0.78, 0.99) and 0.71 (0.6, 0.83) mmol l−1 after i.m. fosphenytoin, i.v. fosphenytoin and i.v. phenytoin, respectively, and within the normal plasma range (0.7–1.0 mmol l−1) [26]. There was no significant difference in the plasma magnesium concentrations between those whose convulsions were controlled (mean 0.78, CI 0.70, 0.89 mmol l−1, n = 18) and those not controlled (mean 0.75, CI 0.66, 0.83 mmol l−1, n = 20).
Seizure control
More children in the i.m. fosphenytoin group had their seizures controlled compared with those in the i.v. fosphenytoin and i.v. phenytoin groups. Median time for recurrence of convulsions was also longer in the i.m. fosphenytoin group, although the percentage of children with recurrence of convulsions was also highest in this group (Table 2). Of the children whose convulsions were not controlled with phenytoin or fosphenytoin, 13 had their convulsions controlled with phenobarbitone, 4 with thiopentone, whereas 5 had convulsions that were refractory to all the anticonvulsants used.
Table 2.
Clinical progress and outcome
| i.v. phenytoin | i.v. fosphenytoin | i.m. fosphenytoin | |
|---|---|---|---|
| Number of children | 11 | 16 | 11 |
| Admission Adelaide coma score (ACS)† | 7 (3–10) | 7 (3–12) | 9 (3–12) |
| 4 h ACS† | 6 (3–11) | 8 (5–15) | 8 (5–12) |
| Decline in ACS at 4 h* | 5 | 4 | 6 |
| Episodes of hypoglycaemia* | 6 | 8 | 2 |
| Transfusion* | 2 | 5 | 2 |
| Number of convulsions before admission† | 3 (0–unc) | 1 (0–6) | 3 (0–7) |
| Number of convulsions after admission and before phenytoin† | 3 (1–7) | 4 (0–11) | 3 (0–9) |
| Proportion of prolonged:short convulsion status epilepticus (SE) treated* | 6 : 5 | 6 : 10 | 3 : 8 |
| Time from convulsion onset to phenytoin administration (min)† | 19 (10–30) | 48 (12–60) | 68 (25–110) |
| Clinical outcome | |||
| Recurrence of convulsion‡ | 8 (73%) | 9 (56%) | 9 (82%) |
| Time to convulsion recurrence after phenytoin administration (min)† | 25 (17–1200) | 20 (2–2580) | 96 (2–655) |
| Convulsions after treatment† | 3 (0–28) | 1 (0–39) | 3 (0–4) |
| SE controlled** | 4 (36%) | 7 (44%) | 7 (64%) |
| SE after treatment* | 3 | 0 | 3 |
| Deaths* | 2 | 2 | 1 |
| Neurological sequelae* | 2 | 2 | 2 |
Values are expressed as
median (range)
number or
number (percentage of children) and
number (percentage of convulsions). Unc, uncountable convulsions; controlled convulsions, convulsions terminated or recurrent convulsions prevented with no recurrence requiring treatment within the first 12 h after phenytoin or fosphenytoin loading dose.
Cardiovascular measurements
Mean AUEs for the cardiovascular measurements were not statistically different between the groups. Episodes of hypoxia and hypotension were more common in the i.v. fosphenytoin group, but none was life threatening and all appeared to be due to seizures. Mean peak flow velocity and Gosling's pulsatility index were within reported normal ranges of 65–105 cm s−1 and 0.7–1.2, respectively [17].
Neurological sequelae and deaths
Six children (two in each group) had neurological impairment on discharge home, and five children died (Table 2). All the latter had features of intracranial hypertension and intractable convulsions. Plasma phenytoin concentrations in all these children were within the reported therapeutic range.
Discussion
Administration of phenytoin sodium i.v. or equivalent doses of i.v. or i.m. fosphenytoin sodium rapidly produced plasma total and free phenytoin concentrations within the published therapeutic range and with few side-effects. This is in accord with previous reports [27–30]. However, only 47% of the children had their convulsions controlled.
A bioavailability of 85–99% for phenytoin following i.v. fosphenytoin compared with i.v. phenytoin has been reported [27, 28], but in the present study mean bioavailability was 62% (range 59–79%) for phenytoin after i.v. fosphenytoin administration. The low bioavailability following the latter could have been due to loss of some fosphenytoin in urine. Fosphenytoin is hydrolysed to phenytoin by phosphatases in blood and vascularized tissues [31], and little has been detected in urine in other studies [32]. Severe malaria in children is a complex syndrome [12], which may involve altered tissue perfusion and function. Thus it is possible that these pathophysiological changes associated with severe malaria could have affected the activity of the phosphatases responsible for the hydrolysis of fosphenytoin in some of the children in this study.
The children in this study also received other drugs (quinine, benzylpenicillin, chloramphenicol and other anticonvulsants) concurrently. Some also received salicylate before admission to hospital. The latter displaces phenytoin from plasma protein binding sites [33], and one child in this study who had high salicylate concentration also had a reduced AUC for total plasma phenytoin. This is consistent with increased clearance following displacement from the plasma protein binding site of a highly bound drug with a low hepatic extraction ratio [34]. Some of the children also received phenobarbitone concurrently for treatment of seizures. Phenobarbitone is known to increase both the Km and Vmax of phenytoin [35]. However, there was no difference in the pharmacokinetics of phenytoin in those children who received phenobarbitone concurrently compared with those who did not, probably because the effects of phenobarbitone on Km and Vmax cancel each other out [35, 36]. All the children in the present study also received chloramphenicol, a drug reported to inhibit the metabolism of phenytoin [37]. We have previously reported that concurrent use of these two drugs in children with severe malaria does not result in a clinically significant interaction, apart from a slight increase in the elimination half-life of phenytoin [24].
The CSF: plasma phenytoin concentration ratios determined in the present study were slightly higher than those reported previously in Caucasian children [38, 39]. CSF samples were obtained approximately 3 h after drug administration, and phenytoin was assumed to have achieved distribution equilibrium between CSF and plasma. CSF : plasma phenytoin ratios of 0.15–0.2 have been reported in children [38, 39] and the median ratio of 0.28 found in the present study may suggest that the transfer of phenytoin across the blood–brain barrier may have been enhanced in some children with severe falciparum malaria, since there is evidence of blood–brain barrier dysfunction in this condition 40].
Hypoxia and hypotension were more common in the i.v. fosphenytoin group, but none was serious enough to warrant therapeutic intervention. Acute hypoxia has been reported to have no effect on the activity of hepatic cytochrome P450 enzymes in man [41], and is unlikely to have affected the pharmacokinetics of phenytoin in these children. Cerebral blood flow was also unaffected by phenyton or fosphenytoin administration, in accord with a previous report [42].
Overall, only 47% of the children had their seizures controlled. Poor response to anticonvulsant therapy is thought to occur in patients with diffuse encephalopathy [2], which is a feature of cerebral malaria in children [1]. The poor response may also be related to the duration of seizures prior to the administration the drug. Most children who had recurrent convulsions after the administration of phenytoin or fosphenytoin also had a history of multiple convulsions before admission to hospital. It has been established in other studies that convulsions which last more than 10 min are unlikely to stop spontaneously [43] and may become unresponsive to anticonvulsants [44]. The poor response to phenytoin may also be due to over-expression of the multidrug transporter P-glycoprotein, of which the drug is reported to be a substrate [45]. We have previously discussed a possible contribution of the genetic polymorphism of CYP2C9 activity to clinical response to phenytoin in African children [24]. Low plasma magnesium concentrations have also been associated with poor response to phenytoin [46]. However, the mean plasma magnesium concentrations were within the normal range in all children studied.
In conclusion, we have shown that in children with severe falciparum malaria i.v. and i.m. administration of fosphenytoin produces plasma free phenytoin concentrations within the reported therapeutic range with minimal side-effects. However, the cause of the relatively poor response to phenytoin in children with severe malaria requires further investigation.
Acknowledgments
This publication is made with the permission of the Director of the Kenya Medical Research Institute (KEMRI). We wish to thank Professor Kevin Marsh, Director, Wellcome Trust Research Laboratories, Kenya, and all our clinical, nursing and laboratory colleagues in Kilifi and Nairobi for their support. Special thanks are due to Dr Neil Hounslow of Parke–Davis Pharmaceutical Research (now part of Pfizer Global R & D) for donating fosphenytoin. Professor Gilbert Kokwaro was supported by a Research Capability Strengthening Grant from W.H.O (TDR/MIM grant no. 980074) and a Collaborative Research Initiative Grant from The Wellcome Trust (grant no. 057978/Z/99/Z). Dr Bernhards R. Ogutu was a PhD student in clinical pharmacology supported by TDR/MIM and KEMRI, while Dr Charles R.J.C. Newton is a Wellcome Trust Senior Clinical Research Fellow (grant no. 050533).
References
- 1.Newton CR, Krishna S. Severe falciparum malaria in children: current understanding of pathophysiology and supportive treatment. Pharmacol Ther. 1998;79:1–53. doi: 10.1016/s0163-7258(98)00008-4. [DOI] [PubMed] [Google Scholar]
- 2.Shorvon S. Status epilepticus: Its clinical features and treatment in childhood and adults. Cambridge: Cambridge University Press; 1994. Emergeny treatment of status epilepticus. [Google Scholar]
- 3.Holding PA, Stevenson J, Peshu N, Marsh K. Cognitive sequelae of severe malaria with impaired consciousness. Trans R Soc Trop Med Hyg. 1999;93:529–534. doi: 10.1016/s0035-9203(99)90368-1. [DOI] [PubMed] [Google Scholar]
- 4.Waruiru CM, Newton CR, Forster D, et al. Epileptic seizures and malaria in Kenyan children. Trans R Soc Trop Med Hyg. 1996;90:152–155. doi: 10.1016/s0035-9203(96)90120-0. [DOI] [PubMed] [Google Scholar]
- 5.Crawley J, Smith S, Kirkham F, et al. Seizures and status epilepticus in childhood cerebral malaria. Quart J Med. 1996;89:591–597. doi: 10.1093/qjmed/89.8.591. [DOI] [PubMed] [Google Scholar]
- 6.Newton CR, Marsh K, Peshu N, Kirkham FJ. Perturbations of cerebral hemodynamics in Kenyans with cerebral malaria. Pediatr Neurol. 1996;15:41–49. doi: 10.1016/0887-8994(96)00115-4. [DOI] [PubMed] [Google Scholar]
- 7.Serrano EE, Wilder BJ. Intramuscular administration of diphenylhydantoin. Histologic follow-up studies. Arch Neurol. 1974;31:276–278. doi: 10.1001/archneur.1974.00490400090012. [DOI] [PubMed] [Google Scholar]
- 8.Cranford RE, Leppik IE, Patrick B, Anderson CB, Kostick B. Intravenous phenytoin: clinical and pharmacokinetic aspects. Neurology. 1978;28:874–880. doi: 10.1212/wnl.28.9.874. [DOI] [PubMed] [Google Scholar]
- 9.Jamerson BD, Dukes GE, Brouwer KL, et al. Venous irritation related to intravenous administration of phenytoin versus fosphenytoin. Pharmacotherapy. 1994;14:47–52. doi: 10.1002/j.1875-9114.1994.tb02788.x. [DOI] [PubMed] [Google Scholar]
- 10.Morton LD. Clinical experience with fosphenytoin in children. J Child Neurol. 1998;13(Suppl 1):S19–S22. doi: 10.1177/0883073898013001061. discussion S30–12. [DOI] [PubMed] [Google Scholar]
- 11.Wheless JW. Pediatric use of intravenous and intramuscular phenytoin: lessons learned. J Child Neurol. 1998;13(Suppl 1):S11–S14. doi: 10.1177/0883073898013001041. discussion S30–12. [DOI] [PubMed] [Google Scholar]
- 12.Marsh K, Forster D, Waruiru C, et al. Indicators of life-threatening malaria in African children. N Engl J Med. 1995;332:1399–1404. doi: 10.1056/NEJM199505253322102. [DOI] [PubMed] [Google Scholar]
- 13.Ogutu BR, Newton CR, Crawley J, et al. Pharmacokinetics and anticonvulsant effects of diazepam in children with severe falciparum malaria and convulsions. Br J Clin Pharmacol. 2002;53:49–57. doi: 10.1046/j.0306-5251.2001.01529.x. [DOI] [PMC free article] [PubMed] [Google Scholar]
- 14.Berkley JA, Mwangi I, Mellington F, Mwarumba S, Marsh K. Cerebral malaria versus bacterial meningitis in children with impaired consciousness. Quart J Med. 1999;92:151–157. doi: 10.1093/qjmed/92.3.151. [DOI] [PubMed] [Google Scholar]
- 15.Newton CR, Kirkham FJ, Winstanley PA, et al. Intracranial pressure in African children with cerebral malaria. Lancet. 1991;337:573–576. doi: 10.1016/0140-6736(91)91638-b. [DOI] [PubMed] [Google Scholar]
- 16.Ogutu BR. Department of Pharmaceutics and Pharmacy Practice, University of Nairobi; 2002. Pharmacokinetic and pharmacodynamic study of diazepam, paraldehyde, phenytoin, fosphenytoin and phenobarbitone in Kenyan children with severe malaria PhD Thesis. [Google Scholar]
- 17.Adams RJ, Nicholas FT, Hess DC. Normal values and physiological variables. In: Newell DW, Asalid R, editors. Transcranial Doppler. 1. New York: Raven Press; 1992. pp. 41–48. [Google Scholar]
- 18.Aslid R. Development and Principles of Transcranial Doppler. In: Newell DW, Asalid R, editors. Transcranial Doppler. 1. New York: Raven Press; 1992. pp. 1–8. [Google Scholar]
- 19.Newton CR, Chokwe T, Schellenberg JA, et al. Coma scales for children with severe falciparum malaria. Trans R Soc Trop Med Hyg. 1997;91:161–165. doi: 10.1016/s0035-9203(97)90207-8. [DOI] [PubMed] [Google Scholar]
- 20.Cwik MJ, Liang M, Deyo K, Andrews C, Fischer J. Simultaneous rapid high-performance liquid chromatographic determination of phenytoin and its prodrug, fosphenytoin in human plasma and ultrafiltrate. J Chromatogr B Biomed Sci Appl. 1997;693:407–414. doi: 10.1016/s0378-4347(97)00057-1. [DOI] [PubMed] [Google Scholar]
- 21.Aynacioglu AS, Brockmoller J, Bauer S, et al. Frequency of cytochrome P450 CYP2C9 variants in a Turkish population and functional relevance for phenytoin. Br J Clin Pharmacol. 1999;48:409–415. doi: 10.1046/j.1365-2125.1999.00012.x. [DOI] [PMC free article] [PubMed] [Google Scholar]
- 22.Heinzel G, Woloszczak R, Thomann P. Topfit (Version 20) Pharmacokinetic and Pharmacodynamic Data Analysis System for the PC. Stuttgart: Gustav Fischer; 1993. [Google Scholar]
- 23.Wagner JG. Pharmacokinetics for the Pharmaceutical Scientist. 1. Lancaster: Technomic Publishing Co; 1993. Simple Nonlinear Models; p. 128. [Google Scholar]
- 24.Ogutu BR, Newton CRJC, Muchohi SN, Otieno GO, Kokwaro G. Phenytoin pharmacokinetics and clinical effects in African children following fosphenytoin and chloramphenicol co-administration. Br J Clin Pharmacol. 2002;54:635–642. doi: 10.1046/j.1365-2125.2002.01689.x. [DOI] [PMC free article] [PubMed] [Google Scholar]
- 25.Altman DG, Machin D, Bryant TN, Gardner MJ. Statistics with confidence. 2. Bristol: BMJ Books; 2000. [Google Scholar]
- 26.Child Advocacy International. Normal values for vital clinical signs and laboratory measurements. In: Southall D, Coulter B, Ronald C, Nicholson S, Parke S, editors. 1. London: BMJ Books; 2002. pp. 594–595. International Child Health Care: a practical manual for hospitals worldwide. [Google Scholar]
- 27.Kugler AR, Knapp LE, Eldon MA. Rapid attainment of therapeutic phenytoin concentrations following administration of loading doses of fosphenytoin. A meta-analysis. Neurology. 1996;46:A176. [Google Scholar]
- 28.Eldon MA, Loewen GR, Voightman RR. Pharmacokinetics and tolerance of fosphenytoin and phenytoin administered to healthy subjects. Can J Neurol Sci. 1993;20:S180. [Google Scholar]
- 29.Jamerson BD, Donn KH, Dukes GE, et al. Absolute bioavailability of phenytoin after 3-phosphoryloxymethyl phenytoin disodium (ACC-9653) administration to humans. Epilepsia. 1990;31:592–597. doi: 10.1111/j.1528-1157.1990.tb06111.x. [DOI] [PubMed] [Google Scholar]
- 30.Pryor FM, Gidal B, Ramsay RE, DeToledo J, Morgan RO. Fosphenytoin pharmacokinetics and tolerance of intramuscular loading doses. Epilepsia. 2001;42:245–250. [PubMed] [Google Scholar]
- 31.Quon CY, Stampfi HK. In vitro hydrolysis of ACC-9653 (phosphate ester prodrug of phenytoin) by human, dog, rat blood and tissues [abstract] Pharm Res. 1986;3(Suppl):134S. [Google Scholar]
- 32.Boucher BA. Fosphenytoin. A novel phenytoin prodrug. Pharmacotherapy. 1996;16:777–791. [PubMed] [Google Scholar]
- 33.Odar-Cederlof I, Borga O. Impaired plasma protein binding of phenytoin in uremia and displacement effect of salicylic acid. Clin Pharmacol Ther. 1976;20:36–47. doi: 10.1002/cpt197620136. [DOI] [PubMed] [Google Scholar]
- 34.Rowland M, Tozer TN. Clinical Pharmacokinetics: Concepts and Applications. 2. Philadelphia: Lea & Febiger; 1989. pp. 152–156. [Google Scholar]
- 35.Buchanan RA, Heffelfinger JC, Weiss CF. The effect of phenobarbital on diphenylhydantoin metabolism in children. Pediatrics. 1969;43:114–116. [PubMed] [Google Scholar]
- 36.Garrettson LK, Dayton PG. Disappearance of phenobarbital and diphenylhydantoin from serum of children. Clin Pharmacol Ther. 1970;11:674–679. doi: 10.1002/cpt1970115674. [DOI] [PubMed] [Google Scholar]
- 37.Nation RL, Evans AM, Milne RW. Pharmacokinetic drug interactions with phenytoin (Part II) Clin Pharmacokinet. 1990;18:131–150. doi: 10.2165/00003088-199018020-00004. [DOI] [PubMed] [Google Scholar]
- 38.Koren G, Barzilay Z, Schachar E, et al. Kinetics of CSF phenytoin in children. Can J Neurol Sci. 1983;10:195–197. doi: 10.1017/s0317167100044917. [DOI] [PubMed] [Google Scholar]
- 39.Koren G, Lavi S, Greenwald M, et al. Cerebrospinal fluid pharmacokinetics of tobramycin, ceftazidime, phenobarbitone and phenytoin in a child. Clin Pharmacokinet. 1985;10:371–375. doi: 10.2165/00003088-198510040-00007. [DOI] [PubMed] [Google Scholar]
- 40.Brown H, Hien TT, Day N, et al. Evidence of blood–brain barrier dysfunction in human cerebral malaria. Neuropathol Appl Neurobiol. 1999;25:331–340. doi: 10.1046/j.1365-2990.1999.00188.x. [DOI] [PubMed] [Google Scholar]
- 41.Jurgens G, Christensen HR, Brosen K, et al. Acute hypoxia and cytochrome P450-mediated hepatic drug metabolism in humans. Clin Pharmacol Ther. 2002;71:214–220. doi: 10.1067/mcp.2002.121789. [DOI] [PubMed] [Google Scholar]
- 42.Naidu S, Payne AJ, Moodley J, Hoffmann M, Gouws E. Randomised study assessing the effect of phenytoin and magnesium sulphate on maternal cerebral circulation in eclampsia using transcranial Doppler ultrasound. Br J Obstet Gynaecol. 1996;103:111–116. doi: 10.1111/j.1471-0528.1996.tb09660.x. [DOI] [PubMed] [Google Scholar]
- 43.Treiman DM, Meyers PD, Walton NY, et al. A comparison of four treatments for generalized convulsive status epilepticus. Veterans Affairs Status Epilepticus Cooperative Study Group. N Engl J Med. 1998;339:792–798. doi: 10.1056/NEJM199809173391202. [DOI] [PubMed] [Google Scholar]
- 44.Shinnar S, Berg AT, Moshe SL, Shinnar R. How long do new-onset seizures in children last? Ann Neurol. 2001;49:659–664. [PubMed] [Google Scholar]
- 45.Potschka H, Wolfgang L. In vivo evidence for P-Glycoprotein mediated transport of phenytoin at the blood–brain barrier of rats. Epilepsia. 2001;42:1231–1240. doi: 10.1046/j.1528-1157.2001.01901.x. [DOI] [PubMed] [Google Scholar]
- 46.McLean RM. Magnesium and its therapeutic uses: a review. Am J Med. 1994;96:63–76. doi: 10.1016/0002-9343(94)90117-1. [DOI] [PubMed] [Google Scholar]