

Abstract
Aims
To evaluate potential pharmacokinetic interactions between phenobarbitone and retigabine, a new antiepileptic drug.
Methods
Fifteen healthy men received 200 mg of retigabine on day 1. On days 4–32, phenobarbitone 90 mg was administered at 22.00 h. On days 26–32, increasing doses of retigabine were given to achieve a final dose of 200 mg every 8 h on day 32. The pharmacokinetics of retigabine were determined on days 1 and 32, and those for phenobarbitone on days 25 and 31.
Results
After administration of a single 200 mg dose, retigabine was rapidly absorbed and eliminated with a mean terminal half-life of 6.7 h, a mean AUC of 3936 ng ml−1 h and a mean apparent clearance of 0.76 l h−1 kg−1. Similar exposure to the partially active acetylated metabolite (AWD21-360) of retigabine was observed. After administration of phenobarbitone dosed to steady-state, the pharmacokinetics of retigabine at steady-state were similar (AUC of 4433 ng ml−1 h and t1/2 of 8.5 h) to those of retigabine alone. The AUC of phenobarbitone was 298 mg l−1 h when administered alone and 311 mg ml−1 h after retigabine administration. The geometric mean ratios and 90% confidence intervals of the AUC were 1.11 (0.97, 1.28) for retigabine, 1.01 (0.88, 1.06) for AWD21-360 and 1.04 (0.96, 1.11) for phenobarbitone. Individual and combined treatments were generally well tolerated. One subject was withdrawn from the study on day 10 due to severe abdominal pain. Headache was the most commonly reported adverse event. No clinically relevant changes were observed in the electrocardiograms, vital signs or laboratory measurements.
Conclusions
There was no pharmacokinetic interaction between retigabine and phenobarbitone in healthy subjects. No dosage adjustment is likely to be necessary when retigabine and phenobarbitone are coadministered to patients.
Keywords: antiepileptics, drug interaction, glucuronidation, induction, phenobarbitone, retigabine
Introduction
Epilepsy is among the most common neurological disorders with approximately 50 million sufferers worldwide. Current anticonvulsant drugs provide satisfactory seizure control in approximately 70% of patients, even when used in combination. Treatment options for patients who do not respond to current anticonvulsant drugs remain problematic. Thus the search continues for compounds with a high anticonvulsant potential, a low side-effect rate and a low potential for drug–drug interaction.
Retigabine is a new chemical entity currently in clinical development as an anticonvulsant agent for the treatment of partial onset seizures, the major uncontrolled seizure type in adults with epilepsy. Retigabine combines a novel mode of action, namely potassium channel opening (KCNQ2, KCNQ3 and KCNQ4 channels), with some potentiation of gamma amino butyric acid (GABA)-evoked currents at higher concentrations [1–3]. In vitro studies and animal models of epileptic seizures showed that retigabine was effective at an oral dose as low as 0.01 mg kg−1[4–6]. A clear antiepileptic effect of retigabine was also shown in human cortical slices from patients who underwent surgery for treatment of intractable epilepsy [7]. Studies performed in mice demonstrated that combining retigabine with another anticonvulsant agent leads to an additive effect [8]. Preliminary clinical evaluation predicts that a minimum effective dose would be abount 400 mg day−1 (unpublished data).
Retigabine is metabolized primarily by glucuronidation to form N-glucuronide metabolites and by acetylation to form its mono-acetylated metabolite AWD21-360. Glucuronidation is catalyzed by UGT1A1, 1A4, and 1A9 [9]. Retigabine is not metabolized by cytochrome P450 enzymes [9]. After a single 200 mg dose, retigabine is rapidly absorbed, reaching maximum concentration within 1.8 h [10]. Retigabine is rapidly eliminated by first-order processes with a mean terminal half-life of 7.4 h and an apparent clearance of 0.58 l h−1 kg−1. Retigabine has a moderate volume of distribution (6.2 l kg−1) and low plasma protein binding (about 60%) [10]. AWD21-360, the acetylated metabolite of retigabine, which is rapidly formed and cleared at the same rate as retigabine, also has some pharmacological activity. The pharmacokinetics of retigabine and AWD21-360 are proportional to dose over the range of 100–350 mg given every 12 h and its steady-state pharmacokinetics after twice-daily administration are the same as after a single-dose [10].
Phenobarbitone is a well-established anticonvulsant often prescribed in the treatment of seizure control in epileptic patients at doses between of 1–5 mg kg−1 (60–250 mg). More recently, it has been prescribed in combination with other antiepileptics when the latter, at their optimal dose, do not provide adequate control of generalized or partial seizures. After oral administration about 80% of phenobarbitone is absorbed in the gastrointestinal tract. Approximately 20% to 40% of the drug is excreted unchanged, the remainder being metabolized by hepatic enzymes (cytochromes P450 (CYP) and glucuronyl transferases) to inactive metabolites [11]. In adults the plasma half-life is in the range of 50–140 h [11]. Phenobarbitone is a potent nonspecific inducer of CYP and other hepatic enzymes including glucuronyl transferases and has been shown to alter the pharmacokinetics of several anti-epileptic compounds [12–14].
Since retigabine is likely be administered in combination with phenobarbitone in epileptic patients and as retigabine is metabolized mainly by glucuronidation, which is inducible by phenobarbitone, this study was performed to evaluate the possible pharmacokinetic interaction between retigabine and phenobarbitone.
Methods
Subjects
Fifteen healthy male subjects were eligible for inclusion in the study. All subjects were nonsmokers as confirmed by a urine cotinine concentration lower than 450 ng ml−1 on the day before the study. The study was conducted according to the Declaration of Helsinki and its amendments and received approval from an independent institutional review board (Medeval Independent Ethics Committee). All subjects gave written informed consent before participating in the study.
The mean (± SD) age was 30 ± 7 years (22–45 years), mean weight was 70.9 ± 7.4 kg (62.5–85.0 kg), and mean body mass index was 23.4 ± 2.0 kg m−2 (19.3–27.8 kg m−2). Eleven white, three black and one oriental subject participated in the study. Two subjects were vegetarian.
Procedures
This was an open-label, nonrandomized, inpatient, longitudinal study conducted at a single investigational site (Medeval Limited, Manchester, UK). The pharmacokinetics of a single dose of 200 mg retigabine on day 1 were compared with the steady-state pharmacokinetics of retigabine 200 mg every 8 h after 21 days of concomitant phenobarbitone 90 mg daily. Retigabine was administered over 7 days to achieve steady-state. The purpose of this was to determine whether under these conditions, retigabine affected the steady-state pharmacokinetics of phenobarbitone. The comparison of single dose with multiple dose is valid as retigabine pharmacokinetics are linear over the dose range 100–700 mg and time-independent [10].
Each subject received a single 200 mg dose of retigabine (ASTA Medica AG, Frankfurt, Germany) at approximately 08.00 h on day 1, followed by 90 mg daily evening administration (around 22.00 h) of phenobarbitone (Approved Prescription Services Ltd, UK) on days 4–32. Subject received retigabine on a titrated schedule from days 26–32: 100 mg 8 hourly on days 26–27, 150 mg 8 hourly on days 28–29, 200 mg 8 hourly on days 30–31, and 200 mg on the morning of day 32. Retigabine and phenobarbitone were administered with 150 ml of room-temperature tap water within 30 min of a low- or medium-fat breakfast (morning retigabine), a light snack (afternoon retigabine) or about 3 h after dinner (evening retigabine and phenobarbitone). Similar meals were served on the pharmacokinetic evaluation days.
The single 200 mg dose and multiple 200 mg every 8 h doses of retigabine were selected because they were shown to be well tolerated in healthy male subjects and were deemed to provide adequate drug concentrations for pharmacokinetic assessment even if potent induction of retigabine metabolism by phenobarbitone occurred. For phenobarbitone, the 90 mg dose was within the therapeutic dose range for this compound. This dose has been administered in various published phenobarbitone interaction studies without the occurrence of significant adverse reactions. A 3-week duration of treatment was expected to produce maximal liver enzyme induction and a repeated dose of 90 mg day−1 over 4 weeks was expected to remain tolerable to healthy subjects while posing minimal risk of side-effects [12]. Therefore, this regimen and study design was selected to maximize the potential of the study to detect a retigabine–phenobarbitone interaction.
Subjects reported to the study centre on day −1 and remained there until the morning of day 35. Blood samples for retigabine measurements (7 ml) were collected at 0, 0.33, 0.67, 1, 1.5, 2, 2.5, 3, 4, 6, 8, 12, 16, 24, 36, 48, 60, and 72 h after retigabine intake on day 1 and day 32. Blood samples for phenobarbitone measurements (3 ml) were collected at 0, 0.5, 1, 1.5, 2, 3, 4, 6, 8, 12, 16, and 24 h after phenobarbitone intake on day 24 and day 31. Trough blood samples were taken on days 30–31 for retigabine and on days 22–23 and days 29–30 for phenobarbitone analysis. Blood samples were collected in tubes containing sodium EDTA, inverted gently 4 or 5 times, placed on ice, and centrifuged at 4 °C within 15 min after collection. The separated plasma was transferred to watertight, labelled polypropylene tubes, and stored in an upright position at about −70 °C (retigabine) or −20 °C (phenobarbitone) until shipped for assay.
Concomitant medications were not permitted during the study. Smoking, alcohol, grapefruit and grapefruit-containing products, and caffeine intake were forbidden from 24 h prior to day 1 until the end of the hospitalization.
Safety was assessed from spontaneously reported adverse events, scheduled physical examinations, clinical laboratory determinations, 12-lead ECG assessments, and vital sign measurements.
Analytical methods
A sensitive and specific liquid-chromatography/mass spectrometry (MS)/MS analytical method was used to determine the plasma concentrations of retigabine and AWD21-360 (Cephac, Paris, France) [15]. The assay was linear between 1 and 1000 ng ml−1 for retigabine and between 2.5 and 1000 ng ml−1 for AWD21-360. The interday coefficients of variation for the quality control samples were between 5.4% and 6.4% for retigabine and between 9.5% and 12.9% for AWD21-360. Phenobarbitone did not interfere with retigabine and AWD21-360 measurements.
A standard sensitive and specific high-performance liquid chromatography method with ultraviolet detection was used to determine the plasma concentration of phenobarbitone (Medeval, Manchester, UK). The limit of quantification for this assay was 1 µg ml−1 and the assay was linear up to 50 µg ml−1. The interday coefficients of variation for the quality control samples were between 6.8% and 14.8%. Retigabine and AWD21-360 did not interfere with phenobarbitone measurements.
Pharmacokinetic analysis
The pharmacokinetic analysis of retigabine and its acetylated metabolite (AWD21-360) and phenobarbitone plasma concentrations was performed by noncompartmental methods [16] using the SAS statistical package (Version 6.12, SAS Institute, Inc., Cary NC, USA).
Values for the maximum concentration, Cmax, and the time to reach Cmax (tmax) were obtained directly from the data. After examination of individual concentration-time profiles, at least three data points judged to be in the terminal phase were used to calculate the elimination rate constant (λz) by using log-linear regression. The terminal half-life (t1/2) was estimated from the expression ln2/λz. After the first dose, the area under the concentration-time curve from zero to the last quantifiable concentration (Ct) observed at time t (AUC(0,t)) was determined by the linear trapezoidal rule from zero to tmax and the log linear trapezoidal rule from tmax to t. The total AUC was calculated as AUC(0,t) + Ct/λz. After the last dose on day 32, the total AUC at steady state was estimated from the curve over the 24 h phenobarbitone dosing interval (τ) or 8 h retigabine dosing interval. The CL/F of retigabine and phenobarbitone and the Vz/F of retigabine were obtained from the expressions Dose/AUC and Dose/(λz × AUC), respectively, and further normalized by body weight. The AUC metabolic ratio was obtained from AUCAWD/AUCretigabine × MWretigabine/MWAWD.
Plasma concentrations found to be below the minimum quantifiable concentration of the assay were assigned a value of zero if they occurred before tmax and were otherwise considered as missing values for the pharmacokinetic analysis.
Statistical analysis
Pharmacokinetic parameters were compared between treatment groups using a two-factor analysis of variance (ANOVA). Additionally, a point estimate of the relative exposure (i.e. the ratio of the geometric means or the difference of log-transformed means) and 90% confidence limits were calculated for both Cmax and AUC for phenobarbitone and AUC for retigabine [17]. Analyses compared retigabine pharmacokinetic parameters after a single 200 mg dose alone (day 1) and after multiple doses at steady-state (day 32) given together with phenobarbitone. It is not appropriate to compare Cmax between single dose and multiple dose. Steady-state phenobarbitone pharmacokinetic parameters obtained after administration of 90 mg daily doses alone (days 24–25, 0–24 h) and after multiple doses of retigabine (days 31–32, 0–24 h) were also compared. Based on the sample size of 12 subjects, the statistical power for detecting a 20% difference in AUC values at the 0.05 level was estimated to be approximately 70% for retigabine and AWD21-360 with an intrasubject variability of 17%. The statistical power was estimated to be more than 90% for phenobarbitone AUC with an intrasubject variability less than 10%.
Results
Two subjects withdrew prematurely from the study during the phenobarbitone phase, one for personal reasons on day 7 and one on day 10 for a severe adverse event (abdominal and back pain). Safety and pharmacokinetic analyses were performed on all available data.
Retigabine pharmacokinetics
The mean (± SE) retigabine plasma concentrations for retigabine administered alone and under steady-state concentrations of phenobarbitone are presented in Figure 1. After oral administration of retigabine, concentrations rose with apparent zero-order kinetics and declined with first-order processes. A summary of the pharmacokinetics of retigabine is presented in Table 1. Administration of phenobarbitone had a small effect the pharmacokinetics of retigabine, since the 90% confidence limits for the selected parameters were slightly outside the strict no interaction limit of 80% to 125%. Half-life was prolonged and subjects had greater exposure to retigabine when coadministered with phenobarbitone.
Figure 1.
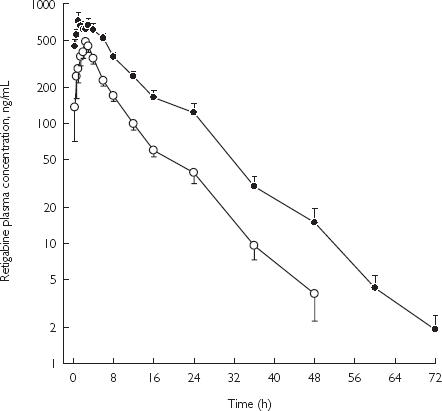
Mean (± SE) concentration-time profiles of retigabine after administration of drug alone or with phenobarbitone in healthy male subjects. Retigabine 200-mg single dose (○); and retigabine 200-mg q8h with 90-mg daily phenobarbital (•).
Table 1.
The pharmacokinetics of retigabine after administration of drug alone or with phenobarbitone.
| Subject group | Cmax(ng ml−1) | tmax (h) | t1/2 (h) | AUC (ng ml−1 h) | CL/F (l h−1 kg−1) | Vz/F (l kg−1) |
|---|---|---|---|---|---|---|
| Alone (n = 15)a | ||||||
| Mean ± SD | 639 ± 192 | 2.0 ± 1.1 | 6.7 ± 1.8 | 3936 ± 976 | 0.76 ± 0.19 | 7.2 ± 1.7 |
| Geometric mean | 611 | 1.6 | 6.5 | 3823 | 0.74 | 7.0 |
| With phenobarbitone (n = 13)a | ||||||
| Mean ± SD | 931 ± 434 | 1.6 ± 0.9 | 8.5 ± 2.1 | 4433 ± 1455 | 0.70 ± 0.21 | 8.5 ± 2.9 |
| Geometric mean | 852 | 1.5 | 8.3 | 4226 | 0.67 | 8.1 |
| P values for transformed analysis of variance with factor for | ||||||
| Treatment | NAb | 0.43 | 0.02 | 0.20 | 0.20 | 0.32 |
| Geometric mean ratio | NA | – | 123 | 111 | 90 | – |
| 90% confidence limits | NA | – | 107, 141 | 97, 128 | 78, 103 | – |
Alone: retigabine 200 mg single dose; With phenobarbitone: retigabine 200 mg every 8 h.
NA not available. It is not appropriate to compare Cmax between single dose and multiple doses.
Retigabine acetylated metabolite pharmacokinetics
The mean (± SE) plasma concentrations of AWD21-360 when retigabine was administered alone and after chronic phenobarbitone are presented in Figure 2. A summary of the pharmacokinetic parameters for AWD21-360 is presented in Table 2. Administration of phenobarbitone did not alter the pharmacokinetics of AWD21-360, including the AUC metabolite : drug ratio.
Figure 2.
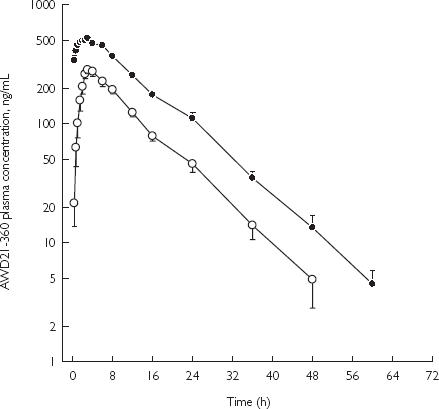
Mean (± SE) concentration-time profiles of AWD21-360 after administration of retigabine alone or with phenobarbitone in healthy male subjects. Retigabine 200-mg single dose (○); and retigabine 200-mg q8h with 90-mg daily phenobarbital (•).
Table 2.
The pharmacokinetics of AWD21-360 after administration of retigabine alone or with phenobarbitone.
| Subject group | Cmax (ng ml−1) | tmax (h) | t½ (h) | AUC (ng ml−1 h) | AUCm : AUC |
|---|---|---|---|---|---|
| Alone (n = 15)a | |||||
| Mean ± SD | 318 ± 71 | 3.5 ± 1.0 | 6.8 ± 1.5 | 3638 ± 802 | 0.99 ± 0.19 |
| Geometric mean | 311 | 3.3 | 6.6 | 3562 | 0.98 |
| With phenobarbitone (n = 13)a | |||||
| Mean ± SD | 586 ± 99 | 2.6 ± 1.8 | 7.7 ± 1.9 | 3622 ± 628 | 0.93 ± 0.33 |
| Geometric mean | 579 | 2.5 | 7.5 | 3572 | 0.89 |
| P values for transformed analysis of variance with factor for | |||||
| Treatment | NAb | 0.14 | 0.05 | 0.90 | 0.52 |
| Geometric mean ratio | NA | – | 110 | 101 | – |
| 90% confidence limits | NA | – | 102, 118 | 88, 116 | – |
Alone: retigabine 200 mg single dose; With phenobarbitone: retigabine 200 mg every 8 h.
NA not available. It is not appropriate to compare Cmax between single dose and multiple doses.
Phenobarbitone pharmacokinetics
No differences were observed between the mean (± SE) plasma concentrations of phenobarbitone administered alone and following chronic dosing with retigabine (Figure 3). A summary of the pharmacokinetics and statistics of phenobarbitone is presented in Table 3.
Figure 3.
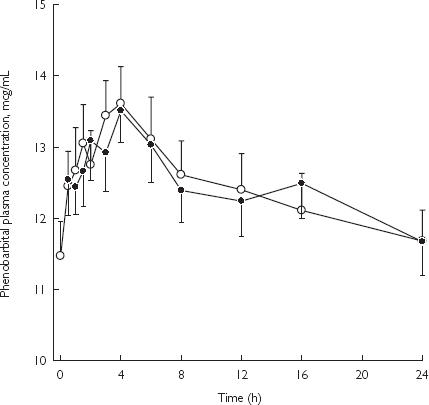
Mean (± SE) concentration-time profiles of phenobarbitone after administration of drug alone or with retigabine in healthy male subjects. Phenobarbital 90-mg daily (○); and phenobarbital 90-mg daily with retigabine 200-mg q8h (•).
Table 3.
The pharmacokinetics of phenobarbitone after administration of drug alone or with retigabine.
| Subject group | Cmax (µg ml−1) | tmax (h) | AUC (µg ml−1 h) | CL/F (ml h−1 kg−1) |
|---|---|---|---|---|
| Alone (n = 13) | ||||
| Mean ± SD | 14.6 ± 1.9 | 3.6 ± 2.4 | 298 ± 38 | 4.35 ± 0.37 |
| Geometric mean | 14.4 | 2.7 | 296 | 4.34 |
| With retigabine (n = 13) | ||||
| Mean ± SD | 15.4 ± 5.0 | 5.7 ± 4.6 | 311 ± 59 | 4.23 ± 0.60 |
| Geometric mean | 14.9 | 4.4 | 307 | 4.18 |
| P values for transformed analysis of variance with factor for | ||||
| Treatment | 0.65 | 0.12 | 0.40 | 0.40 |
| Geometric mean ratio | 103 | – | 104 | 97 |
| 90% confidence limits | 92, 116 | – | 96, 111 | 90, 104 |
Safety
Eight different treatment-emergent adverse events were reported by eight (53%) subjects who took phenobarbitone alone, six by six (46%) subjects who took phenobarbitone with retigabine, and four by four (27%) subjects who took a single dose of retigabine alone. Most treatment-emergent adverse events were of mild or moderate severity except for two severe adverse reactions (abdominal and back pain) which led to the withdrawal of one subject on day 10. No evidence of acute intermittent porphyria was found. It was concluded that this subject had suffered an idiosyncratic reaction to phenobarbitone. Overall, the most frequent treatment-emergent adverse event was headache reported by four (27%) subjects, who took phenobarbitone alone, three (23%) subjects who took phenobarbitone with retigabine, and one (7%) subject who took retigabine alone and abdominal pain reported by two (15%) subjects who took phenobarbitone alone, one (8%) subject who took phenobarbitone with retigabine and one (8%) subject who took retigabine alone. There were no clinically relevant changes in laboratory tests, vital signs, or ECG data throughout the study. Overall, the individual and combined treatments were well tolerated.
Discussion
Knowledge of the potential for drug interactions occurring by enzyme induction, enzyme inhibition or displacement from protein binding between antiepileptic compounds is critical for the optimum treatment of epilepsy. It is also important when evaluating new antiepileptic drugs [11,18–22
Before allowing epileptic patients on phenobarbitone to participate in phase 2 clinical trials with retigabine, the present study was conducted to assess the possible pharmacokinetic interaction between phenobarbitone and retigabine, both given at therapeutic doses.
After administration of multiple 90 mg daily doses of phenobarbitone alone or together with multiple 200 mg 8 hourly doses of retigabine, the pharmacokinetics of the former were similar to those previously reported by Reidenberg et al. [12]. Retigabine did not alter the pharmacokinetics of phenobarbitone.
After administration of a single 200 mg oral dose of retigabine alone or after administration of multiple 200 mg 8 hourly doses of retigabine with phenobarbitone, the pharmacokinetics of retigabine and its acetylated metabolite, AWD21-360, were similar to those reported previously by Ferron et al. [10]. Cmax for retigabine and AWD21-360 increased with time as predicted from the half-life and the dosing interval. Administration of phenobarbitone (90 mg daily) slightly altered the pharmacokinetics of retigabine but, unexpectedly, the direction was towards a longer half-life (23%) and greater exposure (11%) to the drug. The pharmacokinetics of AWD21-360, including the AUC metabolic ratio, were not changed by administration of phenobarbitone. These findings indicate that phenobarbitone does not induce the enzymes responsible for retigabine metabolism (i.e. UGT1A1, 1A4, 1A9 and N-acetylation) but may be a competitive inhibitor of some of these enzymes [9]. The results differed from those of a previous study reporting an approximate 30% increase in retigabine clearance when administered with carbamazepine or phenytoin in epileptic patients [23].
Phenobarbital is a known nonspecific inducer of CYP and other hepatic enzymes including glucuryl transferases. Phenobarbital, like phenytoin and carbamazepine, has been shown to induce, CYP2B6, 2C8/9, 3A4 and 1A2, but does not induce CYP2D6 [19]. Phenobarbital has been reported to accelerate the metabolism of carbamazepine, most probably by further inducing CYP3A4 enzymes [13]. Phenobarbital, as well as phenytoin and carbamazepine, increases the clearance of lamotrigine, another antiepileptic compound extensively metabolized by glucuronidation, by about 30%[19]. However, it has been reported that lamotrigine is metabolized mainly by UGT1A4, which is one of the enzymes responsible for retigabine metabolism. Therefore, as can be seen with enzyme inhibition, enzyme induction is isozyme specific at the cytochrome as well as the glueuronidation or other enzyme level. Hence, a drug-drug interaction seen with carbamazepine may not be the same as the one seen with phenytoin or phenobarbital, depending on how the compound is metabolized. We therefore highlight the importance of studying the potential for drug-drug interactions with each enzyme inducer that could potentially be coadministered. It would also be of value to know the specific induction profile of each inducer to evaluate a priori the potential for drug-drug interactions to occur.
In conclusion, there was no pharmacokinetic interaction between retigabine and phenobarbitone and the combined treatment was well tolerated in healthy subjects. Phenobarbitone does not appear to induce the enzymes responsible for the metabolism of retigabine and its acetylated metabolite. As a result, no dosage adjustment is probably needed when retigabine and phenobarbitone are coadministered to epileptic patients.
Acknowledgments
This study was financed by Wyeth Research, Collegeville, PA, USA and ASTA Medica AG (predecessor of VIATRIS GmbH), Frankfurt am Main, Germany.
References
- 1.Rundfeldt CNR. Investigations into the mechanism of action of the new anticonvulsant retigabine. Arzneimittel Forsch Drug Res. 2000;50:1063–1070. doi: 10.1055/s-0031-1300346. [DOI] [PubMed] [Google Scholar]
- 2.Wickenden AD, Yu W, Zou A, Jegla T, Wagoner PK. Retigabine a novel anti-convulsant, enhances activation of KCNQ2/Q3 potassium channels. Mol Pharmacol. 2000;58:591–600. doi: 10.1124/mol.58.3.591. [DOI] [PubMed] [Google Scholar]
- 3.Tatulian L, Delmas P, Abogadie FC, Brown DA. Activation of expressed KCNQ potassium currents and native neuronal M-type potassium currents by the anti-convulsant drug retigabine. J Neurosci. 2001;21:5535–5545. doi: 10.1523/JNEUROSCI.21-15-05535.2001. [DOI] [PMC free article] [PubMed] [Google Scholar]
- 4.Rostock A, Tober C, Rundfeldt C, et al. D-23129: a new anticonvulsant with a broad spectrum activity in animal models of epileptic seizures. Epilepsy Res. 1996;23:211–223. doi: 10.1016/0920-1211(95)00101-8. [DOI] [PubMed] [Google Scholar]
- 5.Armand V, Rundfeldt C, Heinemann U. Effects of retigabine (D-23129) on different patterns of epileptiform activity induced by low magnesium in rat entorhinal cortex hippocampal slices. Epilepsia. 2000;41:28–33. doi: 10.1111/j.1528-1157.2000.tb01501.x. [DOI] [PubMed] [Google Scholar]
- 6.Dost R, Rundfeldt C. The anticonvulsant retigabine potently suppresses epileptiform discharges in the low Ca++ and low Mg++ model in the hippocampal slice preparation. Epilepsy Res. 2000;38:53–66. doi: 10.1016/s0920-1211(99)00065-0. [DOI] [PubMed] [Google Scholar]
- 7.Straub H, Kohling R, Hohling J, et al. Effects of retigabine on rhythmic synchronous activity of human neocortical slices. Epilepsy Res. 2001;44:155–165. doi: 10.1016/s0920-1211(01)00193-0. [DOI] [PubMed] [Google Scholar]
- 8.De Sarro G, Di Paola ED, Conte G, Pasculli MP, De Sarro A. Influence of retigabine on the anticonvulsant activity of some antiepileptic drugs against audiogenic seizures in DBA/2 mice. Naunyn-Schmiedebergs Arch Pharmacol. 2001;363:330–336. doi: 10.1007/s002100000361. [DOI] [PubMed] [Google Scholar]
- 9.Hempel R, Schupke H, McNeilly PJ, et al. Metabolism of retigabine (D-23129), a novel anticonvulsant. Drug Metab Dispos. 1999;27:613–622. [PubMed] [Google Scholar]
- 10.Ferron GM, Paul J, Fruncillo R, et al. Multiple-dose, linear, dose-proportional pharmacokinetics of retigabine in healthy volunteers. J Clin Pharmacol. 2002;42:175–182. doi: 10.1177/00912700222011210. [DOI] [PubMed] [Google Scholar]
- 11.Levy R, Wilensky A, Anderson G. Carbamazepine, valproic acid, phenobarbital and ethosuximide. In: Evans WE, Schentag JJ, Jusko WJ, editors. Applied Pharmacokinetics: Principles of Therapeutic Drug Monitoring. 3. Vancouver, WA: 1992. Applied Therapeutics. [Google Scholar]
- 12.Reidenberg P, Glue P, Banfield CR, et al. Effects of felbamate on the pharmacokinetics of phenobarbital. Clin Pharmacol Ther. 1995;58:279–287. doi: 10.1016/0009-9236(95)90244-9. [DOI] [PubMed] [Google Scholar]
- 13.Spina E, Pisani F, Perucca E. Clinically significant pharmacokinetic drug interactions with carbamazepine. An update. Clin Pharmacokinet. 1996;31:198–214. doi: 10.2165/00003088-199631030-00004. [DOI] [PubMed] [Google Scholar]
- 14.Gidal BE, Anderson GD, Rutecki PR, Shaw R, Lanning A. Lack of an effect of valproate concentration on lamotrigine pharmacokinetics in developmentally disabled patients with epilepsy. Epilepsy Res. 2000;42:23–31. doi: 10.1016/s0920-1211(00)00160-1. [DOI] [PubMed] [Google Scholar]
- 15.Knebel NG, Grieb S, Leisenheimer S, Locher M. Determination of retigabine and its acetyl metabolite in biological matrices by on-line solid-phase extraction (column switching) liquid chromatography with tandem mass spectrometry. J Chromatogr B Anal Technol Biomed Life Sci. 2000;748:97–111. doi: 10.1016/s0378-4347(00)00272-3. [DOI] [PubMed] [Google Scholar]
- 16.Rowland M, Tozer T. Clinical pharmacokinetics: concepts and applications. 2 . Philadelphia, PA: Lea & Febiger;; 1989. [Google Scholar]
- 17.Schuirmann DJ. A comparison of the two one-sided tests procedure and the power approach for assessing the equivalence of average bioavailability. J Pharmacokinet Biopharm. 1987;15:657–680. doi: 10.1007/BF01068419. [DOI] [PubMed] [Google Scholar]
- 18.French JA, Gidal BE. Antiepileptic drug interactions. Epilepsia. 2000;41:S30–S36. doi: 10.1111/j.1528-1157.2000.tb02944.x. [DOI] [PubMed] [Google Scholar]
- 19.Benedetti MS. Enzyme induction and inhibition by new antiepileptic drugs: a review of human studies. Fundam Clin Pharmacol. 2000;14:301–319. doi: 10.1111/j.1472-8206.2000.tb00411.x. [DOI] [PubMed] [Google Scholar]
- 20.Riva R, Albani F, Contin M, Baruzzi A. Pharmacokinetic interactions between antiepileptic drugs. Clinical considerations. Clin Pharmacokinet. 1996;31:470–493. doi: 10.2165/00003088-199631060-00005. [DOI] [PubMed] [Google Scholar]
- 21.Rambeck B, Specht U, Wolf P. Pharmacokinetic interactions of the new antiepileptic drugs. Clin Pharmacokinet. 1996;31:309–324. doi: 10.2165/00003088-199631040-00006. [DOI] [PubMed] [Google Scholar]
- 22.Cloyd JC, Remmel RP. Antiepileptic drug pharmacokinetics and interactions: impact on treatment of epilepsy. Pharmacotherapy. 2000;20:139S–151S. doi: 10.1592/phco.20.12.139s.35255. [DOI] [PubMed] [Google Scholar]
- 23.Ferron GM, Sachdeo R, Partiot A, Fritz T, Althouse S, Troy S. Pharmacokinetic interaction between valproic acid, topiramate, phenytoin or carbamazepine and retigabine in epileptic patients. Clin Pharmacol Ther. 2001;69:18. [Google Scholar]