Abstract
Aims
We studied the development of acute tolerance to the EEG effect of midazolam and the new benzodiazepine Ro 48-6791.
Methods
Nine young (24–28 years) and nine elderly (67–81 years) male volunteers received midazolam and Ro 48-6791 computer-controlled, targeting linearly increasing plasma concentrations for 30 min (targeted slopes: 40 and 20 ng ml−1 min−1 for midazolam, 3 and 1.5 ng ml−1 min−1 for Ro 48-6791, for young and elderly, respectively) and a constant concentration for the following 15 min. After recovery, the same infusion scheme was repeated. Plasma concentrations of midazolam, Ro 48-6791 and its metabolite Ro 48-6792 were determined from arterial blood samples. The hypnotic effect was assessed using the median frequency of the EEG power spectrum.
Results
The concentration–effect relationship in each infusion cycle could be described by a sigmoid Emax model. The half-maximum concentration EC50 was higher in the second infusion cycle compared with the first one (midazolam, 47% (2.3–91.6%) and 37% (5.3–69.5%); Ro 48-6791, 22% (−2.8% to 44.6%) and 43% (3.4–82.4%) for young and elderly; mean and 95% confidence interval). The complete time course of the EEG median frequency could be described by an interaction between the parent drug in an effect compartment and a hypothetical competitive drug in an additional tolerance compartment. For Ro 48-6791, the use of its metabolite Ro 48-6792 as competitive compound also gave appropriate results.
Conclusion
Midzolam and Ro 48-6791 showed acute tolerance to the EEG effect which might be caused by competitive interaction with the metabolite.
Keywords: benzodiazepines, electroencephalogram, pharmacodynamics, tolerance
Introduction
Benzodiazepines in general and especially midazolam are widely used for anaesthesia and sedation. The development of tolerance to benzodiazepines is a known problem [1–4], particularly in case of long-term sedation in intensive care. In a previous study [5, 6] on the pharmacokinetics and pharmacodynamics of midazolam and the new benzodiazepine Ro 48-6791 in young and elderly volunteers we found some indications that also acute tolerance to the hypnotic effect of these benzodiazepines may occur, even after relatively short exposure of approximately 1–2 h. The objective of the present work was to reanalyse the data of this previous study with respect to development of tolerance and to build a model which describes appropriately the observed EEG effect.
Materials and methods
The study protocol was approved by the local Medical Ethics Review Committee, and the study was conducted in accordance with the Declaration of Helsinki and its amendments.
Subject selection
After giving written informed consent, nine young (24–28 years, weight 66–89 kg) and nine elderly (67–81 years, weight 71–90 kg) male volunteers were enrolled in the study. The young subjects had to be completely healthy as assessed by medical history, physical examination, including ECG, blood pressure, and clinical laboratory tests. For all volunteers, the use of medications with a pronounced effect on the central nervous system within the last 3 months, impaired hearing or epilepsy were exclusion criteria. In the young subjects, no use of any medication within the last 7 days was permitted. In the elderly volunteers, minor stable diseases of a type frequently encountered in people>65 years of age, e.g. mild hypertension or arthritis, were allowed. All subjects were within 60–90 kg body weight and none had documented drug allergies, known alcohol or drug abuse or had participated in clinical studies of non-approved drugs in the 2-month period before admission.
Study design
Drugs were administered in a randomized double-blind crossover design by a microprocessor-controlled infusion device [5, 6]. Two consecutive infusion cycles were administered consisting of an induction and a plateau phase. Induction was realized by linear increase of the predicted plasma concentration with slopes for the young volunteers of 40 ng ml−1 min−1 for midazolam and 3 ng ml−1 min−1 for Ro 48-6791 and a maximum duration of 30 min. For the elderly, the slopes were reduced by 50%. This was performed until the volunteer did not respond any more to a standardized acoustic stimulus of 80 dB and the median EEG frequency was <4 Hz. When these conditions had been reached, the achieved drug concentration was maintained for a further 15 min. Subsequently, the infusion was stopped until the volunteers were fully orientated with respect to person, place and time. After full recovery, the second infusion cycle was performed in the same manner.
Pharmacokinetics
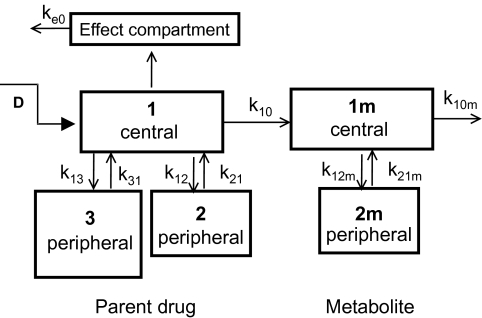
Arterial blood samples of 2.5 ml each were drawn every 3–5 min during induction and plateau phase of each cycle, whereas during the recovery period blood was collected at increasing intervals of 2–60 min up to 6 h after cessation of the second infusion. Plasma concentrations of midazolam, Ro 48-6791 and its metabolite Ro 48-6792 were analysed using gas chromatography with electrochemical detection and liquid chromatography with tandem mass spectrometry [5, 6]. Model-dependent pharmacokinetic parameters were estimated with NONMEM® (GloboMax LLC, Hanover, MD, USA) assuming a linear model with three compartments for the parent drug and two compartments for the metabolite (Figure 1).
Figure 1.
Pharmacokinetic/dynamic model for Ro 48-6791 and its metabolite Ro 48-6792. The pharmacodynamic effect is a sigmoid Emax function of the concentration cE in the effect compartment and the concentration cT of the metabolite in its central compartment.
Pharmacodynamics
To quantify the hypnotic effect, an EEG was recorded continuously. Recording began 10 min before the start of drug administration and was continued until the early second recovery period, when the subjects had regained full orientation. To relate the EEG changes to the plasma concentrations the values of the central lead of the dominant hemisphere (C3) were used [5, 6]. The raw EEG signal of this lead was transferred to a separate PC-based analyser and the median frequency of the power spectrum was calculated. The best-fit plasma concentrations of the pharmacokinetic modelling were related to the corresponding values of the median frequency by means of a sigmoid Emax model:
 |
where cE is the effect site concentration, E0 is the baseline EEG median frequency, Emax is the maximum decrease of the median frequency, EC50 is the half-maximum effect concentration and γ is the Hill coefficient which describes the steepness of the concentration–effect curve. In case of a hysteresis between the onset of the effect and the course of the plasma concentration, an additional effect compartment was included. We analysed each infusion cycle separately as well as the complete time course of the EEG median frequency.
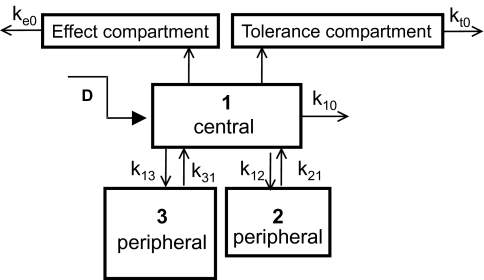
Development of tolerance was assessed using a competitive interaction model [7]:
 |
where cE is the concentration of the parent drug in the effect compartment and cT is the concentration of a hypothetical tolerance drug in an additional compartment (Figure 2). For Ro 48-6791 we also tested the interaction model using the plasma concentration of the metabolite as tolerance drug concentration cT.
Figure 2.
Pharmacokinetic/dynamic model with an interaction between the parent drug and a hypothetical drug in an additional tolerance compartment. The pharmacodynamic effect is a sigmoid Emax function of the concentration cE in the effect compartment and the concentration cT in the hypothetical tolerance compartment.
Goodness of fit
Different models were tested for statistical significance using −2·log likelihood which is supplied by the value of the NONMEM objective function. The accuracy of the pharmacokinetic and pharmacodynamic model was assessed by bias and precision: bias = (measured value −fitted value)/(fitted value), precision = (measured value −fitted value)/(fitted value). The median values of bias [median prediction error (MPE)] and precision [median absolute prediction error (MAPE)] were used as an overall measure.
Statistical analysis
The data were examined for normal distribution using Shapiro-Wilk's W-test. The individually estimated pharmacokinetic/dynamic parameters were tested for statistical differences (P < 0.05) using the t-test for paired samples in case of normally distributed data or the Wilcoxon matched pairs test otherwise. Statistics were performed with STATISTICA® for Windows, release 5.0 (StatSoft Inc., Tulsa, OK, USA). Data are given as mean and standard deviation unless stated else. The 95% confidence interval (CI) was also calculated for selected parameters.
Results
All 18 volunteers completed the study according to the protocol without any serious adverse events. All subjects reached the defined endpoints within 30 min during the period of increasing concentrations. The total doses of midazolam were 71 ± 7 and 36 ± 4 mg for young and elderly, for Ro 48-6791 the total doses were and 26 ± 3 and 15 ± 2 mg for young and elderly, respectively.
Pharmacokinetics
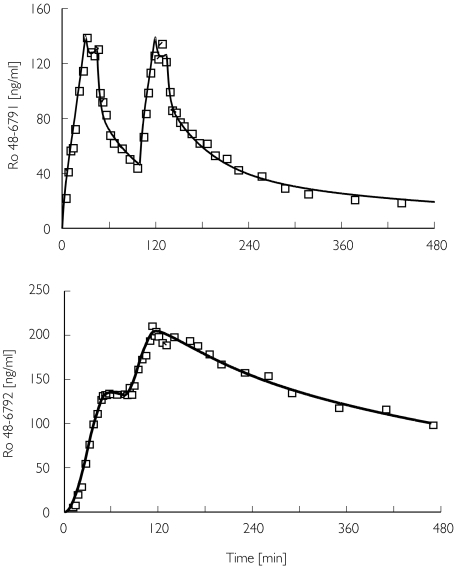
The plasma concentration–time courses could be well described in all subjects using a three-compartment model for the parent drug and a two-compartment model for the metabolite, whereby a lag time had to be included to account for the observation that the metabolite did appear with some delay (Figure 3, Table 1). The metabolite accumulated markedly, and in the second infusion cycle the metabolite concentration exceeded the concentration of the parent drug.
Figure 3.
Arterial plasma concentrations of Ro 48-6791 and its metabolite Ro 48-6792 for a young volunteer. Measured (□), predicted (―)
Table 1.
Estimated pharmacokinetic parameters (mean ± SD) of midazolam, Ro 48-6791 and its metabolite Ro 48-6792.
| Midazolam | Ro 48-6791 | |||
|---|---|---|---|---|
| Young | Elderly | Young | Elderly | |
| Parent drug | ||||
| CL (ml min−1) | 399 ± 91 | 388 ± 97 | 1410 ± 380 | 1180 ± 250 |
| Vc (l) | 7.9 ± 3.0 | 8.5 ± 2.0 | 20.5 ± 7.1 | 19.5 ± 5.8 |
| Vss (l) | 85 ± 22 | 104 ± 11 | 233 ± 80 | 226 ± 56 |
| T1/2α (min) | 2.3 ± 0.9 | 3.0 ± 0.8 | 2.4 ± 1.1 | 2.8 ± 1.0 |
| T1/2β (min) | 31 ± 11 | 31 ± 10 | 34 ± 12 | 30 ± 12 |
| T1/2γ (min) | 223 ± 61 | 288 ± 74 | 225 ± 85 | 222 ± 48 |
| MPE (%) | 0.08 | −0.3 | 0.04 | −0.2 |
| MAPE (%) | 3.4 | 4.5 | 5.7 | 5.9 |
| Metabolite | ||||
| CL (ml min−1) | – | – | 370 ± 297 | 231 ± 51 |
| Vc (l) | – | – | 39 ± 5 | 48 ± 6 |
| Vss (l) | – | – | 83 ± 10 | 90 ± 10 |
| T1/2α (min) | – | – | 20 ± 6 | 19 ± 4 |
| T1/2β (min) | – | – | 252 ± 104 | 305 ± 96 |
| Lag time (min) | – | – | 2.9 ± 1.9 | 5.8 ± 2.0 |
| MPE (%) | – | – | 0.8 | −0.5 |
| MAPE (%) | – | – | 5.1 | 6.3 |
CL, Elimination clearance; Vc, central volume of distribution; Vss, volume of distribution at steady state; T1/2α, fast half-life; T1/2β, intermediate half-life;T1/2γ, terminal half-life; MPE, median prediction error (bias); MAPE, median absolute prediction error.
Pharmacodynamics
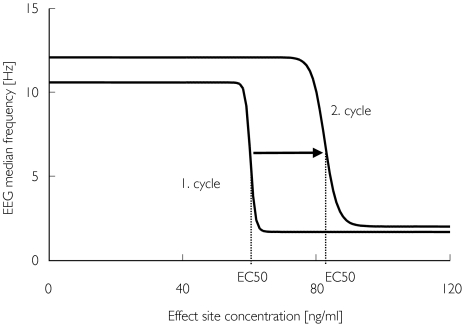
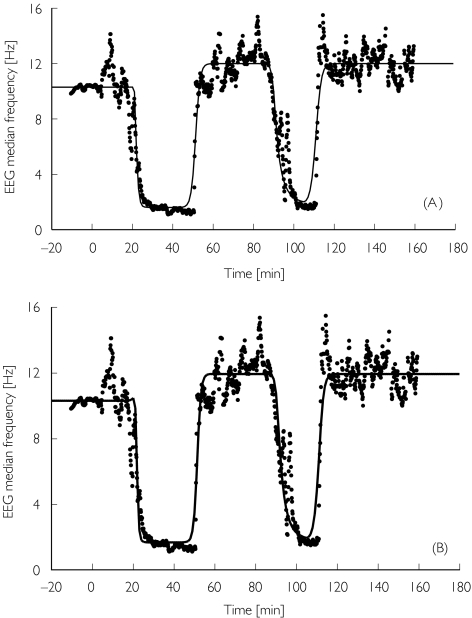
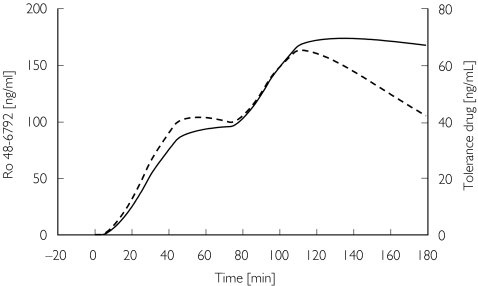
Baseline median EEG frequency (E0) was about 8–10 Hz in all volunteers, with slightly smaller values for the elderly. Some minutes after the start of infusion, an increase of β activity was observed which disappeared a few minutes later. Shortly before the end of the induction phase, the EEG median frequency decreased sharply to values close to 2 Hz. The return to baseline values was steep and occurred about 20 min after the infusion was turned off. In the second cycle the maximum drug effects appeared to be of similar magnitude (Figure 4). Using the results of the kinetic analysis, a sigmoid Emax function could be fitted to the effect data of each infusion cycle (Table 2). The half-maximum concentration EC50 was significantly higher in the second infusion cycle when compared with the first infusion period (Figure 5). For midazolam, the relative differences between the EC50 of the second and the first cycles were 47% (CI 2.3, 91.6) and 37% (CI 5.3, 69.5) for young and elderly, respectively. For Ro 48-6791 the relative differences in EC50 were 22% (CI −2.8, 44.6) and 43% (CI 3.4, 82.4). Therefore, the pharmacodynamic model estimated from the first infusion cycle did not match the time course of the EEG median frequency during the second cycle; the model estimated from the second cycle also failed to fit the data of first cycle (Figure 4A,B). Consequently, it was not possible to model the complete time course of the EEG median frequency with one parameter set (Figure 4C). Assuming an interaction between the parent drug and a hypothetical tolerance drug, the complete time course of the EEG median frequency could be well described (Table 3, Figure 6A), whereby the concentration in the hypothetical tolerance compartment was characterized by a large equilibration constant (T1/2kt0 = 40–60 min) between the central and the tolerance compartment. For Ro 48-6791, the time course of the hypothetical tolerance drug concentration was similar to the measured plasma metabolite concentration (Figure 7), and it was therefore possible to model the EEG effect using the metabolite concentration instead of the hypothetical tolerance drug (Figure 6B, Table 3). The intrinsic effect Tmax of the tolerance drug or the metabolite, respectively, was very weak compared with the effect of the parent drug.
Figure 4.
Time course of the EEG median frequency after Ro 48-6791 for young volunteer no. 8. Measured values are plotted as filled circles. The lines show the predictions obtained from separate analysis of the first infusion cycle (A), from separate analysis of the second infusion cycle (B), and from simultaneous analysis of both cycles (C).
Table 2.
Pharmacodynamic parameters (mean ± SD) of midazolam and Ro 48-6791, estimated for a sigmoid Emax model by separate analysis of the two infusion cycles.
| Midazolam | Ro 48-6791 | |||
|---|---|---|---|---|
| Young | Elderly | Young | Elderly | |
| Cycle I | ||||
| E0 (Hz) | 10.8 ± 1.3 | 9.2 ± 1.6 | 10.7 ± 1.2 | 9.0 ± 1.3 |
| Emax (Hz) | 8.9 ± 2.7 | 6.8 ± 1.2 | 9.4 ± 3.1 | 7.5 ± 2.9 |
| EC50 (ng ml−1) | 531 ± 253 | 201 ± 51 | 85 ± 27 | 37 ± 9 |
| γ | 30 ± 26 | 34 ± 22 | 33 ± 30 | 36 ± 23 |
| Ke0 (min−1) | 0.12 ± 0.10 | 0.08 ± 0.03 | 0.17 ± 0.10 | 0.19 ± 0.19 |
| MPE (%) | 0.4 | −1.1 | −2.0 | −1.6 |
| MAPE (%) | 8.2 | 7.9 | 10.1 | 10.0 |
| Cycle II | ||||
| E0 (Hz) | 11.3 ± 1.6 | 9.0 ± 1.5 | 11.4 ± 2.0 | 9.0 ± 1.2 |
| Emax (Hz) | 9.3 ± 3.1 | 6.3 ± 1.6 | 7.2 ± 2.5 | 7.0 ± 1.1 |
| EC50 (ng ml−1) | 707 ± 237* | 264 ± 55* | 94 ± 27 | 50 ± 10* |
| γ | 20 ± 12 | 37 ± 13 | 37 ± 28 | 40 ± 25 |
| Ke0 (min−1) | 0.20 ± 0.19 | 0.05 ± 0.03 | 0.28 ± 0.28 | 0.12 ± 0.09 |
| MPE (%) | 0.1 | −0.2 | −1.1 | −0.4 |
| MAPE (%) | 11.5 | 9.6 | 8.1 | 6.4 |
E0, Baseline EEG median frequency; Emax, maximum decrease of the EEG median frequency; EC50, half-maximum concentration;
γ, Hill coefficient;
Ke0, elimination rate constant of the effect compartment;
MPE, median prediction error (bias); MAPE, median absolute prediction error.
P < 0.05 second cycle compared with first cycle.
Figure 5.
Concentration–effect curves for Ro 48-6791 in young volunteer no. 8, obtained from separate analysis of the two infusion cycles. In the second infusion period the concentration–effect curve was shifted to higher values.
Table 3.
Pharmacodynamic parameters (mean ± SD) of midazolam and Ro 48-6791, estimated for a sigmoid Emax model with competitive interaction between the parent drug and either a hypothetical tolerance drug (model 1) or the metabolite (model 2)
| Midazolam Model 1 Young | Elderly | Ro 48-6791 Model 1 Young | Elderly | Ro 48-6791 Model 2 Young | Elderly | |
|---|---|---|---|---|---|---|
| E0 (Hz) | 10.8 ± 1.4 | 8.6 ± 1.3 | 10.5 ± 1.5 | 9.0 ± 1.4 | 10.3 ± 1.2 | 9.0 ± 1.4 |
| Emax (Hz) | 9.6 ± 3.0 | 6.6 ± 1.3 | 8.1 ± 1.3 | 7.6 ± 2.7 | 8.2 ± 1.4 | 7.4 ± 2.8 |
| EC50 (ng ml−1) | 460 ± 250 | 110 ± 59 | 74 ± 21 | 28 ± 15 | 68 ± 25 | 23 ± 13 |
| γE | 31 ± 21 | 39 ± 27 | 38 ± 23 | 51 ± 31 | 36 ± 24 | 58 ± 33 |
| Ke0 (min−1) | 0.08 ± 0.05 | 0.04 ± 0.03 | 0.16 ± 0.16 | 0.08 ± 0.03 | 0.12 ± 0.07 | 0.07 ± 0.04 |
| Tmax (Hz) | −1.0 ± 0.6 | −0.1 ± 0.9 | −1.6 ± 0.8 | 0.6 ± 0.5 | −1.8 ± 1.0 | 0.01 ± 0.7 |
| TC50 (ng ml−1) | 264 ± 184 | 68 ± 65 | 45 ± 25 | 14 ± 20 | 64 ± 37 | 25 ± 12 |
| γT | 39 ± 24 | 43 ± 20 | 46 ± 25 | 33 ± 28 | 35 ± 30 | 28 ± 22 |
| Kt0 (min−1) | 0.015 ± 0.014 | 0.010 ± 0.008 | 0.029 ± 0.032 | 0.07 ± 0.12 | – | – |
| MPE (%) | −0.4 | 0.1 | 0.6 | −0.5 | 0.5 | −0.4 |
| MAPE (%) | 7.3 | 6.9 | 9.1 | 7.1 | 8.1 | 6.3 |
E0, Baseline EEG median frequency; Emax, maximum effect of the parent drug; EC50, effect site concentration for half-maximum effect;E,γT, Hill coefficients; Ke0, elimination rate constant of the effect compartment; Tmax, maximum effect of the drug in the tolerance compartment; TC50, concentration of the drug in the tolerance compartment at 50% maximum effect; Kt0, elimination rate constant of the tolerance compartment; MPE, median prediction error (bias); MAPE, median absolute prediction error.
Figure 6.
Time courses of the EEG median frequency for young volunteer no. 8 after Ro 48-6791. Measured values are plotted as filled circles. The lines show the predictions obtained for the tolerance model with interaction between the parent drug and either a hypothetical drug in an additional tolerance compartment (A) or the metabolite (B).
Figure 7.
Concentration courses of the metabolite Ro 48-6792 (—) and of the hypothetical drug as predicted by the tolerance model ( ) (young volunteer no. 8).
Discussion
Greenblatt and Shader [2] discriminated ‘receptor-site tolerance’, where a given effect site concentration has a different effect depending on the duration of administration, from ‘pharmacokinetic’ or ‘metabolic’ tolerance, where drug clearance increases with the time of administration. In the second-mentioned case, the drug concentration and, in consequence, the drug effect decreases despite continued administration. These two types of tolerance are indistinguishable if one measures the effect as a function of dosing [8]. As we also determined the plasma concentrations, we were able to discriminate changes in pharmacokinetics from changes in pharmacodynamics. Whereas there were no differences in pharmacokinetics, separate analysis of the two infusion cycles revealed that the half-maximum concentration EC50 was significantly increased in the second cycle compared with the first one. According to a study of Hudson et al.[9], this shift of the concentration–effect curve (Figure 5) is an indicator for development of acute tolerance. The observed EEG effect could be modelled with a tolerance model, which supposes a hypothetical tolerance compartment that is linked to the central compartment like the effect compartment. The net effect results from the competitive antagonistic interaction of the drug in the effect compartment and that in the tolerance compartment. This type of interaction model, which was proposed by Holford and Sheiner [7], has also been used in studies of tolerance to nicotine [10, 11] and morphine [12]. As the equilibration half-time for the tolerance compartment was much longer than for the effect compartment (T1/2kt0 = 40–60 min compared with T1/2ke0 = 8–15 min), the tolerance compartment fills slowly and the delay of opposing effects from the tolerance compartment permits a rapid onset of the effect. After a prolonged infusion, there is a sufficient drug concentration in the tolerance compartment to antagonize the effect of the parent drug as the hypothetical tolerance drug has only a very weak effect (Tmax≈−1 to 1 Hz compared with Emax≈ 7–9 Hz). After cessation of infusion, the slow decrease of concentration in the tolerance compartment will potentiate the rapid recovery. When comparing the time course of the hypothetical tolerance drug with that of the metabolite Ro 48-6792 (Figure 7), the similarity is obvious, and it was therefore reasonable to build the tolerance model for Ro 48-6791 with the metabolite concentration instead of a hypothetical drug. This model was indeed also able to describe the time course of the median frequency after Ro 48-6791. The intrinsic effect (Tmax) of the metabolite was also very weak compared with the effect of the parent drug. Thus, the metabolite would have no pharmacodynamic effect itself but replaces the parent drug at the receptor site and thereby weakens the effect. The benzodiazepine antagonist flumazenil acts in exactly that manner. However, for the main metabolite of midazolam, α-hydroxymidazolam, Mandema et al.[13] and Tuk et al.[14] found similar potencies and similar maximum effects for the parent drug and its metabolite. In a study of Johnson et al. there was also found a sedative effect of α-hydroxymidazolam [15]. When comparing these results with those of the present study one has, however, to consider that the pharmacodynamics were described with different parameters and that the concentration ranges were quite different. Whereas Johnson used a sedation score, Mandema and Tuk used the amplitudes in the β band (11.5–30 Hz) of the EEG power spectrum, and we used the median frequency of the complete power spectrum (0.5–30 Hz) to characterize the EEG effect. For midazolam concentrations up to 300 ng ml−1 the major effect is an increase of the activity in the β band, which can be seen as a short increase of the median frequency (Figure 6), but for higher concentrations there is a shift of the activity towards lower frequencies which is reflected in a lower median frequency. Moreover, the maximum concentrations studied by Mandema and Johnson were 200 ng ml−1 whereas we reached concentrations of 1000 ng ml−1. As we did not measure the α-hydroxymidazolam concentration and as there are no data about its pharmacodynamics regarding the EEG median frequency, it is unclear whether the observed effect is really an interaction between parent drug and metabolite, or whether it is tolerance in the sense of receptor-site adaptation.
The findings in the literature concerning tolerance are also rather controversial. Whereas some authors observed tolerance to benzodiazepines [1, 3, 4, 16] others did not find indications for development of tolerance using clinical parameters [17] or the EEG [18]. In intensive care, tolerance to midazolam was observed, but after long-term application of several days [19, 20]. Again, the comparison is complicated by the fact that the maximum midazolam concentrations reached in the present study were much higher than in clinical routine and that interactions with concomitant drugs may also alter the effect, particularly in the case of sedation in intensive care.
From the models derived in the present study one would predict that the hypnotic effect of midazolam and Ro 48-6791 could even disappear after prolonged infusion at steady-state concentration. This was indeed observed in a volunteer study with midazolam [21], where one subject woke up 10 min before stopping a continuous computer-controlled infusion (TCI) with a target concentration of 400 ng ml−1 for 60 min. Fiset et al. also observed one case where the midazolam effect was not sustained during continuous infusion for a period of 3 h [18]. Vice versa, one would have to increase the concentration to maintain a defined pharmacodynamic endpoint. However, caution must be exercised when using the tolerance model derived from this study with its specific design to predict the effect for another administration scheme. Gardmark et al. have shown that different tolerance models which described well the original data from which they were derived failed to predict appropriately the effect for a completely different administration [22].
Quite different molecular mechanisms for development of tolerance have been discussed in the literature [23]. Benzodiazepines do not act directly but potentiate the inhibitory effect of the neurotransmitter GABA, whereby the GABAA receptor complex has specific benzodiazepine binding sites. Downregulation in the number of GABAA receptors could be one potential mechanism for development of tolerance [24], but it was also discussed whether the coupling between the GABA and the benzodiazepine sites could be disturbed by prolonged exposure to benzodiazepines, so that the potentiation of the GABA effect is weakened [25]. It was also suggested that benzodiazepines affect the synthesis and degradation of GABAA receptors or that alterations in mRNA synthesis may cause changes in GABAA receptor subunits and thereby make the receptor less sensitive to GABA [23]. As uncoupling occurred rapidly with half-times of a few hours, whereas tolerance was usually observed after longer treatment of several days or weeks, it was doubted that this mechanism is the direct cause of tolerance [23]. However, the acute tolerance observed in the present study would support this theory, provided that it is not interaction.
In conclusion, reanalysis of the previously published data revealed a development of acute tolerance for the benzodiazepines midazolam and Ro 48-6791, as expressed by a shift of the concentration–effect curve to the right. This phenomenon could be modelled by an empirical interaction model with competitive antagonism between the parent drug and a hypothetical tolerance drug or the metabolite. The question whether the observed phenomenon is only the result of an interaction or may also be a receptor site adaptation is to be investigated in further studies.
Acknowledgments
The original study, from which the data were taken for reanalysis, was supported by a grant of F. Hoffmann-La Roche Ltd, Basel, Switzerland, and in part by BMFT 01-EC 9403.
References
- 1.Coldwell SE, Kaufman E, Milgrom P, et al. Acute tolerance and reversal of the motor control effects of midazolam. Pharmacol Biochem Behav. 1998;59:537–45. doi: 10.1016/s0091-3057(97)00458-9. [DOI] [PubMed] [Google Scholar]
- 2.Greenblatt DJ, Shader RI. Dependence, tolerance, and addiction to benzodiazepines: clinical and pharmacokinetic considerations. Drug Metab Rev. 1978;8:13–28. doi: 10.3109/03602537808993775. [DOI] [PubMed] [Google Scholar]
- 3.Kroboth PD, Smith RB, Erb RJ. Tolerance to alprazolam after intravenous bolus and continuous infusion: psychomotor and EEG effects. Clin Pharmacol Ther. 1988;43:270–7. doi: 10.1038/clpt.1988.32. [DOI] [PubMed] [Google Scholar]
- 4.Rosen DA, Rosen KR. Midazolam for sedation in the paediatric intensive care unit. Intensive Care Med. 1991;17:S15–S19. doi: 10.1007/BF01731149. [DOI] [PubMed] [Google Scholar]
- 5.Albrecht S, Ihmsen H, Hering W, et al. The effect of age on the pharmacokinetics and pharmacodynamics of midazolam. Clin Pharmacol Ther. 1999;65:630–9. doi: 10.1016/S0009-9236(99)90084-X. [DOI] [PubMed] [Google Scholar]
- 6.Dingemanse J, Haussler J, Hering W, et al. Pharmacokinetic-pharmacodynamic modelling of the EEG effects of Ro 48-6791, a new short-acting benzodiazepine, in young and elderly subjects. Br J Anaesth. 1997;79:567–74. doi: 10.1093/bja/79.5.567. [DOI] [PubMed] [Google Scholar]
- 7.Holford NH, Sheiner LB. Kinetics of pharmacologic response. Pharmacol Ther. 1982;16:143–66. doi: 10.1016/0163-7258(82)90051-1. [DOI] [PubMed] [Google Scholar]
- 8.Al-Khudhairi D, Askitopoulou H, Whitwam JG. Acute ‘tolerance’ to the central respiratory effects of midazolam in the dog. Br J Anaesth. 1982;54:953–8. doi: 10.1093/bja/54.9.953. [DOI] [PubMed] [Google Scholar]
- 9.Hudson RJ, Stanski DR, Saidman LJ, Meathe E. A model for studying depth of anesthesia and acute tolerance to thiopental. Anesthesiology. 1983;59:301–8. doi: 10.1097/00000542-198310000-00006. [DOI] [PubMed] [Google Scholar]
- 10.Fattinger K, Verotta D, Benowitz NL. Pharmacodynamics of acute tolerance to multiple nicotinic effects in humans. J Pharmacol Exp Ther. 1997;281:1238–46. [PubMed] [Google Scholar]
- 11.Porchet HC, Benowitz NL, Sheiner LB. Pharmacodynamic model of tolerance: application to nicotine. J Pharmacol Exp Ther. 1988;244:231–6. [PubMed] [Google Scholar]
- 12.Ouellet DM, Pollack GM. A pharmacokinetic-pharmacodynamic model of tolerance to morphine analgesia during infusion in rats. J Pharmacokinet Biopharm. 1995;23:531–49. doi: 10.1007/BF02353460. [DOI] [PubMed] [Google Scholar]
- 13.Mandema JW, Tuk B, van Steveninck AL, Breimer DD, Cohen AF, Danhof M. Pharmacokinetic-pharmacodynamic modeling of the central nervous system effects of midazolam and its main metabolite alpha-hydroxymidazolam in healthy volunteers. Clin Pharmacol Ther. 1992;51:715–28. doi: 10.1038/clpt.1992.84. [DOI] [PubMed] [Google Scholar]
- 14.Tuk B, van Oostenbruggen MF, Herben VM, Mandema JW, Danhof M. Characterization of the pharmacodynamic interaction between parent drug and active metabolite in vivo: midazolam and alpha-OH-midazolam. J Pharmacol Exp Ther. 1999;289:1067–74. [PubMed] [Google Scholar]
- 15.Johnson TN, Rostami-Hodjegan A, Goddard JM, Tanner MS, Tucker GT. Contribution of midazolam and its 1-hydroxy metabolite to preoperative sedation in children: a pharmacokinetic-pharmacodynamic analysis. Br J Anaesth. 2002;89:428–37. [PubMed] [Google Scholar]
- 16.Kroboth PD, Bertz RJ, Smith RB. Acute tolerance to triazolam during continuous and step infusions: estimation of the effect offset rate constant. J Pharmacol Exp Ther. 1993;264:1047–55. [PubMed] [Google Scholar]
- 17.Somma J, Donner A, Zomorodi K, et al. Population pharmacodynamics of midazolam administered by target controlled infusion in SICU patients after CABG surgery. Anesthesiology. 1998;89:1430–43. doi: 10.1097/00000542-199812000-00021. [DOI] [PubMed] [Google Scholar]
- 18.Fiset P, Lemmens HL, Egan TE, Shafer SL, Stanski DR. Pharmacodynamic modeling of the electroencephalographic effects of flumazenil in healthy volunteers sedated with midazolam. Clin Pharmacol Ther. 1995;58:567–82. doi: 10.1016/0009-9236(95)90177-9. [DOI] [PubMed] [Google Scholar]
- 19.Shafer A. Complications of sedation with midazolam in the intensive care unit and a comparison with other sedative regimens. Crit Care Med. 1998;26:947–56. doi: 10.1097/00003246-199805000-00034. [DOI] [PubMed] [Google Scholar]
- 20.Shelly MP, Sultan MA, Bodenham A, Park GR. Midazolam infusions in critically ill patients. Eur J Anaesthesiol. 1991;8:21–7. [PubMed] [Google Scholar]
- 21.Schwilden H, Stoeckel H, Lauven PM. Dosisfindung von Midazolam und Wirkkontrolle über EEG. In: Götz E, editor. Midazolam in der Anästhesiologie. Basel: Editions Roche; 1984. pp. 41–7. [Google Scholar]
- 22.Gardmark M, Brynne L, Hammarlund-Udenaes M, Karlsson MO. Interchangeability and predictive performance of empirical tolerance models. Clin Pharmacokinet. 1999;36:145–67. doi: 10.2165/00003088-199936020-00005. [DOI] [PubMed] [Google Scholar]
- 23.Bateson AN. Basic pharmacologic mechanisms involved in benzodiazepine tolerance and withdrawal. Curr Pharm Des. 2002;8:5–21. doi: 10.2174/1381612023396681. [DOI] [PubMed] [Google Scholar]
- 24.Rosenberg HC, Chiu TH. Tolerance during chronic benzodiazepine treatment associated with decreased receptor binding. Eur J Pharmacol. 1981;70:453–60. doi: 10.1016/0014-2999(81)90356-3. [DOI] [PubMed] [Google Scholar]
- 25.Tietz EI, Chiu TH, Rosenberg HC. Regional GABA/benzodiazepine receptor/chloride channel coupling after acute and chronic benzodiazepine treatment. Eur J Pharmacol. 1989;167:57–65. doi: 10.1016/0014-2999(89)90747-4. [DOI] [PubMed] [Google Scholar]


