

Abstract
Aims
To identify the cytochrome P450 (CYP) enzyme(s) that catalyze the metabolism of tizanidine in vitro.
Methods
The effect of CYP isoform inhibitors on the elimination of tizanidine was studied using pooled human liver microsomes. The metabolism of the drug by a range of human recombinant CYP isoforms was then investigated.
Results
Incubation of tizanidine (80 nm) with human liver microsomes resulted in time- and NADPH-dependent substrate consumption with a half-life of 50 min, initial reaction velocity of 1.1 pmol min−1 mg−1 protein and intrinsic clearance of 17 ml min−1 kg−1. The predicted in vivo hepatic clearance (CLh) of tizanidine using the well-stirred and parallel-tube model was close (68% and 82%, respectively) to its estimated in vivo CLh. Fluvoxamine and furafylline strongly inhibited tizanidine metabolism. Inhibitors specific to isoforms other than CYP1A2 had no substantial effect. Recombinant CYP1A2 metabolized tizanidine to a substantial degree (35% in 45 min), but other recombinant CYPs had little metabolic capacity for the drug.
Conclusions
CYP1A2 is primarily responsible for the metabolism of tizanidine. CYP1A2 inhibitors may inhibit its metabolism also in vivo.
Keywords: CYP1A2, elimination, in vitro, tizanidine
Introduction
Tizanidine is a centrally acting skeletal muscle relaxant, used for the symptomatic treatment of painful muscle spasms and spasticity. Furthermore, tizanidine has antinociceptive properties and is used for the treatment of chronic headache [1, 2].
The oral bioavailability of tizanidine is about 21% mainly due to extensive first-pass metabolism and its mean elimination half-life is approximately 3 h [1]. Less than 3% of the dose is excreted as parent tizanidine in urine, in which several metabolites have been detected [3].
Tizanidine has been in clinical use for about 20 years. However, the CYP enzymes involved in its metabolism are not known. This study aimed to determine which CYP enzymes catalyze the metabolism of tizanidine at therapeutic concentrations.
Methods
Chemicals and microsomes
Tizanidine hydrochloride (Novartis, Cork, Ireland), ketoconazole (Janssen, Olen, Belgium), troleandomycin, quinidine, trimethoprim, sulfaphenazole, furafylline, diethyldithiocarbamate (DDC), omeprazole and β-NADPH (Sigma Aldrich, St Louis, MO, USA), fluvoxamine (Solvay Duphar, Weesp, Holland) and ciprofloxacin (Bayer, Leverkusen, Germany) were used in this study. Pooled human liver microsomes, human recombinant CYP isoforms (SupersomesTM) and control supersomes were obtained from Gentest Corp. (Woburn, MA, USA). The human liver tissue had been obtained in accordance with all pertinent regulations. Other chemicals were from Merck (Darmstadt, Germany).
Incubation conditions
The depletion of tizanidine after its incubation with human liver microsomes or recombinant CYP isoforms was used as the measure of its metabolism. All incubations were conducted at 37 °C in duplicate (all the data were within 7% of their mean) in 0.1 m sodium phosphate buffer (pH 7.4), containing 5.0 mm MgCl2. Tizanidine 80 nm (dissolved in methanol and diluted with water), solvent with or without inhibitor, buffer and β-NADPH (1.0 mm) were premixed, and incubations were commenced by addition of microsomes. The incuba-tion mixture contained 1 mg ml−1 microsomal protein, 30 pmol CYP ml−1 (corresponding to the CYP1A2 activity in human liver microsomes), or the same protein content as with recombinant CYP1A2 (control supersomes). When substrate depletion as a function of incubation time was measured, the incubation volume was 2.5 ml and aliquots (0.4 ml) were removed at 0, 15, 30, 45, 60 and 75 min, added to 100 µl NaOH (0.4 m), and cooled on ice. In other experiments, the incubation volume was 1 ml and incubation time 45 min. No nonspecific microsomal binding of tizanidine was detected using equilibrium dialysis at 37 °C for 18 h (data not shown).
Furafylline, fluvoxamine and ciprofloxacin were used as inhibitors of CYP1A2, trimethoprim as an inhibitor of CYP2C8, sulfaphenazole as an inhibitor of CYP2C9, omeprazole as an inhibitor of CYP2C19, quinidine as an inhibitor of CYP2D6, DDC as an inhibitor of CYP2E1, and ketoconazole and troleandomycin as inhibitors of CYP3A4 [4–9]. Inhibitor concentrations are given in Figure 1. Stock solutions were prepared in water and methanol. Ciprofloxacin was dissolved in water and sodium hydroxide. Furafylline, troleandomycin and DDC were pre-incubated with human liver microsomes for 15 min, after which tizanidine was added. Control incubations contained an equal concentration of methanol (= 0.5%) or sodium hydroxide (0.01% w/v).
Figure 1.
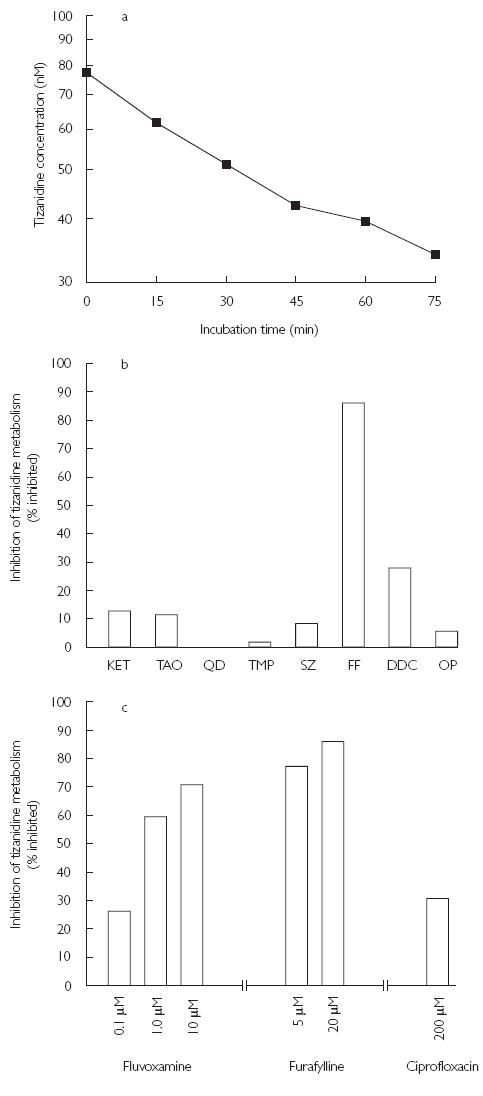
Metabolism of tizanidine (80 µm) by pooled human liver microsomes (a), and % of inhibition of tizanidine metabolism in pooled human liver microsomes by inhibitors of a range of CYP isoforms (b) and (c). The data points are the mean values from duplicate incubations. Key: KET, ketoconazole (1 µm); TAO, troleandomycin (100 µm); QD, quinidine (10 µm); TMP, trimethoprim (100 µm); SZ, sulfaphenazole (10 µm); FF, furafylline (20 µm); DDC, diethyldithiocarbamate (100 µm); OP, omeprazole (10 µm)
Measurement of tizanidine
After addition of the internal standard (clonidine 15 ng) the samples were extracted twice with 2.0 ml of ethyl acetate for 10 min [10]. After centrifugation, the supernatant was evaporated to dryness under nitrogen. The residue was reconstituted with 100 µl of the HPLC mobile phase. Tizanidine concentration was determined by HPLC with UV detection (320 nm for tizanidine and 228 nm for clonidine). A HP 1100 System (Waldbrunn, Germany) and a Waters Xterra RP18 reversed-phase column, 3.9 × 100 mm (Milford, MA, USA) were used. The mobile phase was acetonitrile : ammonium acetate (10 mm, pH 9.5) 12 : 88 (v/v), the flow rate was 0.75 ml min−1 and HPLC was performed at 35 °C. The limit of quantification (peak to noise-ratio 3 : 1) was 10 nm, and the coefficient of variation was 2.4% at 20 nm and 1.3% at 80 nm (n = 4).
Data analysis
Pseudo-first order rate constants (k) were determined from the depletion of tizanidine as a function of incubation time using nonlinear regression analysis. The elimination half-life (t1/2) was calculated by the equation t1/2= ln2/k. Assuming that the concentration of tizanidine (80 nm) is much smaller than the Km for its metabolism, the intrinsic clearance CLint, in vitro is equal to k/PMS, where PMS is the microsomal protein concentration [11]. These CLint, in vitro values were expressed per kilogram body weight by using the standard scaling factors of 48.8 mg microsomal protein g−1 liver and 25.7 g liver kg−1 body weight [12, 13].
Hepatic clearance (CLh) values were calculated using the well stirred model [14]:
and the parallel-tube model:
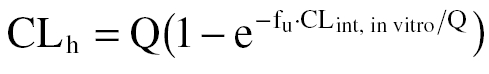 |
where Q is the hepatic blood flow (20 ml min−1 kg−1) [15] and fu is the unbound fraction (0.7) [3] of tizanidine in blood. These values were compared with the in vivo clearance of tizanidine. A directly measured in vivo clearance was not available in the literature, and therefore it was estimated using the equation CL = V/t1/2 × ln2, where V is the volume of distribution after intravenous administration (2.4 l kg−1) and t1/2 is the elimination half-life (2.5 h) for tizanidine [16].
Results
Incubation of tizanidine with human liver microsomes resulted in time- and NADPH-dependent substrate consumption. The decline in tizanidine concentration was log-linear until 45 min with a t1/2 of 50 min and initial reaction velocity of 1.1 pmol min−1 mg−1 protein (Figure 1a). The CLint, in vitro for tizanidine was estimated to be 17 ml min−1 kg−1. The predicted CLh of tizanidine was 7.5 ml min−1 kg−1 using the well-stirred model and 9.1 ml min−1 kg−1 using the parallel-tube model. Human liver microsomes did not metabolize tizanidine in the absence of β-NADPH.
Furafylline, fluvoxamine, ciprofloxacin and DDC caused substantial inhibition of the metabolism of tizanidine (Figure 1b and 1c). Ketoconazole, troleandomycin, sulfaphenazole, and omeprazole had a minor effect and quinidine and trimethoprim had no effect on tizanidine metabolism (Figure 1b).
The concentration of tizanidine decreased by 35% following incubation with recombinant CYP1A2 for 45 min (Figure 2). Five % of drug or less was lost when incubated with CYP2C19, CYP2E1, CYP3A4 and CYP3A5. Control supersomes did not metabolize tizanidine to any appreciable extent.
Figure 2.
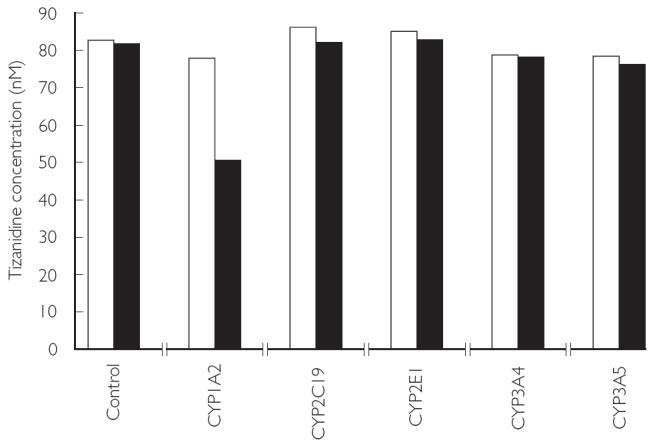
Metabolism of tizanidine (80 nm) by different human recombinant CYP isoforms. The data are the mean values from duplicate incubations. Incubation time: 0 min (□), 45 min (▪)
Discussion
Our aim was to identify the contribution of different CYP enzymes to the total elimination of tizanidine in vitro. To this end, the disappearance of parent tizanidine was measured after its incubation in the presence of pooled human liver microsomes. Although the use of a single substrate concentration and pooled human liver microsomes has some limitations, our results strongly suggest that at clinically relevant concentrations tizani-dine is metabolized mainly by CYP1A2 in vitro and that other CYPs do not contribute appreciably to its biotransformation.
Incubation of tizanidine with human liver microsomes and β-NADPH caused a log-linear depletion in tizanidine concentration. The predicted CLh of tizanidine using the well-stirred and parallel-tube model were 68% and 82%, respectively, of its estimated in vivo clearance (11.1 ml min−1 kg−1) [16]. This suggests that the elimination of tizanidine mainly occurs via CYP-dependent metabolism.
The CYP1A2 inhibitors furafylline (selective) and fluvoxamine strongly inhibited the metabolism of tizanidine, whereas inhibitors of other CYP isoforms had no substantial effects. In addition, ciprofloxacin, a moderately potent CYP1A2 inhibitor [6], had a marked effect. Fluvoxamine at 1 µm inhibited tizanidine metabolism by 60%. However, at the concentrations used (up to 10 µm), fluvoxamine can also inhibit CYP2C9, CYP2C19, CYP3A4 and CYP2D6 [17]. DDC, an inhibitor of CYP2E1, also inhibits CYP1A2 by approximately 30% at a concentration of 100 µm[5], which may explain the finding that DDC inhibited tizanidine metabolism by 28% in the present study. These findings suggest that CYP1A2 is primarily responsible for the metabolism of tizanidine.
The activity of recombinant CYP1A2 in the experiments was chosen to correspond to that of CYP1A2 in human liver microsomes. The decline in tizanidine concentration following incubation with recombinant CYP1A2 (35% in 45 min) was almost as rapid as that with human liver microsomes. The other recombinant CYP isoforms metabolized tizanidine to a minor extent.
The use of relevant substrate concentrations is important in in vitro studies since the contributions of the various CYP isoforms may vary according to the concentration used [15, 18]. For example, lignocaine is metabolized in vitro principally by CYP3A4 when its concentration exceeds 100–1000-fold the therapeutic range [19, 20], but mainly by CYP1A2 when its concentration is within this range [18]. In humans, inhibition of CYP1A2 raises the plasma concentration of lignocaine markedly, whereas inhibition of CYP3A4 has only a marginal effect [21, 22]. The concentration of tizanidine (80 nm) used in this in vitro study corresponds to the peak plasma concentrations (20 ng ml−1) in humans [1]. However, the relationship between the plasma concentration of a drug and its concentration at the enzyme active site in the hepatocyte is complex. Consequently, the use of a single, low substrate concentration can be misleading, for example, if enzyme kinetics in vitro are atypical (e.g. sigmoidal). However, our aim was not to study in detail the enzyme kinetics of tizanidine over a wide range of substrate concentrations or to identify all enzymes that can contribute to the individual metabolic pathways. We aimed to define the role of CYP enzymes in tizanidine metabolism at clinically relevant concentrations, in order to examine the need for further in vivo interaction studies.
Our findings suggest that fluvoxamine may impair tizanidine clearance in vivo, since plasma concentrations of the former [23] are comparable with concentrations that strongly inhibited tizanidine metabolism in vitro (present work).
In conclusion, our in vitro results indicate that CYP1A2 is primarily responsible for the metabolism of tizanidine. Tizanidine may be susceptible to in vivo interactions with inhibitors or inducers of CYP1A2.
Acknowledgments
This study was supported by grants from the Helsinki University Central Hospital Research Fund and the National Technology Agency.
References
- 1.Wagstaff AJ, Bryson HM. Tizanidine: A review of its pharmacology, clinical efficacy and tolerability in the management of spasticity associated with cerebral and spinal disorders. Drugs. 1997;53:435–52. doi: 10.2165/00003495-199753030-00007. [DOI] [PubMed] [Google Scholar]
- 2.Lake AE, III, Saper JR. Chronic headache. New advances in treatment strategies. Neurology. 2002;59(Suppl 2):S8–S13. doi: 10.1212/wnl.59.5_suppl_2.s8. [DOI] [PubMed] [Google Scholar]
- 3.Koch P, Hirst DR, von Wartburg BR. Biological fate of sirdalud in animals and man. Xenobiotica. 1989;19:1255–65. doi: 10.3109/00498258909043177. [DOI] [PubMed] [Google Scholar]
- 4.Brøsen K, Skjelbo E, Rasmussen BB, Poulsen HE, Loft S. Fluvoxamine is a potent inhibitor of cytochrome P4501A2. Biochem Pharmacol. 1993;45:1211–14. doi: 10.1016/0006-2952(93)90272-x. [DOI] [PubMed] [Google Scholar]
- 5.Eagling VA, Tjia JF, Back DJ. Differential selectivity of cytochrome P450 inhibitors against probe substrates in human and rat liver microsomes. Br J Clin Pharmacol. 1998;45:107–14. doi: 10.1046/j.1365-2125.1998.00679.x. [DOI] [PMC free article] [PubMed] [Google Scholar]
- 6.Fuhr U, Anders E-M, Mahr G, Sörgel F, Staib AH. Inhibitory potency of quinolone antibacterial agents against cytochrome P450IA2 activity in vivo and in vitro. Antimicrob Agents Chemother. 1992;36:942–8. doi: 10.1128/aac.36.5.942. [DOI] [PMC free article] [PubMed] [Google Scholar]
- 7.Ko J-W, Sukhova N, Thacker D, Chen P, Flockhart DA. Evaluation of omeprazole and lansoprazole as inhibitors of cytochrome P450 isoforms. Drug Metab Dispos. 1997;25:853–62. [PubMed] [Google Scholar]
- 8.Newton DJ, Wang RW, Lu AYH. Evaluation of specificities in the in vitro metabolism of therapeutic agents by human liver microsomes. Drug Metab Dispos. 1995;23:154–8. [PubMed] [Google Scholar]
- 9.Wen X, Wang J-S, Backman JT, Laitila J, Neuvonen PJ. Trimethoprim and sulfamethoxazole are selective inhibitors of CYP2C8 and CYP2C9, respectively. Drug Metab Dispos. 2002;30:631–5. doi: 10.1124/dmd.30.6.631. [DOI] [PubMed] [Google Scholar]
- 10.Lee J, Seo JH, Kim D-H. Determination of tizanidine in human plasma by gas chromatography-mass spectrometry. Analyst. 2002;127:917–20. doi: 10.1039/b202271k. [DOI] [PubMed] [Google Scholar]
- 11.Naritomi Y, Terashita S, Kimura S, Suzuki A, Kagayama A, Sugiyama Y. Prediction of human hepatic clearance from in vivo animal experiments and in vitro metabolic studies with liver microsomes from animals and humans. Drug Metab Dispos. 2001;29:1316–24. [PubMed] [Google Scholar]
- 12.Davies B, Morris T. Physiological parameters in laboratory animals and humans. Pharm Res. 1993;10:1093–5. doi: 10.1023/a:1018943613122. [DOI] [PubMed] [Google Scholar]
- 13.Iwatsubo T, Suzuki H, Shimada N, Chiba K, Ishizaki T, Green CE, Tyson CA, Yokoi T, Kamataki T, Sugiyama Y. Prediction of in vivo hepatic metabolic clearance of YM796 from in vitro data by use of human liver microsomes and recombinant P-450 isozymes. J Pharmacol Exp Ther. 1997;282:909–19. [PubMed] [Google Scholar]
- 14.Wilkinson GR. Clearance approaches in pharmacology. Pharmacol Rev. 1987;39:1–47. [PubMed] [Google Scholar]
- 15.Lin JH, Lu AYH. Role of pharmacokinetics and metabolism in drug discovery and development. Pharmacol Rev. 1997;49:403–49. [PubMed] [Google Scholar]
- 16.Bunch C . DRUGDEX® editorial staff. Tizanidine. In: Hutchison DA, Shahan DR, editors. DRUGDEX® Systems MICROMEDEX. Vol. 117. Greenwood Village, Colorado: expires 09/2003. [Google Scholar]
- 17.Hemeryck A, Belpaire FM. Selective serotonin reuptake inhibitors and cytochrome P-450 mediated drug–drug interactions: an update. Curr Drug Metab. 2002;3:13–37. doi: 10.2174/1389200023338017. [DOI] [PubMed] [Google Scholar]
- 18.Wang J-S, Backman JT, Taavitsainen P, Neuvonen PJ, Kivistö KT. Involvement of CYP1A2 and CYP3A4 in lidocaine N-deethylation and 3-hydroxylation in humans. Drug Metab Dispos. 2000;28:959–65. [PubMed] [Google Scholar]
- 19.Bargetzi MJ, Aoyama T, Gonzalez FJ, Meyer UA. Lidocaine metabolism in human liver microsomes by cytochrome P450IIIA4. Clin Pharmacol Ther. 1989;46:521–7. doi: 10.1038/clpt.1989.180. [DOI] [PubMed] [Google Scholar]
- 20.Imaoka S, Enomoto K, Oda Y, Asada A, Fujimori M, Shimada T, Fujita S, Guengerich FP, Funae Y. Lidocaine metabolism by human cytochrome P-450s purified from hepatic microsomes: Comparison of those with rat hepatic cytochrome P-450s. J Pharmacol Exp Ther. 1990;255:1385–91. [PubMed] [Google Scholar]
- 21.Isohanni MH, Neuvonen PJ, Olkkola KT. Effect of erythromycin and itraconazole on the pharmacokinetics of oral lignocaine. Pharmacol Toxicol. 1999;84:143–6. doi: 10.1111/j.1600-0773.1999.tb00890.x. [DOI] [PubMed] [Google Scholar]
- 22.Isohanni MH, Neuvonen PJ, Palkama VJ, Olkkola KT. Effect of erythromycin and itraconazole on the pharmacokinetics of intravenous lignocaine. Eur J Clin Pharmacol. 1998;54:561–5. doi: 10.1007/s002280050513. [DOI] [PubMed] [Google Scholar]
- 23.Niemi M, Backman JT, Neuvonen M, Laitila J, Neuvonen PJ, Kivistö KT. Effects of fluconazole and fluvoxamine on the pharmacokinetics and pharmacodynamics of glimepiride. Clin Pharmacol Ther. 2001;69:194–200. doi: 10.1067/mcp.2001.114229. [DOI] [PubMed] [Google Scholar]