Abstract
Aims
In experimental studies, morphine pharmacokinetics is different in the brain compared with other tissues due to the properties of the blood–brain barrier, including action of efflux pumps. It was hypothesized in this clinical study that active efflux of morphine occurs also in human brain, and that brain injury would alter cerebral morphine pharmacokinetics.
Methods
Patients with traumatic brain injury, equipped with one to three microdialysis catheters in the brain and one in abdominal subcutaneous fat for metabolic monitoring, were studied. The cerebral catheter locations were classified as ‘better’ and ‘worse’ brain tissue, referring to the degree of injury. Morphine (10 mg) was infused intravenously over a 10-min period in seven patients in the intensive care setting. Tissue and plasma morphine concentrations were obtained during the subsequent 3-h period with microdialysis and regular blood sampling.
Results
The area under the concentration–time curve (AUC) ratio of unbound morphine in brain tissue to plasma was 0.64 (95% confidence interval 0.40, 0.87) in ‘better’ brain tissue (P < 0.05 vs. the subcutaneous fat/plasma ratio), 0.78 (0.49, 1.07) in ‘worse’ brain tissue and 1.00 (0.86, 1.13) in subcutaneous fat. The terminal half-life and Tmax were longer in the brain vs. plasma and fat, respectively. The relative recovery for morphine was higher in ‘better’ than in ‘worse’ brain tissue. The Tmax value tended to be shorter in ‘worse’ brain tissue.
Conclusions
The unbound AUC ratio below unity in the ‘better’ human brain tissue demonstrates an active efflux of morphine across the blood–brain barrier. The ‘worse’ brain tissue shows a decrease in relative recovery for morphine and in some cases also an increase in permeability for morphine over the blood–brain barrier.
Keywords: blood–brain barrier, brain injury, human, microdialysis, morphine, pharmacokinetics
Introduction
Important biological functions of the blood–brain barrier (BBB) are to regulate the brain volume and to keep the composition of the extracellular fluid within physiological limits. As a consequence, this barrier can prevent drugs from penetrating to the brain tissue from blood. Molecular penetration across the BBB could be by both passive diffusion and active transport. Several membrane proteins such as the P-glycoprotein actively transport substrates across cerebral endothelial cells back to the blood stream [1, 2]. Drugs that are substrates for these efflux pumps reach lower unbound concentrations in the brain than in blood [3]. Since morphine is a substrate for P-glycoprotein [4] and also for probenecid-sensitive transporters [5], the ratio between unbound concentrations of morphine in brain to that in blood [area under the concentration–time curve (AUC) ratio brain/blood] is expected to be below unity. If the transport proteins are inhibited, the unbound AUC ratio brain/blood will increase [6], and reach unity. The existence of P-glycoprotein in intact human brain has been structurally demonstrated [7], and its activity indirectly confirmed [8].
Microdialysis is a well-established method for experimental pharmacokinetic studies in various tissues. Unbound drug concentrations can be measured in the extracellular fluid (ECF) over several days. At Lund University Hospital, microdialysis is routinely used in patients for postoperative cerebral metabolic monitoring following traumatic brain lesions. The patients are intraoperatively equipped with intracerebral microdialysis catheters placed in the penumbra zone surrounding an evacuated haematoma or injured brain tissue, and in the contralateral hemisphere. During the subsequent intensive care period with concomitant sedation and ventilator treatment, metabolic parameters such as glucose, lactate, pyruvate and glycerol are analysed every hour for 2–10 days [9, 10].
The primary aim of this study was to examine morphine pharmacokinetics in the human brain, and to compare it with pharmacokinetics in plasma and abdominal subcutaneous adipose tissue. We hypothesized that pharmacokinetic signs of in vivo active transport mechanisms of morphine over the human BBB would be present. A secondary aim was to compare cerebral morphine pharmacokinetics in regions with different degrees of brain injury.
Materials and methods
The Ethics Committee at Lund University Hospital approved the study. Relatives of all patients were given detailed written and oral information regarding the study, and consent was obtained for each patient. Data were collected from November 1998 until October 2000.
Seven patients with severe brain trauma were included in the study. In five patients craniotomy was performed for evacuation of focal mass lesions. During surgery two CMA/70 microdialysis catheters (CMA Microdialysis AB, Solna, Sweden) with a 10-mm membrane were placed in brain tissue. One catheter was placed in the penumbra zone (i.e. the brain tissue surrounding the evacuated haematoma or focal brain contusion), which was defined as ‘worse’ brain tissue. Another catheter was placed contralaterally through a separate burr hole adjacent to a burr hole used for routine continuous intracerebral pressure (ICP) measurements. This region of the brain had a normal appearance on the computed tomography (CT) scan, and was referred to as ‘better’ brain tissue. In one patient, an additional catheter was placed in the penumbra zone, resulting in two catheters in ‘worse’ brain tissue. In two patients, with a general brain swelling but no focal mass lesion, open surgery was not performed and only a pressure transducer was inserted. These two patients had only one intracranial microdialysis catheter inserted, and in both instances the localization was referred to as ‘better’ brain tissue.
After admission to the intensive care unit a CMA/60 microdialysis catheter (CMA Microdialysis) with a 30-mm membrane was placed in abdominal subcutaneous fat. The patients were continuously sedated with midazolam and fentanyl during controlled ventilation, and otherwise treated according to departmental guidelines [11]. The intravenous fentanyl infusion was stopped 15 min before starting the 10-min intravenous morphine infusion. Fentanyl was resumed 45 min after stopping the morphine infusion.
During the clinical monitoring of the cerebral metabolism, all microdialysis catheters were perfused with a Ringer's solution (Perfusion Fluid; CMA Microdialysis) at a flow rate of 0.3 µl min−1 by a CMA/106 microinfusion pump (CMA Microdialysis). Samples of the dialysate were collected in capped microvials (CMA Microdialysis) to minimize evaporation, and were analysed at the bedside each hour for metabolic surveillance (glucose, lactate, pyruvate and glycerol) using enzymatic techniques (CMA600; CMA Microdialysis). To express the local cerebral energy metabolism in the ‘better’ and ‘worse’ brain locations the average level from surgery to the pharmacokinetic study was obtained for glucose, glycerol, lactate and the lactate/pyruvate ratio.
Study design
The pharmacokinetic study was performed 2–6 days following the trauma, when the patients were considered clinically stable. No patient had previously received morphine. The flow rate through the microdialysis catheters was increased to 1 µl min−1 by utilizing a CMA/102 microinfusion pump (CMA Microdialysis). Samples of the microdialysate were collected in capped microvials (CMA Microdialysis). After a 1-h stabilization period each catheter was calibrated in vivo for morphine recovery according to the method of retrodialysis by drug [12]. The calibration procedure provided the recovery (relative recovery), i.e. the dialysed fraction of the true tissue concentration. The estimation of the in vivo recovery value is a prerequisite for the calculation of the absolute concentration of unbound morphine in the ECF of the brain and subcutaneous adipose tissue. Following a washout period, 10 mg of morphine hydrochloride (Morfin Special, 0.4 mg ml−1; AstraZeneca, Sodertalje, Sweden) were administered as an intravenous infusion over 10 min. Samples of the dialysate were collected every 5 min during the first 30 min, and thereafter every 10 min for 3 h. Arterial blood samples were collected at the mid time point of the dialysate sampling period during the first 30 min after the start of the morphine infusion. Additional samples were collected at 50, 80, 110 and 170 min. The blood samples were centrifuged for 10 min at 3000 r.p.m. (7200 g). The obtained plasma samples and the dialysates were immediately frozen at −20 °C pending analysis. After sampling for the morphine study, the flow rate through the microdialysis catheters was reset to 0.3 µl min−1 for continued metabolic monitoring.
Protein binding
The protein binding of morphine in plasma was measured by equilibrium dialysis. Four plasma samples from each patient were used. Pooled plasma drawn at 7.5 and 10 min, and at 17.5 and 22.5 min were used. Before starting the dialysis, pH was adjusted to 7.4 with 0.1 m HCl. The chambers used had a volume of 1 ml and the dialysis membrane (Spectra/Por® had a molecular weight cut-off of 12–14 kDa. Plasma, 0.5 ml, was dialysed against the same volume of phosphate buffer (pH 7.4) in an atmosphere of 5% CO2 in air. The dialysis, which continued for 7 h, was performed in triplicates at 37 °C. After the dialysis pH was checked and samples were collected for analysis from both chambers.
Analysis of morphine
The morphine concentration in the dialysate, plasma and in buffer was determined using a high-performance liquid chromatography (HPLC) system with electrochemical detection. For the analysis of the dialysate 9 µl were directly injected by a Triathlon (Spark Holland, Emmen, the Netherlands). Separation was achieved using a Nucleosil C18 column (150 × 4.6 mm i.d. and 5-µm particles; Chrompack, Middelburg, the Netherlands). The 5-µl samples were diluted to yield the injection volume required for the analysis. Morphine was detected using an electrochemical detector (Coulochem II; ESA Inc., Chelmsford, MA, USA) with a guard cell (ESA 5020; ESA Inc.) as well as an analytical cell (ESA 5011; ESA Inc.). The potentials were set at 600 mV for the guard cell, and 0 mV and 450 mV for the two analytical cells. The mobile phase contained 600 ml 0.01 m phosphate buffer pH 2.1, 144 mg SDS, 400 ml methanol and 20 ml tetrahydrofuran and was delivered at 1.0 ml min−1. Peak height was used for the quantification of morphine. The standard curve was linear up to 75 ng ml−1, and the limit of quantification was 0.5 ng ml−1[coefficient of variation (CV) 8.5%]. The same chromatographic system was used for the analysis of morphine in the buffer. The mobile phase was modified and contained 580 ml 0.01 m phosphate buffer pH 2.1, with 0.4 mm SDS, 420 ml methanol, and 20 ml tetrahydrofuran. The plasma samples were analysed using the same chromatographic system as described above, but with the potential set at 300 mV for analytical cell 1. The mobile phase was changed and consisted of 670 ml 0.01 m phosphate buffer pH 2.1 with 0.2 mm SDS, 330 ml methanol and 50 ml tetrahydrofuran. The plasma samples were pretreated using a slightly modified method by Joel et al. [13]. The residue from the pretreatment was dissolved in 150 µl of the mobile phase and 55 µl were injected into the HPLC system. The standard curve was linear up to 6000 ng ml−1, and the limit of quantification was 6 ng ml−1 (CV 5.1%).
Pharmacokinetic analysis
The terminal half-lives (In2/λ) in brain, subcutaneous fat and plasma were estimated by log-linear regression. The AUC in brain, subcutaneous fat and plasma was used to measure the exposure of unbound morphine in the different tissues. The unbound morphine concentration in plasma was calculated for each patient using the individual estimate of the protein binding. The AUC was determined using noncompartmental analysis with linear interpolation. The rest of the area was calculated from the terminal slope (λ). The extent of equilibration across the BBB was estimated from the unbound AUC ratio in brain to plasma (AUC ratio brain/plasma). The systemic pharmacokinetic parameters were calculated from the observed plasma data, i.e. the total morphine concentrations. Tmax was estimated as the time from start of the morphine infusion to maximum concentration as measured with microdialysis in the different catheter positions. The pharmacokinetic calculations were performed using the software Microsoft Excel® 2000 (Microsoft Corporation, Seattle, WA, USA).
Statistical analysis
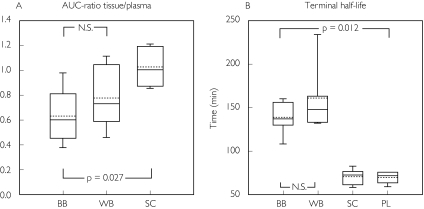
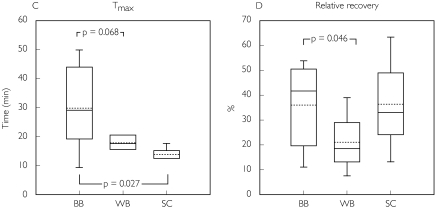
For statistical comparison between data from the different microdialysis catheter positions, a Wilcoxon signed rank test was used. The values in the text are presented as mean ± SD, and the 95% confidence intervals are also given for the AUC ratios. In addition, medians and percentiles are given in Figure 2. Descriptive statistics from ‘better’ brain tissue, subcutaneous adipose tissue and plasma represent all seven patients, while ‘worse’ brain tissue represents the five patients with two or more intracranial catheters. A P-value <0.05 was considered statistically significant.
Figure 2.
Box plots demonstrating median (solid centre line), mean value (dotted centre line), 25th and 75th percentile (lower and upper box limit), and 5th and 95th percentile (error bars) for morphine pharmacokinetics and the relative recovery in patients with traumatic brain injury. The values were obtained by microdialysis in ‘better’ brain tissue (BB), ‘worse’ brain tissue (WB) and in subcutaneous adipose tissue (SC). The plasma (PL) data were obtained by regular blood sampling
Results
Demographic data are presented in Table 1, and in Table 2 concomitant medication is tabulated. In Table 3 individual microdialysis data for the energy metabolism at each catheter location are presented with the corresponding values for morphine pharmacokinetics and the relative recovery. Patient 3 died during the intensive care period due to an intractable increase in ICP. The morphine study was performed 3 days before the patient died.
Table 1.
Demographic data
| Patient | Trauma | Gender | Age | No. of cerebral catheters | Study day after trauma | Coexisting diseases |
|---|---|---|---|---|---|---|
| 1 | Pedestrian hit by car | Male | 32 | 2 | 6 | Schizophrenia |
| 2 | Unknown | Male | 47 | 3 | 2 | Epilepsy, alcohol abuse |
| 3 | Car accident | Male | 52 | 2 | 6 | No |
| 4 | Fall from a ladder | Male | 56 | 2 | 4 | No |
| 5 | Fall in the street | Male | 56 | 2 | 2 | Alcohol abuse |
| 6 | Car accident | Male | 22 | 1 | 5 | No |
| 7 | Fall in a stair | Female | 46 | 1 | 2 | Alcohol abuse |
Table 2.
Concomitant medication
| Patient | Individual medication* |
|---|---|
| 1 | Acetylcysteine, cefuroxime, citalopram, clozapine, dalteparin, insulin, lactulose, metoclopramide, salbutamol, sodium picosulphate, sucralfate, thiopental, and zinc |
| 2 | Acetylcysteine, cefuroxime, ipratropiumbromide, metoprolol, potassium, ranitidine, and salbutamol |
| 3 | Acetylcysteine, cisapride, dalteparin, lactulose, meropenem, metoclopramide, potassium, salbutamol, and zinc |
| 4 | Acetylcysteine, cefuroxime, lactulose, metoclopramide, metoprolol, potassium, ranitidine, sucralphate, and zinc |
| 5 | Acetylcysteine, cefuroxime, cisapride, lactulose, metoclopramide, metoprolol, potassium, ranitidine, salbutamol, and zinc |
| 6 | Acetylcysteine, betamethasone, cefuroxime, cisapride, folic acid, insulin, lactulose, metoclopramide, ranitidine, salbutamol, sodium picosulphate, and zinc |
| 7 | Cisapride, metoclopramide, metoprolol, ranitidine, salbutamol, sucralfate, and zinc |
All patients received clonidine, midazolam, fentanyl, furosemide and paracetamol.
Table 3.
Extracellular cerebral concentrations of glucose, glycerol, lactate and lactate/pyruvate ratio, together with cerebral and subcutaneous morphine pharmacokinetics and relative recovery measured with microdialysis, and t1/2 in plasma (not microdialysis), in patients with severe brain trauma
| Cerebral energy metabolism | Morphine pharmacokinetics | ||||||||
|---|---|---|---|---|---|---|---|---|---|
| Patient | Place | Glucose (mmol l−1) | Glycerol (µmol l−1) | Lactate (mmol l−1) | Lactate/ pyruvate ratio | Recovery (%) | t1/2 (min) | AUC-ratio tissue vs. plasma | Tmax(min) |
| 1 | BB | 1.5 | 33.6 | 1.7 | 15.6 | 33.0 | 156 | 0.36 | 17.5 |
| 1 | WB | 0.8 | 82.6 | 1.5 | 18.6 | 21.0 | 135 | 1.05 | 17.5 |
| 1 | SC | 18.1 | 83.3 | 0.87 | 12.5 | ||||
| 1 | PL | 57.1 | |||||||
| 2 | BB | 4.8 | 89.7 | 5.8 | 21.3 | 50.4 | 135 | 0.60 | 20.5 |
| 2 | WB | 0.1 | 469.7 | 8.9 | 607.0 | 7.0 | 242 | 0.86 | 15.5 |
| 2 | WB | 2.9 | 129.1 | 5.1 | 17.8 | 12.7 | 132 | 0.59 | 20.5 |
| 2 | SC | 32.7 | 72.4 | 1.21 | 12.5 | ||||
| 2 | PL | 76.0 | |||||||
| 3 | BB | 9.4 | 21.9 | 7.1 | 23.2 | 54.9 | 161 | 0.48 | 38 |
| 3 | WB | 2.1 | 281.0 | 3.7 | 25.0 | 15.6 | 163 | 1.12 | 15.5 |
| 3 | SC | 40.5 | 57.9 | 1.17 | 12.5 | ||||
| 3 | PL | 64.2 | |||||||
| 4 | BB | 1.8 | 27.8 | 2.3 | 15.1 | 26.4 | 101 | 0.42 | 50 |
| 4 | WB | 0.7 | 270.4 | 8.1 | 36.3 | 28.5 | 133 | 0.60 | 17.5 |
| 4 | SC | 10.5 | 58.7 | 0.98 | 17.5 | ||||
| 4 | PL | 62.8 | |||||||
| 5 | BB | 5.0 | 43.6 | 3.6 | 14.4 | 51.3 | 139 | 0.65 | 50 |
| 5 | WB | 1.2 | 37.4 | 8.1 | 33.6 | 40.0 | 161 | 0.44 | 20.5 |
| 5 | SC | 65.6 | 79.6 | 0.87 | 17.5 | ||||
| 5 | PL | 72.7 | |||||||
| 6 | BB | 1.8 | 68.7 | 1.4 | 16.0 | 10.1 | 125 | 0.98 | 5.5 |
| 6 | SC | 56.9 | 64.2 | 0.85 | 12.5 | ||||
| 6 | PL | 76.1 | |||||||
| 7 | BB | 2.5 | 81.5 | 3.8 | 26.1 | 12.7 | 157 | 0.97 | 38 |
| 7 | SC | 30.0 | 72.9 | 1.03 | 12.5 | ||||
| 7 | PL | 70.4 | |||||||
| Mean ± SD | BB | 3.8 ± 2.8* | 52.4 ± 27.3* | 3.7 ± 2.1 | 18.8 ± 4.7 | 34.0 ± 18.6* | 139.2 ± 21.3† | 0.64 ± 0.25‡ | 31.4 ± 17.1‡ |
| Mean ± SD | WB | 1.3 ± 1.1 | 211.7 ± 160.4 | 5.9 ± 3.0 | 123.1 ± 237.2 | 21.0 ± 11.9 | 161.0 ± 42.1 | 0.78 ± 0.28 | 17.8 ± 2.3 |
| Mean ± SD | SC | 36.6 ± 19.8 | 69.9 ± 9.9 | 1.00 ± 0.15 | 13.9 ± 2.4 | ||||
| Mean ± SD | PL | 68.5 ± 7.3 | |||||||
BB, ‘Better’ brain tissue; WB, ‘worse’ (injured) brain tissue; SC, subcutaneous adipose tissue; PL, plasma.
P < 0.05 vs. WB;
P < 0.05 vs. PL;
P < 0.05 vs. SC.
The cerebral glucose concentration was lower (P = 0.028) and the glycerol concentration was higher (P = 0.046) in the ‘worse’ compared with ‘better’ brain tissue. There were no statistically significant differences between the two cerebral locations regarding lactate concentrations or lactate/pyruvate ratios.
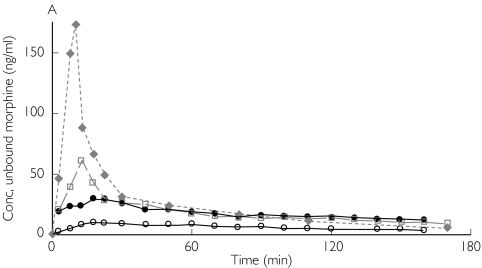
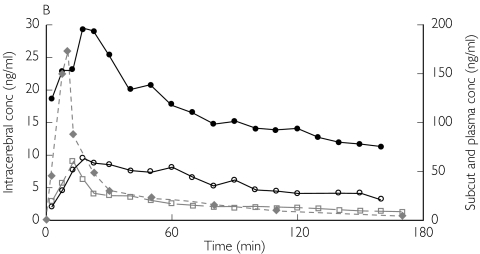
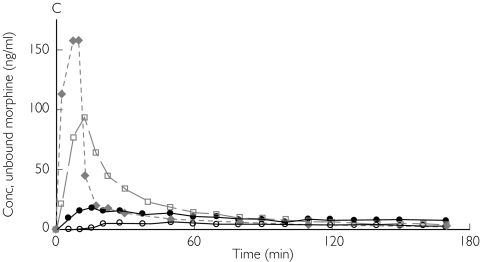
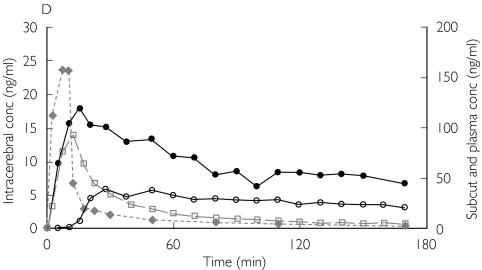
The AUC ratio fat/plasma for unbound morphine was 1.00 [95% confidence interval (CI) 0.86, 1.13]. In contrast, the AUC ratio brain/plasma for unbound morphine was below unity in both ‘better’ and ‘worse’ brain tissue, 0.64 (0.40, 0.87) and 0.78 (0.49, 1.07), respectively. Unbound morphine concentration–time data, corrected for the recovery, for patients 1 and 3 are presented in Figure 1. There was a significant difference between the AUC ratio brain/plasma in the ‘better’ brain tissue and fat/plasma (P = 0.025). However, no difference in AUC ratio brain/plasma could be demonstrated between ‘better’ and ‘worse’ brain locations (Table 3 and Figure 2A).
Figure 1.
Absolute concentrations of unbound morphine obtained by microdialysis in patient 1 (A,B) and patient 3 (C,D) from ‘better’ brain tissue (○), ‘worse’ brain tissue (•), abdominal subcutaneous adipose tissue (□) and arterial plasma ( ) (not microdialysis) during and after intravenous infusion of 10 mg morphine over 10 min starting at 0 min. (A,C) All curves are plotted against one ordinate to demonstrate the difference in unbound concentrations between the different tissues. (B,D)Intracerebral concentrations are plotted against the left ordinate, and the subcutaneous and plasma concentrations are plotted against the right ordinate
Plasma clearance of total morphine was estimated as 119 ± 30 l h−1, and the volume of distribution (Vd β) as 179 ± 44 l. The fraction of unbound morphine in plasma was 84 ± 4.4%. The terminal half-life of unbound morphine in subcutaneous fat was almost identical to the terminal half-life for total morphine concentration in plasma (69.9 ± 9.9 vs. 68.5 ± 7.3 min). In contrast, the intracerebral terminal half-life of unbound morphine in the ‘better’ brain tissue was significantly longer than in subcutaneous fat (P = 0.012) and in plasma (P = 0.012), respectively. However, the terminal half-life in the ‘better’ brain tissue did not differ from the ‘worse’ side (P = 0.249) (Table 3 and Figure 2B).
The Tmax in ‘better’ brain tissue was longer than in subcutaneous adipose tissue (P = 0.027). There was a tendency, although not significant, for Tmax to be shorter in ‘worse’ than in ‘better’ brain locations (P = 0.068) (Table 3 and Figure 2C).
The intracerebral catheter positions in the ‘worse’ location had a relative recovery for morphine that was significantly lower than in ‘better’ brain tissue (Table 3 and Figure 2D).
Discussion
In the present clinical investigation, morphine pharmacokinetics was studied in cerebral tissue, subcutaneous adipose tissue, and arterial plasma in patients with severe brain trauma. Of major interest were the two comparisons between the properties of ‘better’ brain tissue vs. plasma, and ‘better’vs.‘worse’ brain tissue.
The perioperative categorization of the intracerebral microdialysis catheter localizations in ‘better’ and ‘worse’ brain tissue was performed according to our clinical routines. Different energy metabolism is earlier demonstrated in ‘better’ and ‘worse’ brain tissue [9, 10]. In the present study, a metabolically altered brain tissue in ‘worse’ compared with ‘better’ parts of the brain was confirmed.
The lower levels of extracellular glucose together with the increased concentrations of glycerol in ‘worse’ brain tissue are signs of a more pronounced perturbation of the cerebral metabolism due to a higher degree of tissue trauma [9, 10, 14–16]. However, it could be questioned whether the ‘better’ brain tissue represents intact brain tissue, since severe brain trauma is often global, especially in patients with global brain swelling without a focal mass as in patients 6 and 7. Further, there was a high incidence of coexisting disease that may have affected the cerebral function (Table 1).
The AUC ratio fat/plasma for unbound morphine of 1.0 suggests that passive diffusion is the dominating mechanism for transcapillary transport of morphine in subcutaneous adipose tissue. In contrast, the AUC ratio brain/plasma for unbound morphine was below unity both in the ‘better’ (0.64) and ‘worse’ (0.78) brain tissue, implying that efflux pumps act on morphine at the BBB level in the human brain. This mechanism has been demonstrated in experimental studies with unbound morphine AUC ratios brain/plasma of 0.51 [17], and AUC ratios brain/blood of 0.28 [18], 0.29 [5], 0.47 [6] in the rat and 0.47 in the pig (unpublished data). In this study all patients received fentanyl prior to morphine administration. Since fentanyl is an inhibitor of P-glycoprotein it is possible that these transporters were blocked to some extent during the morphine study [19]. If that was the case, the unbound morphine AUC ratio brain/plasma was overestimated compared with a situation with no interaction with any active transporters.
In the cerebral ECF, lactate and lactate/pyruvate ratios are the same in the two cerebral regions, decreasing the probability of pH-induced changes of the pharmacokinetics, i.e. ion trapping.
In a porcine model, the AUC ratio brain/blood for unbound morphine increased from 0.47 in intact brain to 0.95 after induction of experimental meningitis (unpublished data). One would expect a similar finding in humans with a higher AUC ratio for unbound morphine in ‘worse’ compared with ‘better’ brain tissue. However, we found no statistical difference in the pharmacokinetics of morphine between the ‘better’ and ‘worse’ brain regions. An unbound morphine AUC ratio brain/plasma close to unity was indeed found in some ‘worse’ catheters, but other factors than cerebral metabolism could have correlated with altered BBB permeability for morphine.
The decrease in relative recovery demonstrated in ‘worse’ compared with ‘better’ brain regions indicates an increased resistance to mass transfer for morphine in ‘worse’ brain tissue [20, 21]. A decreased active morphine efflux from the ‘worse’ brain tissue might increase the resistance [20]. Since the microdialysis catheters and the flow rate of the perfusate are the same in the two cerebral regions, one could anticipate that the lower recovery in the ‘worse’ brain tissue reflects alterations in the brain tissue surrounding the microdialysis membranes. A decreased cerebral recovery for morphine was also found in experimental meningitis compared with intact brain in pigs (unpublished data). This implies that the relative recovery per se might reflect the degree of tissue trauma.
In the ‘better’ brain locations, all patients but two had an AUC ratio brain/plasma for unbound morphine below unity. In contrast, patients 6 and 7 showed an unbound morphine AUC ratio of 0.98 and 0.97 together with very low relative recoveries (0.10 and 0.13, respectively). They were the only two patients with signs of a general brain swelling without a focal mass lesion. Accordingly, open surgery was not performed, and they had only one intracranial microdialysis catheter each (classified as ‘better’ brain tissue). Despite normal metabolic values and CT scans in the area of cerebral microdialysis, these two patients demonstrated AUC ratios brain/plasma for unbound morphine near unity and very low relative recoveries that diverged from other ‘better’ brain tissue values. This indicates that in patients with general brain oedema, the BBB permeability for morphine might be increased despite normal energy metabolism and CT scan. On the other hand, in patients with focal brain lesions the contralateral hemisphere may represent relatively uninjured brain tissue. In patients 1–5 cerebral energy metabolism was close to normal in the ‘better’ position. In these patients the mean value of the unbound morphine AUC ratio brain/plasma in the ‘better’ brain tissue was 0.51 ± 0.12, i.e. almost similar to data from normal piglet brain.
The average morphine plasma clearance of 119 l h−1 in the patients in this study is in agreement with results in healthy volunteers [22]. The terminal half-life for unbound morphine in the subcutaneous adipose tissue was similar to the half-life for the total morphine concentration in plasma. On the other hand, we found a longer half-life in the brain tissue compared with both plasma and subcutaneous fat. This is in agreement with findings in the rat (44 vs. 30 min; brain vs. blood) [18], and in the pig (94 vs. 59 min; unpublished data).
The longer Tmax in the brain demonstrates again that cerebral pharmacokinetics differs from peripheral tissue and plasma. The BBB properties created by the presence of tight junctions and lack of fenestrations may explain this finding. From a clinical point of view, a Tmax in the order of 30 min is in the same range as the time to maximum analgesia after an intravenous bolus dose of morphine [23]. The tendency toward a shorter Tmax in ‘worse’ brain tissue gives an indication of an increased BBB permeability to morphine. This may suggest a pharmacokinetic explanation to the common clinical recommendation that opioids should be used with caution in patients with suspected brain trauma [24].
Determination of human cerebral pharmacokinetics of drugs is relevant from several aspects. First, the pharmacokinetic data are important to determine dose regimens and to understand clinical effects and side-effects. Second, it is important to understand the similarities and the differences between species. Third, knowledge regarding pharmacokinetic differences between intact and injured brain tissue could be of great value. Such data could be important for calculations of target-controlled intravenous anaesthesia [25], the development of new drugs, and the ability to modify the pharmacological treatment of patients with brain injury. In this study, morphine was investigated, but the microdialysis method is suitable for other drugs that have its effect in the brain, both in the experimental and clinical settings.
In summary, we found an AUC ratio between the unbound morphine concentrations in the ECF in the human brain and plasma below unity, indicating an efflux transport system for morphine across the human BBB. Further, a longer terminal half-life and Tmax are demonstrated in the human brain, in comparison with plasma and subcutaneous adipose tissue. An increased BBB permeability to morphine may occur in the penumbra zone surrounding a focal mass lesion and in apparently normal brain regions in patients with a general brain swelling.
Acknowledgments
Supported by grants from The Segerfalk Foundation (Lund University Hospital, Lund, Sweden), The Swedish Foundation for Strategic Research (Stockholm, Sweden) and The Swedish Medical Research Foundation (Stockholm, Sweden). The authors thank Katarina Nielsen, RN (Department of Clinical Neuroscience, Lund University Hospital, Lund, Sweden) for help with conducting the study; Henrik Björk (Department of Clinical Pharmacology, Lund University Hospital, Sweden) for technical assistance; AnnSofi Fyhr (Lund University Hospital Pharmacy, Lund, Sweden) for help with preparation of the solutions; and Britt Jansson (Department of Pharmaceutical Biosciences, Uppsala University, Uppsala, Sweden) for assistance with the chemical analysis. Presented in part as a poster at the annual meeting of the American Society of Anaesthesiologists, San Francisco, California, October, 2000.
References
- 1.Ambudkar SV, Dey S, Hrycyna CA, Ramachandra M, Pastan I, Gottesman MM. Biochemical, cellular, and pharmacological aspects of the multidrug transporter. Annu Rev Pharmacol Toxicol. 1999;39:361–98. doi: 10.1146/annurev.pharmtox.39.1.361. [DOI] [PubMed] [Google Scholar]
- 2.Taylor JC, Horvath AR, Higgins CF, Begley GS. The multidrug resistance P-glycoprotein. Oligomeric state and intramolecular interactions. J Biol Chem. 2001;276:36075–8. doi: 10.1074/jbc.C100345200. [DOI] [PubMed] [Google Scholar]
- 3.Xie R, Hammarlund-Udenaes M, de Boer AG, de Lange EC. The role of P-glycoprotein in blood–brain barrier transport of morphine: transcortical microdialysis studies in mdr1a (–/–) and mdr1a (+/+) mice. Br J Pharmacol. 1999;128:563–8. doi: 10.1038/sj.bjp.0702804. [DOI] [PMC free article] [PubMed] [Google Scholar]
- 4.King M, Su W, Chang A, Zuckerman A, Pasternak GW. Transport of opioids from the brain to the periphery by P-glycoprotein: peripheral actions of central drugs. Nat Neurosci. 2001;4:268–74. doi: 10.1038/85115. [DOI] [PubMed] [Google Scholar]
- 5.Tunblad K, Jonsson EN, Hammralund-Udenaes M. Morphine blood–brain barrier transport is influenced by probenecid co-administration. Pharm Res. 2003;20:618–23. doi: 10.1023/a:1023250900462. [DOI] [PubMed] [Google Scholar]
- 6.Letrent SP, Pollack GM, Brouwer KR, Brouwer KL. Effects of a potent and specific P-glycoprotein inhibitor on the blood–brain barrier distribution and antinociceptive effect of morphine in the rat. Drug Metab Dispos. 1999;27:827–34. [PubMed] [Google Scholar]
- 7.Sisodiya SM, Lin WR, Harding BN, Squier MV, Thom M. Drug resistance in epilepsy: expression of drug resistance proteins in common causes of refractory epilepsy. Brain. 2002;125:22–31. doi: 10.1093/brain/awf002. [DOI] [PubMed] [Google Scholar]
- 8.Sadeque AJ, Wandel C, He H, Shah S, Wood AJ. Increased drug delivery to the brain by P-glycoprotein inhibition. Clin Pharmacol Ther. 2000;68:231–7. doi: 10.1067/mcp.2000.109156. [DOI] [PubMed] [Google Scholar]
- 9.Ståhl N, Mellergård P, Hallström A, Ungerstedt U, Nordström CH. Intracerebral microdialysis and bedside biochemical analysis in patients with fatal traumatic brain lesions. Acta Anaesthesiol Scand. 2001;45:977–85. doi: 10.1034/j.1399-6576.2001.450810.x. [DOI] [PubMed] [Google Scholar]
- 10.Ståhl N, Ungerstedt U, Nordström CH. Brain energy metabolism during controlled reduction of cerebral perfusion pressure in severe head injuries. Intensive Care Med. 2001;27:1215–23. doi: 10.1007/s001340101004. [DOI] [PubMed] [Google Scholar]
- 11.Eker C, Asgeirsson B, Grande PO, Schalen W, Nordstrom CH. Improved outcome after severe head injury with a new therapy based on principles for brain volume regulation and preserved microcirculation. Crit Care Med. 1998;26:1881–6. doi: 10.1097/00003246-199811000-00033. [DOI] [PubMed] [Google Scholar]
- 12.Bouw MR, Hammarlund-Udenaes M. Methodological aspects of the use of a calibrator in in vivo microdialysis –further development of the retrodialysis method. Pharm Res. 1998;15:1673–9. doi: 10.1023/a:1011992125204. [DOI] [PubMed] [Google Scholar]
- 13.Joel SP, Osborne RJ, Slevin ML. An improved method for the simultaneous determination of morphine and its principal glucuronide metabolites. J Chromatogr. 1988;430:394–9. doi: 10.1016/s0378-4347(00)83176-x. [DOI] [PubMed] [Google Scholar]
- 14.Hillered L, Valtysson J, Enblad P, Persson L. Interstitial glycerol as a marker for membrane phospholipid degradation in the acutely injured human brain. J Neurol Neurosurg Psychiatry. 1998;64:486–91. doi: 10.1136/jnnp.64.4.486. [DOI] [PMC free article] [PubMed] [Google Scholar]
- 15.Reinstrup P, Ståhl N, Mellergård P, Uski T, Ungerstedt U, Nordström CH. Intracerebral microdialysis in clinical practice: baseline values for chemical markers during wakefulness, anesthesia, and neurosurgery. Neurosurgery. 2000;47:701–9. doi: 10.1097/00006123-200009000-00035. discussion 709. [DOI] [PubMed] [Google Scholar]
- 16.Ungerstedt U, Bäckström T, Hallström Å, Grände PO, Mellergård P, Nordström CH. Microdialysis in normal and injured brain. In: Kinney JM, Tucker HN, editors. Physiology, Stress and Malnutrition: Functional Correlates, Nutritional Intervention. Philadelphia: Lippincott-Raven; 1997. pp. 361–74. [Google Scholar]
- 17.Stain-Texier F, Boschi G, Sandouk P, Scherrmann JM. Elevated concentrations of morphine 6-beta-D-glucuronide in brain extracellular fluid despite low blood–brain barrier permeability. Br J Pharmacol. 1999;128:917–24. doi: 10.1038/sj.bjp.0702873. [DOI] [PMC free article] [PubMed] [Google Scholar]
- 18.Bouw MR, Gårdmark M, Hammarlund-Udenaes M. Pharmacokinetic–pharmacodynamic modelling of morphine transport across the blood–brain barrier as a cause of the antinociceptive effect delay in rats – a microdialysis study. Pharm Res. 2000;17:1220–7. doi: 10.1023/a:1026414713509. [DOI] [PubMed] [Google Scholar]
- 19.Wandel C, Kim R, Wood M, Wood A. Interaction of morphine, fentanyl, sufentanil, alfentanil, and loperamide with the efflux drug transporter P-glycoprotein. Anesthesiology. 2002;96:913–20. doi: 10.1097/00000542-200204000-00019. [DOI] [PubMed] [Google Scholar]
- 20.Bungay PM, Morrison PF, Dedrick RL. Steady-state theory for quantitative microdialysis of solutes and water in vivo and in vitro. Life Sci. 1990;46:105–19. doi: 10.1016/0024-3205(90)90043-q. [DOI] [PubMed] [Google Scholar]
- 21.Chen KC, Hoistad M, Kehr J, Fuxe K, Nicholson C. Theory relating in vitro and in vivo microdialysis with one or two probes. J Neurochem. 2002;81:108–21. doi: 10.1046/j.1471-4159.2002.00793.x. [DOI] [PubMed] [Google Scholar]
- 22.Osborne R, Joel S, Trew D, Slevin M. Morphine and metabolite behavior after different routes of morphine administration: demonstration of the importance of the active metabolite morphine-6-glucuronide. Clin Pharmacol Ther. 1990;47:12–19. doi: 10.1038/clpt.1990.2. [DOI] [PubMed] [Google Scholar]
- 23.Stoelting RK. Opioid agonists and antagonists. In: Stoelting RK, editor. Pharmacology and Physiology in Anesthetic Practice. Philadelphia: Lippincott-Raven; 1999. pp. 77–113. [Google Scholar]
- 24.Bonica JJ, Teitz CC. Pain due to musculoskeletal injuries. In: Bonica JJ, editor. The Management of Pain. 2. London: Lea & Febiger; 1990. pp. 368–87. [Google Scholar]
- 25.van den Nieuwenhuyzen MC, Engbers FH, Vuyk J, Burm AG. Target-controlled infusion systems: role in anaesthesia and analgesia. Clin Pharmacokinet. 2000;38:181–90. doi: 10.2165/00003088-200038020-00003. [DOI] [PubMed] [Google Scholar]


