Abstract
Aims
We have compared the ability of plethysmography (sGaw), impulse oscillometry (IOS) and spirometry (FEV1, MMEF) to detect bronchodilation in response to an anticholinergic.
Methods
IOS (R5, R20, X5, RF), sGaw and spirometry were measured in 12 healthy subjects and 12 asthmatics. Variability was assessed by performing two measurements, 30 min apart and the effect of increasing the number of readings for each sGaw measurement was also studied. Ipratropium bromide (IB) 10, 20, 100 and 200 µg was administered and the sensitivity of the methods compared by determining the lowest dose that caused changes greater than variability.
Results
In healthy subjects significant changes (P ≤ 0.05) occurred at 10 µg for FEV1 (mean [95% Cl]; 1.3% [0.3–2.3]), R5 (mean [95% Cl]; −7.9%, [−13.2–2.6]) and R20 (mean [95% Cl], −6.4%, [−11.4–1.4]). No significant change was detected when the mean of 3 sGaw readings was used, but with 10 readings significant change was observed at 20 µg; (mean increase [95% Cl] 15.2% [8.3–22.1]). In asthmatics significant changes (P ≤ 0.05) occurred with IB 10 µg for sGaw (mean [95% Cl] 25.6% [11.1–40.1]), R5 (mean [95% Cl]−11.3%, [−15.5–7.2]), RF (mean [95% Cl] 11.7% [6.1–16.3]), FEV1 (mean [95% Cl] 5.1% [2.6–7.7]) and MMEF (mean [95% Cl] 12.3% [2.3–22.2]).
Conclusion
IOS and spirometry are more sensitive than sGaw in healthy subjects, but the sensitivity of sGaw improved when the number of readings was increased. The most sensitive method for assessing bronchodilation in asthmatics was sGaw.
Keywords: oscillometry, ipratropium, asthma
Introduction
Clinical studies investigating the pharmacological effects of bronchodilator drugs for the treatment of asthma may be performed in healthy subjects as well as patients [1]. While spirometry is commonly used to assess bronchodilation in such studies, we have demonstrated that alternative techniques such as body plethysmography and impulse oscillometry (IOS) can also measure physiological changes effectively [2]. Furthermore, we have shown the most sensitive method for detecting the bronchodilator effect of salbutamol in healthy subjects (spirometry) was different to that in mild asthma (body plethysmography) [2].
The usefulness of body plethysmography in clinical trials is limited by its variability. It has been suggested that increasing the number of readings made for each measurement could reduce the variability [3]. The mean of three readings is usually recorded at each measurement. We have investigated whether increasing the number of readings to 10 would reduce variability of the measurement.
We have performed a study in healthy subjects and asthmatics with a similar design to our previous report, which compared the ability of spirometry, IOS and body plethysmography to detect the bronchodilator effects of the beta agonist salbutamol [2]. The aims of the current study were (1) to determine if increasing the number of body plethysmography measurements at each reading reduces method variability and hence increases sensitivity to detect a drug effect and (2) to compare the ability of spirometry, IOS and body plethysmography to measure the bronchodilator effects of a drug with a different mechanism of action to our previous study, namely the anticholinergic ipratropium bromide (IB). This drug is a muscarinic receptor antagonist. Muscarinic receptors are distributed on bronchial smooth muscle cells throughout the bronchial tree [4]. Inhaled IB reduces cholinergic signalling in healthy subjects and asthmatics, thus causing bronchodilation [5].
Methods
Subjects
We studied 24 subjects (demography shown in Table 1); 12 healthy subjects with no significant medical history and taking no medications, and 12 patients with mild asthma (FEV1 >80% predicted). Patients with asthma were diagnosed on clinical history plus historical evidence of typical asthma physiology; either peak expiratory flow variability, FEV1 reversibility >12% or bronchial hyperresponsiveness. Written informed consent was obtained and the local ethics committee approved the study.
Table 1.
Subject demographics
| Healthy volunteers | Mild asthma | |
|---|---|---|
| Age (range)1 | 43 (24–73) | 41 (22–65) |
| Female2 | 8 (66%) | 11 (92%) |
| FEV1% predicted1 | 107 (85–122) | 94 (82–111) |
| Ex smoker3 | 1 (30) | 0 |
| Current smoker3 | 1(3) | 0 |
| Treatment;3 | ||
| None | 12 | 2 |
| BDP dose1 | 0 | 500 (0–1000) |
| Long acting β2 agonist2 | 0 | 3 |
BDP, beclomethasone dipropionate or equivalent.
mean (range);
number of subjects (percent);
number of subjects (mean pack year smoking history in smoking subjects).
Study design
Pulmonary function was assessed by spirometry, plethysmography and IOS (Test 1). This was repeated 30 min later (Test 2). IB was then administered in ascending doses of 10, 20, 100 and 200 µg separated by 30 minute intervals. Pulmonary function was performed 15 min after each dose. Short and long acting bronchodilators were withheld for 6 and 12 h, respectively, prior to study days.
Pulmonary function
Pulmonary function measurements were always performed in the same order; firstly IOS, followed by body plethysmography and then spirometry. The deep inspiration required for spirometry may cause a temporary alteration in bronchial tone [6]. We therefore performed resistance measures prior to spirometry. For IOS (Masterscreen IOS, Erich Jaeger, Hoechberg, Germany) subjects supported their cheeks to reduce upper airway shunting while impulses were applied during tidal breathing for 30 s. R5 and R20 (respiratory resistance at 5 and 20Hz, respectively), X5 (reactance at 5 Hz) and RF (resonant frequency) were recorded. sGaw was measured in a constant volume plethysmograph (Vmax 6200, Sensormedics Corp., Yorba Linda, CA, USA). Maximum expiratory flow volume measurements; FEV1 (volume expired over the first second) and MMEF (maximal mid expiratory flow rate) were performed using the spirometry system on the Masterscreen. A full explanation and training in the performance of each lung function test was given to each subject prior to the study. Three IOS and spirometry readings were recorded at each time-point. The first three technically acceptable spirometry manoeuvres were used. For body plethysmography, the mean of four panting manoeuvres was used to calculate each specific airway conductance (sGaw) reading. Ten consecutive readings were performed at Tests 1 and 2, while six were performed after each dose of IB. All measurements were performed by the same, experienced operator. Ipratropium bromide (Atrovent nebules, 250 µg ml−1, Boehringer Ingelheim, Bracknell, Berkshire, UK) was administered via a dosimeter (Mefar, Medicali, Brescia, Italy) calibrated to deliver 20 µl per inhalation.
Statistical methods
A sample size of 12 subjects per group was chosen as it allows power calculations for future clinical trials of bronchodilator drugs to be performed with 90% power using the within subject standard deviation (SD) observed. These estimates will have at least 73% power if the true within volunteer SD is 25% larger than observed in the present study.
The within test variability was defined as the variation due to the method during three repeated readings at the same time-point. This was assessed by the coefficient of variation (CV; the standard deviation/mean, of the three readings). The mean of these three readings was used for all further analysis. The within subject variation was assessed by comparing Test 1 and 2 (within day variability) using the single determination SD [7] to calculate the CV. To compare the within day variability of three and 10 sGaw readings, the mean difference and 95% confidence interval (CI) between Test 1 and 2 were calculated.
The response to IB was assessed by calculating the percentage change from baseline (i.e. Test 2). For sGaw, this analysis was performed using the first three sGaw readings at Test 2 and after each dose, which has been denoted ‘sGaw 3 tests’. sGaw has also been analysed using all 10 readings at Test 2 and the 6 readings after each dose, which has been denoted ‘sGaw 10/6 tests’. The physiological changes observed for all measurements were compared with within day variability (i.e. the percentage difference between Test 1 and 2) using a paired Students' t-test. This allowed significant physiological changes greater than within day variability to be identified. The most sensitive measurement was determined by the dose of IB at which a significant change occurred. In addition, the mean (95% CI) of the difference at this dose was calculated. For clarity, the dose levels that caused significant changes are presented. However, in this cumulative dose study, prior doses will have caused a carry-over effect, e.g. at the 100 µg dose level the cumulative dose is 130 µg.
Results
Variability
FEV1 was the least variable measurement in both groups. The most variable measurements were sGaw and X5 in both healthy subjects and asthmatics. For some measurements, within day variability was greater than within test variability, e.g. RF, MMEF and sGaw in healthy volunteers, and X5 in asthmatics (Table 2).
Table 2.
Variability of plethysmography, IOS and spirometry
| Coefficient of variation (%) | ||||
|---|---|---|---|---|
| Test 1 Mean(SD) | Test 2 Mean(SD) | Within test | Within Day | |
| (a) Healthy volunteers | ||||
| sGaw | 2.17 | 2.17 | 6.03 | 13.76 |
| s−1 kPa−1 | (0.44) | (0.41) | ||
| R5 | 0.31 | 0.33 | 6.96 | 5.97 |
| kPaL−1.s | (0.13) | (0.13) | ||
| R20 | 0.3 | 0.31 | 6.48 | 7.38 |
| kPaL−1.s | (0.13) | (0.11) | ||
| X5 | 0.11 | 0.12 | 8.67 | 14.70 |
| kPaL−1.s | (0.04) | (0.05) | ||
| RF | 10.23 | 10.27 | 4.86 | 12.05 |
| Hz | (1.53) | (2.75) | ||
| FEV1 | 3.26 | 3.29 | 1.66 | 1.25 |
| L | (0.42) | (0.42) | ||
| MMEF | 2.99 | 3.07 | 2.99 | 8.88 |
| l−1 | (0.85) | (0.76) | ||
| (b) Mild asthma | ||||
| sGaw | 1.49 | 1.47 | 11.32 | 12.89 |
| s−1 kPa−1 | (0.61) | (0.59) | ||
| R5 | 0.52 | 0.50 | 5.05 | 7.65 |
| kPaL−1.s | (0.2) | (0.17) | ||
| R20 | 0.42 | 0.4 | 4.17 | 2.48 |
| kPaL−1.s | (0.13) | (0.10) | ||
| X5 | 0.18 | 0.16 | 10.45 | 19.52 |
| kPaL−1.s | (0.12) | (0.08) | ||
| RF | 16.57 | 16.04 | 7.22 | 5.05 |
| Hz | (7.11) | (7.18) | ||
| FEV1 | 2.71 | 2.70 | 2.16 | 2.33 |
| L | (0.89) | (0.89) | ||
| MMEF | 1.90 | 1.94 | 8.00 | 6.28 |
| l−1 | (1.06) | (1.07) | ||
The effect of increasing the number of readings on sGaw variability
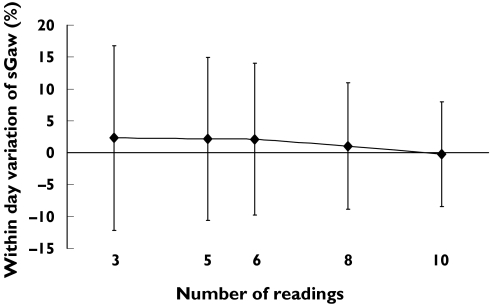
In healthy subjects, increasing the number of readings caused a reduction in within day variability of sGaw; using three readings gave a mean (95% CI) within day difference of 2.3% (−12.2–16.8). In contrast, using 10 readings gave a lower mean (95% CI) within day difference of −0.2% (−8.4–8.0) (Figure 1). This reduction in variability was also observed in asthmatics, but the size of the effect was less; the mean (95% CI) for the within day difference was −0.8% (−8.6–7.0) and −0.4% (−6.6–5.8) for three and 10 readings, respectively.
Figure 1.
Mean (%) within day difference (error bars = 95% CI) in healthy subjects related to number of sGaw readings analysed
Measurement of the dose–response effects of ipratropium bromide
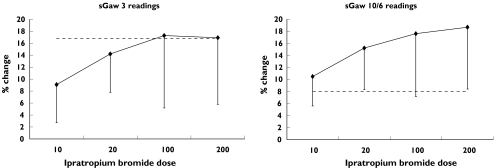
In healthy subjects, FEV1 and IOS resistance parameters (R5 and R20) were able to detect significant bronchodilation after 10 µg IB (Table 3). At this dose, the mean (95% CI) difference between the effect of IB and within day variability for R5 and R20 was greater than for FEV1 (see Table 4). MMEF demonstrated a significant change at 20 µg but the IOS reactance measurements X5 and RF did not change significantly. sGaw measurements obtained by three readings were also unable to demonstrate bronchodilator effects in excess of method variability at any dose, despite an increase in conductance of over 17% (see Figure 2A). However, increasing the number of readings reduced variability so that sGaw detected significant physiological effects after the 20 µg dose (see Figure 2B).
Table 3.
Ipratropium bromide dose–response.
| Dose (mcg) | 10% change(95% CI) | 20% change(95% CI) | 100% change(95% CI) | 200% change(95% CI) | Within day change (%)mean(95% CI) |
|---|---|---|---|---|---|
| (a) Healthy subjects | |||||
| sGaw 3 | 9.1 | 14.2 | 17.3 | 16.9 | 2.3 |
| (2.7–15.5) | (7.8–20.6) | (5.2–29.4) | (5.8–28) | (−12.2–16.8) | |
| sGaw 10/6 | 10.5 | 15.2* | 17.6* | 18.7* | −0.23 |
| (5.6–14.9) | (8.3–22.1) | (7.2–28) | (8.4–29.0) | (−8.4–8) | |
| R5 | −7.9** | −7.6* | −13* | −9.5 | 7.0 |
| (−13.2–2.6) | (−13.7–0.5) | (−22.8–3.2) | (−22.5–3.5) | (1.9–12.1) | |
| R20 | −6.4* | −6.7* | −12.0* | −10.4 | 6.0 |
| (−11.4–1.4) | (−14.0–0.6) | (−20.9–3.1) | (−23.1–2.3) | (−1.1–11.9) | |
| X5 | −8.1 | −12.8 | −13.9 | −11.2 | −0.4 |
| (−13.7–2.5) | (−19.9–5.7) | (−22.4–5.4) | (−18.7–3.7) | (−9.7–8.9) | |
| RF | 5.2 | 7.4 | 7.3 | 2.3 | −0.2 |
| (1.5–8.9) | (1.3–13.5) | (0.2–14.4) | (−6.4–11.0) | (−7.8–7.4) | |
| FEV1 | 1.3* | 2.6** | 3.3** | 4.3** | 0.7 |
| (0.3–2.3) | (1.1–4.1) | (1.2–5.4) | (2.1–6.5) | (−0.4–1.8) | |
| MMEF | 3.3 | 11.0** | 14.2*** | 18.5*** | 4.4 |
| (−3.8–10.4) | (3.1–18.9) | (5.5–22.9) | (11.6–25.4) | (−3.3–12.1) | |
| (b) Mild asthma | |||||
| sGaw 3 | 25.6** | 44.8** | 38.3** | 45.0* | −0.8 |
| (11.1–40.1) | (19.4–70.1) | (17.9–58.6) | (19.5–70.5) | (−8.6–7.0) | |
| sGaw 10/6 | 22.4** | 41.7** | 35.5** | 40.5* | −0.4 |
| (11.8–33.0) | (20.2–63.2) | (14.0–56.9) | (15.3–65.6) | (−6.6–5.8) | |
| R5 | −11.3* | −18.9** | −19.2** | −20.1** | −3.0 |
| (−15.5–7.2) | (−24.3–13.6) | (−26.1–12.3) | (−26.7–13.4) | (−8.7–2.7) | |
| R20 | −6.9 | −13.6* | −14.3* | −15.1* | −0.9 |
| (−11.2–2.6) | (−17.3–9.9) | (−20.3–8.3) | (−20.6–9.6) | (−8.1–6.2) | |
| X5 | −12.4 | −16.7 | −17.7 | −18.8 | −12.3 |
| (−18.5–6.3) | (−25.6–7.9) | (−30.7–4.7) | (−29.6–7.9) | (−19.8–4.9) | |
| RF | 11.7* | 16.6* | 17.8* | 19.2* | −3.7 |
| (6.1–16.3) | (9.5–23.8) | (9.3–26.4) | (10.1–28.3) | (−8.3–1.0) | |
| FEV1 | 5.1* | 8.4* | 10.0* | 8.4* | −0.3 |
| (2.7–7.6) | (5.0–11.9) | (6.1–14.0) | (4.5–12.4) | (−2.2–1.5) | |
| MMEF | 12.3* | 27.6*** | 29.8*** | 32.1*** | 3.2 |
| (2.3–22.2) | (16.2–38.9) | (19.1–40.5) | (22.7–41.4) | (−1.8–8.1) | |
Data is mean percentage change from baseline (95% confidence interval). Significant changes compared to variability are denoted by:
P ≤ 0.05;
P ≤ 0.01;
P ≤ 0.001.
Table 4.
Mean change in pulmonary function tests detecting significant effects after ipratropium bromide 10 µg
| Mean (95% CI) difference | P-value | |
|---|---|---|
| (a) Healthy subjects | ||
| R5 | 14.9% (6.9–22.8) | 0.004 |
| R20 | 12.4% (3.5–21.3) | 0.020 |
| FEV1 | 2.0% (0.49–3.4) | 0.024 |
| (b) Mild asthma | ||
| sGaw 3 | 26.4 (11.2–41.6) | 0.006 |
| sGaw 10/6 | 22.8 (10.3–35.3) | 0.004 |
| MMEF | 15.4 (5.7–25.2) | 0.010 |
| R5 | 8.4 (2.3–14.4) | 0.020 |
| FEV1 | 4.8 (1.3–8.4) | 0.021 |
| RF | 8.0 (1.3–14.8) | 0.040 |
Mean percentage difference (95% CI) refers to the difference between within day variability and changes after 10 µg of ipratropium bromide.
Figure 2.
Comparison of the change in sGaw post ipratropium bromide with within day variability in healthy subjects.Dashed line = upper 95% CI for within day variabilityDiamonds = mean % change in sGaw (error bars = lower 95% CI)
In asthma patients, sGaw, FEV1, MMEF, R5 and RF were able to detect significant bronchodilation after 10 µg. At this dose the percentage change in sGaw was greater than FEV1 (see Table 4). In contrast, the percent changes of the IOS parameters were not significantly different from those of FEV1 after 10 µg. This suggests that sGaw is the most sensitive measurement in this group. For sGaw, there was no difference in sensitivity when the number of readings was increased.
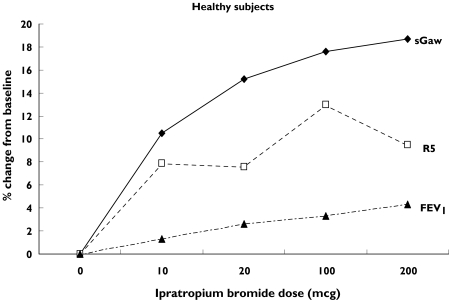
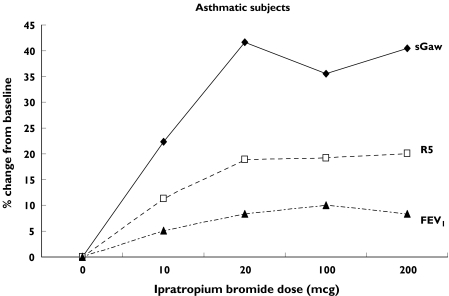
Figure 3 shows the gradient of the changes in sGaw, R5 and FEV1. In both healthy subjects and asthmatics there was a steep rise in sGaw and R5 at the lowest dose of IB whereas FEV1 had a more gradual increase over the dose–response range.
Figure 3.
Changes in sGaw, R5 and FEV1 after increasing doses of ipratopium bromide. Mean (%) change from baseline
Discussion
Our main findings were that the most sensitive measurements for detecting the effects of IB were R5, R20 and FEV1 in healthy subjects. In asthmatics the most sensitive measurements were sGaw, R5, RF, FEV1 and MMEF, with sGaw demonstrating the greatest magnitude of change. The variability of sGaw was reduced in both healthy and asthmatic subjects when the number of readings was increased, and this improved its sensitivity in measuring bronchodilation in healthy subjects.
The assessment of the variability of the pulmonary function methods produced similar results to our previous report and other studies; namely that plethysmography and IOS are more variable than FEV1 [2, 8, 9]. In an attempt to reduce sGaw variability, we increased the number of readings at each measurement. Other studies have suggested that this strategy may be effective [3, 10], although its impact on the ability to measure bronchodilation has not previously been reported. We found that increasing the number of sGaw readings did reduce variability, which in healthy subjects resulted in improved method sensitivity to detect anticholinergic effects. However, the reduction in variability in asthmatics was small relative to the bronchodilator effect, and did not change the sensitivity to detect drug effects.
In healthy subjects the most sensitive measurements for detecting the bronchodilator effect of IB were R5, R20 and FEV1, with all three measurements detecting significant changes after 10 µg IB. In our previous study with salbutamol, FEV1 was the more sensitive measurement because IOS resistance measurements had greater variability than FEV1 [2]. Taken together, the results of the current study and our previous report indicate that IOS resistance parameters do have the potential for assessing bronchodilator effects in healthy subjects, but that their usefulness is affected by variability [2]. In contrast, because of its low variability, FEV1 appears to be a robust method for assessing bronchodilators in healthy subjects.
In asthma, sGaw was a sensitive measurement for detecting the bronchodilator effect of IB. This was also seen in our previous study using salbutamol [2]. Body plethysmography therefore appears to be a more useful method for measuring pharmacological effects in asthmatics compared with healthy volunteers. This can be explained by the greater change in airway conductance, relative to method variability, after a small dose of a bronchodilator in asthmatics compared with healthy subjects. Body plethysmography is not widely used in clinical trials, usually due to issues of cost and staff training [1]. However, our studies indicate that it is the optimum technique for assessing pharmacological effects in asthmatics. Three readings are adequate to detect changes above variability in asthmatics and we recommend its use more often in clinical trials. Its use would allow detection of small bronchodilator effects in fewer patients, i.e. the power of the study would increase substantially. In studies involving healthy subjects it is not such a useful technique, as a greater number of readings are required which increases the duration of the measurement. Our results require confirmation in a double-blind placebo-controlled trial.
IOS and spirometry were both able to detect the effects of 10 µg IB in asthmatics. R5 was able to detect significant changes, confirming our previous finding that this measurement is a useful alternative to MMEF for assessing the modulation of small airway function in asthma. In contrast to the findings in the healthy subjects, the reactance measurement RF was able to detect pharmacological changes in asthmatics. The usefulness of this measurement in asthma, but not healthy subjects, is similar to our previous findings with salbutamol and those of Wessling et al. using IB [2, 11].
RF is the frequency at which respiratory compliance and inertiance are of equal and opposite magnitude. This occurs at a higher frequency when respiratory compliance is reduced [12]. It has been suggested that changes in pulmonary reactance at frequencies up to and including RF may be due to bronchodilation of peripheral airways [13, 14], which is associated with improved pulmonary compliance [15]. It is possible that the changes in RF that we have observed in asthmatics are due to bronchodilation of peripheral airways, which results in improved pulmonary compliance.
In conclusion, we have demonstrated that IOS and body plethysmography can be used for measuring anticholinergic effects in healthy subjects, but that their use is affected by variability. FEV1 is less variable and can detect small physiological changes. In patients with asthma, sGaw is the most sensitive method for detecting bronchodilation with an anticholinergic drug. The data from this study can be used to design and power future clinical trials of anticholinergic drugs in healthy subjects and asthmatics.
References
- 1.Morice AH, Waterhouse JC, Peers EM, Parry-Billings M. Use of whole body plethysmography to compare bronchodilator inhaler efficacy. Respiration. 1998;65:120–4. doi: 10.1159/000029242. [DOI] [PubMed] [Google Scholar]
- 2.Houghton CM, Woodcock AA, Singh D. A comparison of lung function methods for assessing dose–response effects of salbutamol. Br J Clin Pharmacol. 2004;58(2):134–41. doi: 10.1111/j.1365-2125.2004.02105.x. [DOI] [PMC free article] [PubMed] [Google Scholar]
- 3.Tattersfield AE, Keeping IM. Assessing change in airway calibre – measurement of airway resistance. Br J Clin Pharmacol. 1979;8:307–19. doi: 10.1111/j.1365-2125.1979.tb04711.x. [DOI] [PMC free article] [PubMed] [Google Scholar]
- 4.Barnes PJ. Muscarinic receptor subtypes: implications for lung disease. Thorax. 1989;44:161–7. doi: 10.1136/thx.44.3.161. [DOI] [PMC free article] [PubMed] [Google Scholar]
- 5.Pride NB. Physiology of the lungs in asthma. Clin Rev Allergy. 1985;3:379–93. [PubMed] [Google Scholar]
- 6.Pellegrino R, Sterk PJ, Sont JK, Brusasco V. Assessing the effect of deep inhalation on airway calibre. a novel approach to lung function in bronchial asthma and COPD. Eur Respir J. 1998;12:1219–27. doi: 10.1183/0903.1936.98.12051219. [DOI] [PubMed] [Google Scholar]
- 7.Chinn S. Repeatability and method comparison. Thorax. 1991;46:454–6. doi: 10.1136/thx.46.6.454. [DOI] [PMC free article] [PubMed] [Google Scholar]
- 8.Kastelik JA, Aziz I, Ojoo JC, et al. Evaluation of impulse oscillation system: comparison with forced oscillation technique and body plethysmography. Eur Respir J. 2002;19:1214. doi: 10.1183/09031936.02.01922001. [DOI] [PubMed] [Google Scholar]
- 9.Goldman MD, Carter R, Klein R, Fritz G, Carter B, Pachucki P. Within- and between-day variability of respiratory impedance, using impulse oscillometry in adolescent asthmatics. Pediatr Pulomonol. 2002;34:312–9. doi: 10.1002/ppul.10168. [DOI] [PubMed] [Google Scholar]
- 10.Nield JE, Twort CHC, Chinn S, et al. The repeatability and validity of respiratory resistance measured by the forced oscillation technique. Respir Med. 1989;83:111–8. doi: 10.1016/s0954-6111(89)80224-0. [DOI] [PubMed] [Google Scholar]
- 11.Wessling GJ, Vonk JM, Greve LH, Wouters EFM. Dose effects of inhaled ipratropium bromide on the impedance of the respiratory system in normal subjects. Int J Clin Pharmacol Ther Toxicol. 1990;28:33–8. [PubMed] [Google Scholar]
- 12.McCleod D, Birch M. Respiratory input impedance: forced oscillation methods. Med Biol Eng Comput. 2001;39:505–16. doi: 10.1007/BF02345140. [DOI] [PubMed] [Google Scholar]
- 13.Bouaziz N, Beyaert C, Gauthier R, et al. Respiratory system reactance as an indicator of the intrathoracic airway response to methacholine in children. Pediatr Pulmonol. 1996;22:7–13. doi: 10.1002/(SICI)1099-0496(199607)22:1<7::AID-PPUL2>3.0.CO;2-P. [DOI] [PubMed] [Google Scholar]
- 14.Goldman MD. Clinical Application of Forced Oscillation. Pulm Pharm Ther. 2001;14:341–50. doi: 10.1006/pupt.2001.0310. [DOI] [PubMed] [Google Scholar]
- 15.Kaczka DW, Ingenito EP, Israel E, et al. Airway and lung tissue mechanics in asthma (Effects of albuterol) Am J Respir Crit Care Med. 1999;159:169–78. doi: 10.1164/ajrccm.159.1.9709109. [DOI] [PubMed] [Google Scholar]


