

Abstract
Aims
To describe the pharmacokinetics of nelfinavir and its main metabolite M8 in HIV-infected patients with a sustained virological response, to characterize the effect of covariates and to estimate inter- and intra-individual variability in the pharmacokinetics.
Methods
Three hundred and twenty concentrations of both nelfinavir and M8 were measured in 46 patients enrolled in the COPHAR 1-ANRS 102 study. Blood samples were taken at a first visit (one sample before drug administration and four samples at fixed times after) and at a second visit 1 to 3 months later (one before and one 3 h after drug administration). The data from both visits on nelfinavir and M8 were modelled jointly in all patients using a population approach.
Results
A one-compartment model with first-order absorption and elimination best described nelfinavir data, with an additional compartment incorporating a first order rate-constant describing the metabolism of the drug to M8. For nelfinavir, the apparent volume of distribution (V/F) (95% confidence interval for the mean), was 309 l (185, 516), the absorption rate constant (ka) was 0.4 h−1 (0.2, 0.8), and the apparent clearance (CL/F) was 37.3 l h−1 (32, 44). For M8, Vm/(Fkm) and CLm/(Fkm) were 866 l h−1 (351, 2161) and 1670 l (965, 2894), respectively. The interindividual variabilities were 34.9%, 34.3% and 62.2% for V/F, CL/F and CLm/(Fkm), respectively. The interoccasion variability was 27.8% for CL/F. The mean half-lives were 05.38 h and 00.44 h for nelfinavir and M8, respectively. Significant but opposite effects of comedication with zidovudine were found on nelfinavir CL/F and M8 CLm/(Fkm), but they were not considered to be clinically relevant.
Conclusions
A joint model was found to describe adequately nelfinavir and M8 concentrations and was used to estimate pharmacokinetic parameters for M8. The model can be used to build reference pharmacokinetic profiles for therapeutic drug monitoring of the drug.
Keywords: joint model, metabolite, nelfinavir, population pharmacokinetics
Introduction
Nelfinavir mesylate (AG1343) is a commonly used HIV protease inhibitor (PI). Approximately half the drug is metabolized by cytochrome P450 2C19 to nelfinavir hydroxy-tert-butylamide (AG1402, or M8) [1, 2], whose antiviral activity is similar to that of the parent drug [3]. When taken with food, the bioavailability of nelfinavir is between 70 and 80%[4]. No first-pass metabolism has been reported for this drug. The three major issues regarding PI-containing regimens are virological failure, toxicity and drug–drug interactions [4]. It has recently been shown that low trough nelfinavir concentrations lead to an increased risk of virological failure [5, 6]. Thus, identification of sources of variability in nelfinavir pharmacokinetics in patients is necessary to optimize therapy with this drug. Therapeutic drug monitoring (TDM) of protease inhibitors is increasingly used to maintain concentrations within a therapeutic range [7, 8]. For instance, the ATHENA study recently showed a significantly higher rate of virological success (i.e. a viral load lower than 500 copies ml−1) in a group of patients undergoing TDM after 12 months of follow-up [9]. The therapeutic range was based on reference pharmacokinetic data.
Only one population pharmacokinetic study of nelfinavir has been published [10]. The data consisted of 509 steady-state plasma concentrations obtained from 174 patients who were taking part in a phase III study. A one-compartment model with first-order absorption and elimination was fitted to the data using NONMEM, resulting in the following parameter estimates (interpatient variability expressed as CV%): 44.9 l h−1 for the apparent elimination clearance CL/F, 769 l (53%) for the apparent volume V/F and 1.34 h−1 for the absorption rate constant ka. The authors reported difficulties in estimating V/F and ka.
Very few pharmacokinetic data are available for the metabolite M8. Baede-van Dijk et al.[11] analyzed separately nelfinavir and M8 concentrations obtained retrospectively from TDM concentration data from 355 patients taking 1250 mg twice daily, and assuming that M8 was orally administered. A one-compartment model was fitted to the median concentrations at each 30 min interval from 0 to 12 h. The estimated AUC(0,12 h) was 24000 ng ml−1 h and 7600 ng ml−1 h for nelfinavir and M8. The corresponding estimated apparent half-lives were 4.1 h and 4.3 h for nelfinavir and M8, respectively. However, no joint pharmacokinetic modelling of the two drugs has been published, which is the only way to estimate the true parameters for M8, especially its half-life.
The aim of this work was to determine the pharmacokinetic parameters for nelfinavir and M8 from a joint population model in patients treated with a stable antiretroviral regimen and with a sustained virological response (i.e. a viral load lower than 200 copies ml−1 for at least 4 months). The stability of both treatment and response in those patients implies that their PI concentrations could be used to build reference pharmacokinetic profiles and reference concentrations useful for TDM. We also aimed to determine the influence of patient characteristics and comedications on the pharmacokinetics of nelfinavir and M8 and to estimate the inter- and intrapatient variability on the latter.
Methods
Study patients
The COPHAR1-ANRS 102 study was an open, multicentre, prospective trial of HIV-infected adults treated with an antiretroviral combination of at least three drugs containing either indinavir or nelfinavir. Data obtained from the nelfinavir group were analyzed in the present work. To be eligible, patients had to be treated with the same antiretroviral treatment for at least 4 months and to have a sustained virological response defined by a plasma HIV RNA concentration below 200 copies ml−1 again for at least 4 months. The most frequent regimens for nelfinavir were 1250 mg twice daily and 800 mg three times daily.
The main exclusion criteria were concomitant use of drugs interacting with nelfinavir such as rifampicin or itraconazole, renal failure (defined by a serum creatinine concentration greater than 180 µmol l−1), hepatic dysfunction (defined by a prothrombin test below 50% or the presence of cirrhosis), pregnancy, ongoing acute opportunistic infection or cancer.
The Ethical Review Committee of the Bicêtre Hospital, Paris, France reviewed and approved the study protocol. All participants provided written informed consent. Inclusion criteria were assessed at a prestudy visit (V0). One month later, that is after at least 5 months of treatment, patients underwent blood sampling for a period of 6 h (visit 1 – V1). Three months later at visit 2 (V2), that is after at least 8 months of treatment, two additional plasma samples were collected. Four months later at visit 3 (V3), final clinical, immunological and virological data were collected.
Adherence to therapy was evaluated using a validated auto-questionnaire and applying the algorithm proposed by Spire et al.[12]. Patients were classified as completely adherent if they reported taking 100% of their prescribed regimen in the last 5 days, moderately adherent if they reported missing no more than 20% of their treatment, and nonadherent if they reported taking less than 80% of their treatment.
Blood sampling
At V1 and V2, a trough sample was collected in the morning at 12 ± 2 h for twice daily dosing or 8 ± 2 h for three times daily dosing after the last drug administration. Nelfinavir was then given with a light meal. At V1, plasma samples were collected at 0.5 h, 1, 3 and 6 h after drug intake, and at V2, 3 h after drug intake. An accurate dosing history was not recorded, and only the time of the morning dose and that of the previous evening dose, as reported by the patient, were available. Exact sampling times were taken for those scheduled at 0.5, 1, 3 and 6 h after the morning dose. For trough samples, the time (ttrough) since the last dose was estimated from the time of the previous dose, and the time of the first sample on the following morning. For modelling, we assumed that all samples were taken after drug intake, the last one being taken ttrough h after the morning dose. We also assumed that patients were at steady-state until V1 with a dosing interval τ of 8 or 12 h for twice daily and three times daily regimens, respectively. As ttrough was often shorter than τ, we assumed further that, on the day of V1, no dose was taken at τ after the morning dose.
Drug and metabolite analysis
Both nelfinavir and M8 concentrations were measured in plasma by one of 12 laboratories. The method of analysis was validated by a blind external quality control [14]. Plasma concentrations of nelfinavir and its metabolite M8 were determined by high-performance liquid chromatography assays with ultraviolet-photodiode array or spectrofluorometric detection [15–19]. In brief, PIs were isolated from alkaline plasma samples by double-step liquid-liquid extraction or by solid-liquid extraction. Dry extracts were injected onto a C18 reversed phase column. Interlaboratory quality control results at three concentrations (250, 1000 and 2500 ng ml−1 for nelfinavir and 150, 250 and 100 ng ml−1 for M8) were within 15% of the target values for medium and high values and within 20% for low values. Lower limits of quantification (LOQ) were 25–100 ng ml−1 for both nelfinavir and M8 depending on the method used.
Population pharmacokinetic model
As suggested by previous analysis, we used a one-compartment model with first-order absorption to describe nelfinavir concentrations [10]. A compartment for M8 was added, which was linked to the nelfinavir compartment with a first-order rate constant km(Figure 1), as it was assumed that there is no first-pass effect. The parameters of this model are F, the bioavailability, the volumes of distribution of nelfinavir and M8 (V and Vm), the first-order absorption rate constant for nelfinavir (ka), the elimination rate constant for nelfinavir ke, the metabolic rate constant km describing the conversion of nelfinavir to M8, and the elimination rate constant for M8 (kem). Since the two differential equations defined by this model are linear, the corresponding system has an analytical solution, as shown for example by Mentréet al. for the population analysis of zidovudine and its glucuronide metabolite in patients [22]. The equations of this model after a single administration are:
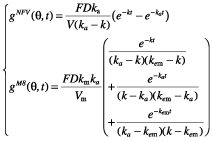 |
where gNFV is for nelfinavir and gM8 is for M8, and k = ke + km. Since nelfinavir was orally administered, only ka, V/F and k were identifiable. For M8, since no urinary concentration data were available, and because no literature data were used, only Vm/(Fkm) and kem could be determined. We chose to estimate clearance rather than elimination rate constant. Therefore, the model was reparametrized using the clearance of nelfinavir, CL = kV, and of M8, CLm = kemVm, respectively. The vector of identifiable parameters used in the population analysis was therefore ka, CL/F, V/F, CLm/(Fkm) and Vm/(Fkm). From single dose equations, we derived equations at steady state, using a dosing interval τ of 8 or 12 h for three times a day and twice daily regimens until V1. The equations used to fit the model to the data were:
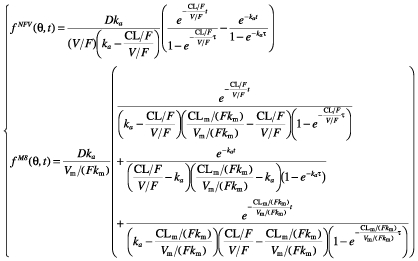 |
where fNFV is for nelfinavir and fM8 is for M8.
Figure 1.

The pharmacokinetic model for nelfinavir and M8. D: the dose of nelfinavir per intake; F: the bioavailability of nelfinavir; ka: the first-order absorption rate constant for nelfinavir; km: the first-order metabolic rate constant; ke: the elimination rate constant for nelfinavir; V: the volume of distribution of nelfinavir; Vm: the volume of distribution of M8; kem: the elimination rate constant for M8
The fraction fm = km/k of nelfinavir metabolized to M8 does not appear explicitly in these equations and is not identifiable [20, 21]. The model could be reparameterized using fm, the corresponding identifiable parameters for M8 being Vm/(Fkm) and kem.
The corresponding statistical model for the observed untransformed concentration  , with l = NFV for nelfinavir and l = 2 for M8, of patient i at the sampling time ti,j is:
where θi is the vector of the logarithm of all the PK parameters of patient i, and  is the residual error for nelfinavir (l = NFV) or M8 (l = M8).
We assumed that the errors given θi are independent and normally distributed with a null mean and an heteroscedastic variance  , which was modelled using a combined proportional and additive error model:
where al is a parameter of the error model that has to be estimated. This combined error model (additive and proportional) is commonly used in population pharmacokinetics. For high concentrations, variance becomes proportional to the concentration squared, whereas for low concentrations, the variance becomes proportional to (al)2. When nelfinavir or M8 concentrations were below the LOQ, we set them to half of the LOQ of the corresponding laboratory [23].
When analyzing V1 concentrations only, we assumed that the logarithm of the individual parameters θi are random vectors and that θi can be decomposed as:
where θ is the population mean vector and bi is the random effect of subject i, which is assumed to be normally distributed with zero mean and diagonal variance Ω, and models the interindividual variability (IIV). The standard deviations of the additive random effects on the log transformed pharmacokinetic parameters are then a first order approximation of the coefficient of variation (CV) of the original parameters.
When analyzing both V1 and V2 concentrations, we added another random component  , corresponding to visit k (k = 1, 2), to θi in order to model, for each subject, the variability between each visit, also called interoccasion variability (IOV). We assumed that is normally distributed with zero mean and diagonal variance ΩIOV. Thus, the total variance of the parameters is decomposed between the interindividual variance Ω and the interoccasion variance ΩIOV. The corresponding model is:
where  is the vector of the parameters of patient i at visit k.
The parameters were estimated using Lindström & Bates’ algorithm implemented in the nlme function of Splus 6.1 software (Insightful, Seattle, Washington) with the Maximum Likelihood option [24, 25]. Since nlme provides the estimates for the standard error (SE) of the population mean parameters estimates  , we derived the corresponding asymptotic 95% confidence intervals from the expression ([ − 1.96SE − + 1.96SE]. Due to the asymptotic nature of these confidence intervals, which for nonlinear models are usually not symmetrical around , we did not derive them for covariate effects.
Modelling strategy
The data for nelfinavir and M8 were modelled jointly in all patients. First, a model was built based on V1 concentrations. We tested whether a lag time of absorption could be introduced, as proposed by other authors [11]. Initially, a combined error model was used where aNFV and σNFV and aM8 and σΜ8 are estimated. We then tried to simplify this error model by estimating a common σ for both compounds, where aNFV and aM8 are still estimated. A homoscedastic error model was also evaluated. Using the best error model, selected using the Akaike criterion (AIC) [13], a model with IIV on all pharmacokinetic parameters was built. The decision on whether each IIV should stay in the model was made using a backward elimination procedure. Goodness-of-fit plots (population and individual predicted concentrations vs. observed concentrations; weighted residuals vs. predicted concentrations and vs. time) were examined for each model, which were also compared using AIC.
From data at V1 and for each pharmacokinetic parameter whose IIV remained within the basic model, we evaluated the effects of the following covariates: age, sex, body weight, co-administration of other antiretroviral drugs and treatment adherence (as a categorical variable). The effect of covariates on the Empirical Bayes estimates of each parameter was tested using the Spearman nonparametric correlation test for continuous covariates and the Wilcoxon test for categorical ones. The population covariate model was then built with the covariates that were found to have a significant effect in this first step (P < 0.05). All population models with all the combinations of these covariates were then evaluated. The combination with the smallest AIC was chosen as the best population covariate model.
Data from V1 and V2 were then analyzed together using the selected population covariate model. We tried to add IOV [26] to each pharmacokinetic parameter, and again used goodness-of-fit plots to assess the reliability of the models and AIC to compare them. From the best model incorporating IOV, a backward elimination procedure was used to test whether all covariates selected for V1 concentrations should remain in the final model containing V1 and V2 concentrations. The likelihood ratio test (LRT) was used to compare the corresponding nested models. If the elimination of a covariate significantly (P < 0.05) decreased the log-likelihood, it was retained in the model.
Model evaluation
Nelfinavir and M8 steady-state concentration profiles were simulated and compared with the observed data to evaluate the predictive performance of the model. More precisely, the vector of the pharmacokinetic parameters from 10 000 patients was simulated using the final model. Each parameter vector was drawn in a normal distribution with a variance composed of the sum of IIV and IOV estimated previously. The covariates included in the final model were simulated using the estimated distribution in the patient sample. A simulated residual error was added to each simulated concentration. We simulated 10 000 concentration profiles from t = 0 to t = 16 h by 1 h increments for the 1250 mg twice daily and 750 mg three times daily regimens. It was assumed that steady-state concentrations were present until V1, and that no additional dose was given on that day. The 10th and 90th percentiles of the simulated concentrations at each time were then overlaid on the observed concentration data at V1 or V2. The adjustment of the percentile curves to the concentrations was then inspected visually. The simulations were performed using Splus 6.1 (Insightful, Seattle, Washington).
Simulation of trough concentrations with the final model
From the final model, we simulated individual steady-state trough concentrations for the two most frequent regimens (1250 mg twice daily and 750 mg three times daily). For each set of typical values of covariates remaining in the final model, concentrations were simulated in 200 patients. Parameters were again drawn from a normal distribution with the total variability as a variance, and steady-state concentrations were predicted without adding residual error. The ranges of the resulting concentrations were plotted to illustrate the clinical relevance of the effect of the covariates in the final model on the experimental trough concentrations (without residual error).
Results
Concentration data were obtained from the 46 patients who received nelfinavir. Twenty-seven were taking 1250 mg twice daily, 16 750 mg three times daily, three patients took 1000 mg, 1125 mg and 1500 mg twice daily, respectively, and two patients took 1000 mg in the morning and 1250 mg in the evening. Patient characteristics at baseline and adherence data at V1 are shown in Table 1. The most frequent comedications were lamivudine (n = 31), stavudine (n = 28), zidovudine (n = 15) and didanosine (n = 15). Only one patient received abacavir. The only non nucleoside reverse transcriptase inhibitor taken with nelfinavir was efavirenz (n = 3).
Table 1.
Patient characteristics at baseline
| Median | [range] | |
|---|---|---|
| Age (years) | 42.7 | [26–66] |
| Weight (kg) | 67.5 | [46–94] |
| Sex (Male/Female) | 41/5 | |
| Time since first ARV treatment (years) | 3.2 | [0.8–11.7] |
| CD4 cell count (mm−3) | 486.5 | [206–1149] |
| Adherence at V1 (High/Moderate /Low)* | 33/10/0 |
Three missing values
Two hundred and twenty-eight concentrations of nelfinavir and M8 (out of an anticipated 230) were obtained at V1 from the 46 patients who received nelfinavir. At V2, 92 concentrations (out of an anticipated 94) were obtained from the same patients.
Individual plasma concentrations of nelfinavir and M8 at both visits are displayed in Figure 2. Only two nelfinavir and one M8 trough concentrations were below the LOQ and set at LOQ/2. Because of the relatively sparse sampling design, a model without a lag time was chosen. First a combined error model with estimations of σNFV, σΜ8, aNFV and aM8 was built, resulting in an AIC of 7154.0. Since the ratio of σ between nelfinavir and M8 was 1.3, i.e. close to 1, we then tested a combined model with the same σ value for both compounds. A smaller AIC (7134.3) was obtained than for the previous model and thus the combined model was selected. The homoscedastic error model achieved a much higher AIC (AIC = 7372.3), and was rejected. The three parameters estimated for the error model were σ, aNFV and aM8. Attempts were made to decrease the number of IIV using a backward procedure based on the AIC. The resulting model included IIV only on V/F, CL/F and CLm/(Fkm), with an AIC of 7131.7. Goodness-of-fit plots (population and individual predicted concentrations vs. observed concentrations; weighted residuals vs. predicted concentrations and vs. time) were satisfactory for both drugs and coefficients of variation (CV) for the mean parameter estimates were all lower than 10%, except for ka (41%).
Figure 2.

Observed plasma concentrations of nelfinavir (top) and M8 (bottom) vs. time at both clinic visits (1 for V1 and 2 for V2)
The influence of covariates was first tested on the Empirical Bayes estimates of the random effects of the basic model. We found a significant effect for zidovudine on CL/F (P = 0.036) and for both zidovudine (P = 0.032) and age (P = 0.042) on CLm/(Fkm). All combinations of these covariates were then successively added to the basic model, and all covariates were retained in the model with the lowest AIC (7123.4). This model had a zidovudine effect on CL/F and CLm/(Fkm), and an age effect (centred on the median age of 42.7 years) on CLm/(Fkm), incorporated as additive effects on the log parameters in the model.
With respect to the error model, the estimate of aNFV in the model with covariates was very low (0.735 ng ml−1). Adjusting this to zero resulted in a model with a lower AIC (7118.2), which was retained for V1 concentration data (Table 2).
Table 2.
Population pharmacokinetic parameters of nelfinavir and M8, 95% confidence interval and coefficient of variation of estimation error
| Compound | Parameters | Estimate | V1 only 95% CI | CV% | Estimate | V1 and V2 95% CI | CV% |
|---|---|---|---|---|---|---|---|
| NFV | ka (h−1) | 0.385 | [0.178, 0.829] | 41.1 | 0.397 | [0.197, 0.800] | 38.7 |
| CL/F (l h−1) | 37.8 | [31.8, 44.8] | 2.4 | 37.3 | [31.9, 43.6] | 2.2 | |
| V/F (l) | 351 | [198, 622] | 5.0 | 309 | [185, 516] | 4.6 | |
| 0.322 | –+ | 46.0 | 0.200 | –+ | 67.4 | ||
| ωCL/F (%) | 43.7 | * | –* | 34.3 | –* | –* | |
| –*** | –*** | –*** | 27.8 | –* | –* | ||
| ωV/ F (%) | 19.1 | –* | –* | 34.9 | –* | –* | |
| aNFV (ng ml−1) | 0** | –*** | –*** | 375 | –* | –* | |
| M8 | CLm/(Fkm) (l) | 2060 | [1113, 3815] | 4.1 | 1670 | [965, 2894] | 3.8 |
| Vm/(Fkm) (l h−1) | 901 | [301, 2710] | 8.3 | 866 | [351, 2161] | 6.9 | |
| −0.715 | –+ | 34.4 | −0.590 | –+ | 39.3 | ||
| 0.0338 | –+ | 33.0 | 0.0276 | –+ | 38.4 | ||
| 68.2 | –* | –* | 62.2 | –* | –* | ||
| aM8 (ng ml−1) | 98.1 | –* | –* | 181 | –* | –* | |
| Both | σ (%) | 40.9 | –* | –* | 35.3 | –* | –* |
Not reported
Not estimated in nlme
Fixed to zero
Not applicable.
Data from V2 were then included in the model (AIC = 10160.5) and the addition of IOV was tested for each parameter. The best model included IOV on CL/F (AIC = 10045.0). The constants aNFV and aM8 from the error model were estimated. A backward selection procedure was performed on the three selected covariates, but the removal of all covariates significantly decreased the log likelihood (P < 10−4 for zidovudine on CL/F, P = 0.02 for zidovudine on CLm/(Fkm) and P = 0.03 for age on CLm/(Fkm)). The corresponding equations of the final model are therefore:
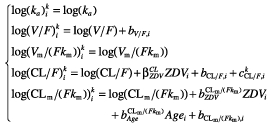 |
where ZDVi equals one for patients taking zidovudine and zero for patients not taking this drug.
The population parameter estimates of this model are reported in Table 2. The nelfinavir (respectively M8) clearance of a patient receiving zidovudine (ZDV) was multiplied by the factor  = 1.22 (respectively
  = 0.554). Each 10 years of age from the median age multiplies the clearance of M8 by
  = 1.32.
The goodness-of-fit plots of this final model with IOV and covariates, displayed in Figure 3 for nelfinavir and in Figure 4 for M8, were considered satisfactory. The model was evaluated by simulation for the two most frequent dosage regimens, 1250 mg twice daily and 750 mg three times daily. In the original sample of patients, age was normally distributed with a mean of 42.4 years and a standard deviation of 10.4 years, and the proportion of patients comedicated with zidovudine was 0.326. Therefore, for each simulated patient, age was drawn in a normal distribution with a mean of 42.4 years and a standard deviation of 10.4 years. Treatment with zidovudine was drawn in a Bernoulli distribution with a probability of being comedicated equal to 0.326. The simulated 10th and 90th percentiles and the medians are displayed for nelfinavir and M8 in Figure 5, and are overlaid with the observed concentrations in patients with the corresponding dosage, irrespective of the values of their covariates. The results of the evaluation of this joint population model for nelfinavir and M8 were considered to be satisfactory for both compounds and for each dosage regimen.
Figure 3.

Goodness of fit plots based on the final model for nelfinavir: population predicted concentrations vs. observed concentrations (A), individual predicted concentrations vs. observed concentrations (B), population weighted residuals vs. observed concentrations (C) and population weighted residuals vs. time (D)
Figure 4.

Goodness of fit plots based on the final model for M8: population predicted concentrations vs. observed concentrations (A), individual predicted concentrations vs. observed concentrations (B), population weighted residuals vs. observed concentrations (C) and population weighted residuals vs. time (D)
Figure 5.

Evaluation of the final model: comparison between the 10th, 50th (in bold) and 90th percentiles obtained from 1000 simulations for patients receiving 1250 mg twice daily (A: nelfinavir, C: M8) and 750 mg three times daily (B: nelfinavir, D: M8) of nelfinavir, and the observed data at V1 and V2 in patients receiving the corresponding dosing regimen
Trough concentrations of nelfinavir and M8 were simulated in the final model in 200 patients with and in 200 patients without comedication with zidovudine, setting age to the median value of 42.7 years. M8 concentrations were simulated in three groups of 200 patients not taking zidovudine and defined by the quartiles of age (32.7, 42.7 and 48.3, respectively). Simulations were performed with two nelfinavir dosing regimens: 1250 mg twice daily and 750 mg three times daily. The data are presented in Figure 6 for the 1250 mg twice daily regimen, which is the most commonly used in clinical practice.
Figure 6.

Box plots of trough nelfinavir (A), M8 (B and D) and the sum of nelfinavir + M8 (C) concentrations simulated from the population model for 1250 mg nelfinavir twice daily according to comedication with zidovudine (A, B and C) or age quartiles (D) (the boxes represent 25th to 75th percentiles, with the median shown within the boxes; capped bars represent 1.5 times the interquartile range)
Comedication with zidovudine decreased nelfinavir concentrations [median (1st−3rd quartiles)] from 1631 ng ml−1 (947–2553) to 1344 ng ml−1 (741–2047) (Figure 6A), and increased those of M8 from 340 ng ml−1 (138–644) to 492 ng ml−1 (232–1067) (Figure 6B).
Comedication with zidovudine resulted in a slight decrease in the sum of trough concentrations of nelfinavir and M8 from 1938 ng ml−1 (1168–3293) to 1928 ng ml−1 (1016–3225) (Figure 6C). When age increased from 32.7 to 48.3 years, M8 concentrations decreased from 488 (196–830) ng ml−1 down to 284 (137–565) (Figure 6D).
From 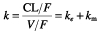 and kem, which population mean values were 0.13 h−1 and 1.57 h−1, respectively, we derived the half-life of nelfinavir, 5.38 h, and of M8, 0.44 h. By definition, the metabolic ratio of nelfinavir is the ratio of the AUC of M8 divided by the AUC of nelfinavir and is equal to
  [21]. It can be written as
  , and therefore as
  . We used the last equation to estimate the metabolic ratio, which was equal to 0.23, from the population parameter estimates. Assuming, as it was reported by Zhang et al.[2], that the fraction fm of nelfinavir metabolized into M8 is 0.5, we derived estimates of Vm/F and CLm/F, which were 56.1 l and 88.2 l h−1, respectively, for a mean value of 0.065 h−1 for km.
Discussion
We have derived the first joint pharmacokinetic model for and performed a simultaneous population analysis on concentration data for nelfinavir and its metabolite M8 from virologically controlled patients at steady-state. The concentrations of both drugs were adequately described by a one-compartment model with first-order absorption and elimination for nelfinavir with an additional compartment for M8. The use of a joint model is the optimum method to obtain accurate pharmacokinetic parameters for M8. A sequential analysis could have been performed, first to estimate the pharmacokinetic parameters for nelfinavir, and using the resulting individual parameters in a second step to estimate those of M8. This method is especially adapted to rich data, which was not the case in the present work, especially for data collected at V2 [27].
We made the assumption that first-pass metabolism of nelfinavir could be ignored since its bioavailability when taken with food, as was the case in the present study, is between 70% and 80%[4]. Because no urinary data were available, not all the parameters could be estimated because the fraction of nelfinavir metabolized to M8 is not known. A possible method for estimating ke, and therefore km, would be to selectively inhibit the formation of M8 [29].
Estimates for nelfinavir clearance (CL/F = 37.3 l h−1) and its interindividual variability (34%) are similar to those of Jackson et al.[10] (CL/F = 44.9 l h−1, CV = 34%). However, we obtained a smaller apparent volume (309 l compared with 769 l) and absorption rate constant (0.40 h−1 compared with 1.34 h−1). Our estimated mean AUC, calculated from the expression D/(CL/F), was 33 245 ng ml−1 h for the 1250 mg twice daily regimen and 21 277 ng ml−1 h for the 750 mg three times daily regimen. The former value is very similar to that found by DiCenzo et al.[30] in naïve patients treated with indinavir plus 1250 mg nelfinavir twice daily (mean AUC of 33 106 ng ml−1 h and 33 269 ng ml−1 h in two groups of nine and seven patients also receiving either 1000 mg twice daily or 1200 mg twice daily of indinavir, respectively). The mean AUC obtained by van-Dijke et al.[11] in patients taking 1250 mg twice daily (24 000 ng ml−1 h) is smaller than these values.
The short half-life of M8 explains the parallel terminal decline of nelfinavir and M8, indicating that the elimination of this metabolite is formation rate-limited.
We decided to test for the inclusion of covariates based on concentration data from V1, first because it produced the richest data set, and second because the covariates were measured at this visit. Regarding the error model, we found aNFV to be equal to zero when modelling concentration data from V1 only, and aNFV = 375 ng ml−1 when modelling the data from both visits. This increase might be due to the high variability in concentrations at V2. However, this value for aNFV is small compared with the nelfinavir concentrations obtained.
We found opposite effects of zidovudine on nelfinavir clearance (CL/F) and CLm/(Fkm), leading to a decrease in the trough concentrations of the drug and to an increase in M8 trough concentrations. The increase in CL/F but not in V/F must be due to a rise in k probably resulting from an increase in km. The effect on CLm/(Fkm) might consequently reflect only the influence of comedication with zidovudine on km and not on M8 clearance per se.
The sum of nelfinavir and M8 trough concentrations was only slightly decreased in patients receiving zidovudine, and therefore a dosage adjustment seems unnecessary. We found no effect of gender on nelfinavir clearance, whereas a decrease in indinavir clearance in women compared to man was observed [31]. The lack of gender difference in nelfinavir clearance might be due to the small number of women in this study (5 out of 46 patients) potentially resulting in a lack of power.
The interindividual and interoccasion variabilities for nelfinavir were relatively small (between 27.8% and 35%) and much lower than those found for indinavir [31]. The variability in M8 apparent clearance (62.2%) was larger. The high apparent variability in the trough concentrations of the drug (Figure 2) might be due to nelfinavir pharmacokinetics being subject to a circadian rhythm [11], which was not accommodated in the model. It also might be due to the assumptions made on the timing of drug intake [32]. Variability in trough concentrations can be decreased by electronic monitoring of dosing history [32]. Part of this variability might also be explained by the polymorphism affecting CYP2C19, a major determinant of the elimination of nelfinavir.
Our data confirm the need for the therapeutic monitoring of nelfinavir. The potential benefit of TDM for protease inhibitors has been shown by the ATHENA study, which is based on a concentration ratio [9]. This is obtained by dividing the observed concentration by the corresponding time-adjusted value obtained from a reference pharmacokinetic profile. The reference curve is based on the fit of a pharmacokinetic model to the median values of concentrations grouped by 30 min time intervals. The concentrations were obtained restrospectively from virologically noncontrolled HIV patients undergoing TDM [11]. The present prospective trial, performed in patients with a sustained virological response, could be used to define more realistic reference concentrations. The reference curve should be derived from the mean population pharmacokinetic parameters using the model at steady state. Furthermore, the population pharmacokinetic parameters obtained in the present study should help to optimize treatment with nelfinavir based on Bayesian therapeutic drug monitoring.
Acknowledgments
This study was financially supported by the Agence Nationale de la Recherche sur le SIDA (ANRS), Paris, France.
We gratefully acknowledge all the members of the scientific committee of the Cophar-1 ANRS-102 trial: Dr V. Calvez (Hôpital Pitié-Salpétrière, Paris), Prof. G. Chêne (INSERM U330, Bordeaux), Prof. B. Diquet (Hôpital Pitié-Salpétrière, Paris), Prof. C. Katlama (Hôpital Pitié-Salpétrière, Paris), Prof. C. Leport (Hôpital Bichat, Paris), Dr A. Metro (ANRS, Paris), Dr G. Peytavin (Hôpital Bichat, Paris), Prof. F. Raffi (Hôpital Hôtel Dieu, Nantes), Dr A. Roux (Hôpital Ambroise Paré, Boulogne), and Prof. D. Salmon-Ceron (Hôpital Cochin, Paris).
We would like to thank the investigators in the clinical centres for including patients: Prof. J.M. Estavoyer, Prof R. Laurent (Besançon), Prof. X. Bazin (Caen), Prof. C. Perrone (Garches), Prof. J.F. Delfraissy (Kremlin Bicêtre), Prof. F. Raffi (Nantes), Prof. E. Bouvet, Prof. F. Bricaire, Prof. S. Herson, Prof. W. Rozenbaum, Prof. D. Séréni, Prof. D. Sicard, Dr A. Simon, Prof. J.L. Vildé (Paris), Prof. X. Lang (Strasbourg), and the pharmacological laboratories for performing drug assays: Dr B. Royer, Dr P. Muret (Besançon), Dr M. Tod (Bobigny), Dr A.M. Taburet (Kremlin Bicêtre), Dr C. Solas (Marseille), Dr D. Hillaire (Montpellier), Dr E. Dailly (Nantes), Prof B. Diquet, Dr G. Peytavin, Dr J.M. Poirier, Dr E. Rey, Dr H. Sauvageon (Paris), Dr J.C. Alvarez (Versailles).
We also thank the patients for their participation.
References
- 1.Khaliq Y, Gallicano K, Seguin I, Fyke K, Carignan G, Bulman D, Badley A, Cameron DW. Single and multiple dose pharmacokinetics of nelfinavir and CYP2C19 activity in human immunodeficiency virus-infected patients with chronic liver disease. Br J Clin Pharmacol. 2000;50:108–15. doi: 10.1046/j.1365-2125.2000.00238.x. [DOI] [PMC free article] [PubMed] [Google Scholar]
- 2.Zhang MH, Pithavala YK, Lee CA, Lillibridge JH, Wu EY, Sandoval TM, Daniels RG, Kerr BM. Apparent genetic polymorphism in nelfinavir metabolism: evaluation of clinical relevance. 12th International Symposium on Microsomes and Drug Oxidations; Montpellier, France. 1998. Abstract 264. [Google Scholar]
- 3.Zhang KE, Wu E, Patick AK, Kerr BM, Zorbas M, Lankford A, Kobayashi T, Maeda Y, Shetty B, Webber S. Circulating metabolites of the human immunodeficiency virus protease inhibitor nelfinavir in humans: structural identification, levels in plasma, and antiviral activities. Antimicrob Agents Chemother. 2001;45:1086–93. doi: 10.1128/AAC.45.4.1086-1093.2001. [DOI] [PMC free article] [PubMed] [Google Scholar]
- 4.Barry M, Mulcahy F, Merry C, Gibbons S, Back D. Pharmacokinetics and potential interactions amongst antiretroviral agents used to treat patients with HIV infection. Clin Pharmacokinet. 1999;36:289–304. doi: 10.2165/00003088-199936040-00004. [DOI] [PubMed] [Google Scholar]
- 5.Burger DM, Hugen PWH, Aarnouste RE, Hoetelmans RMW. Treatment failure of nelfinavir-containing triple therapy can largely be explained by low nelfinavir plasma concentrations. AIDS. 2003;17:1157–65. doi: 10.1097/00007691-200302000-00011. [DOI] [PubMed] [Google Scholar]
- 6.Le Moing V, Peytavin G, Journot V, Cottalorda J, Bouvet E, Chĉne G, Préau M, Merle de Boever C, Leport C, Raffi F the APROCO Cohort Study Group. Plasma levels of indinavir and nelfinavir at time of virologic response may have a different impact on the risk of further virologic failure in HIV-infected patients. J Acquir Immune Defic Syndr. 2003;34:497–9. doi: 10.1097/00126334-200312150-00008. [DOI] [PubMed] [Google Scholar]
- 7.Back DJ, Khoo SH, Gibbons SE, Merry C. The role of therapeutic drug monitoring in treatment of HIV infection. Br J Clin Pharmacol. 2001;51:301–8. doi: 10.1046/j.1365-2125.2001.01380.x. [DOI] [PMC free article] [PubMed] [Google Scholar]
- 8.Aarnoutse RE, Schapiro JM, Boucher CA, Hekster YA, Burger DM. Therapeutic drug monitoring: an aid to optimising response to antiretroviral drugs? Drugs. 2003;63:741–53. doi: 10.2165/00003495-200363080-00002. [DOI] [PubMed] [Google Scholar]
- 9.Burger DM, Hugen PWH, Reiss P, Gyssens I, Schneider M, Kroon F, Schreij G, Brinkman K, Richter C, Prins J, Aarnoutse R, Lange J the ATHENA Cohort Study Group. Therapeutic drug monitoring of nelfinavir and indinavir in treatment-naive HIV-1-infected individuals. AIDS. 2003;17:1157–65. doi: 10.1097/00002030-200305230-00007. [DOI] [PubMed] [Google Scholar]
- 10.Jackson KA, Rosenbaum SE, Kerr BM, Pithavala YK, Yuen G, Dudley MN. A population pharmacokinetic analysis of nelfinavir mesylate in human immunodefficiency virus-infected patients enrolled in a phase III clinical trial. Antimicrob Agents Chemother. 2000;44:1832–7. doi: 10.1128/aac.44.7.1832-1837.2000. [DOI] [PMC free article] [PubMed] [Google Scholar]
- 11.Baede-van Dijk PA, Hugen PWH, Verweij-van Wissen CPWGM, Koopmans PP, Burger DM, Hekster YA. Analysis of variation in plasma concentrations of nelfinavir and its active metabolite M8 in HIV-positive patients. AIDS. 2001;15:991–8. doi: 10.1097/00002030-200105250-00007. [DOI] [PubMed] [Google Scholar]
- 12.Spire B, Duran S, Souville M, Leport C, Raffi F, Moatti JP the APROCO cohort study group. Adherence to highly active antiretroviral therapies (HAART) in HIV-infected patients: from a predictive to a dynamic approach. Soc Sci Med. 2002;54:14981–96. doi: 10.1016/s0277-9536(01)00125-3. [DOI] [PubMed] [Google Scholar]
- 13.Akaike H. Statistical predictor identification. Ann Inst Statist Math. 1973;22:203–17. [Google Scholar]
- 14.Legrand M, Taburet AM, Diquet B. Interlaboratory quality control for PI quantifications in multicentric trial. 2nd International Workshop on Clinical Pharmacology of HIV Therapy; Noordwijk, the Netherlands. 2001. Abstract 8.3. [Google Scholar]
- 15.Lamotte C, Peytavin G, Farinotti R. Determination of nelfinavir, a potent protease inhibitor and its metabolite M8 in human plasma sample by high-performance liquid chromatography with photodiode-array detection. J Chromatogr B. 1999;735:159–70. doi: 10.1016/s0378-4347(99)00419-3. [DOI] [PubMed] [Google Scholar]
- 16.Aymard G, Legrand M, Trichereau N, Diquet B. Determination of twelve antiretroviral agents in human plasma sample using reverse-phase high-performance liquid chromatography. J Chromatogr B. 2000;744:227–40. doi: 10.1016/s0378-4347(00)00225-5. [DOI] [PubMed] [Google Scholar]
- 17.Proust V, Toth K, Hulin A, Taburet AM, Gimenez F, Singlas E. Simultaneous high-performance liquid chromatographic determination of the antiretroviral agents amprenavir, nelfinavir, ritonavir, saquinavir, delavirdine and efavirenz in human plasma. J Chromatogr B. 2000;742:453–8. doi: 10.1016/s0378-4347(00)00208-5. [DOI] [PubMed] [Google Scholar]
- 18.Dailly E, Thomas L, Kergueris MF, Jolliet P, Bourin M. High-performance liquid chromatographic assay to determine the plasma levels of HIV-protease inhibitors (amprenavir, nelfinavir, ritonavir, saquinavir) and the non-nucleoside reverse transcriptase inhibitor (nevirapine) after liquid-liquid extraction. J Chromatogr B. 2001;758:129–35. doi: 10.1016/s0378-4347(01)00117-7. [DOI] [PubMed] [Google Scholar]
- 19.Bouley M, Briere C, Padoin C, Petitjean O, Tod M. Sensitive and rapid method for the simultaneous quantification of the HIV-protease inhibitors indinavir, nelfinavir, ritonavir and saquinavir in human plasma by reversed-phase liquid chromatography. Ther Drug Monit. 2001;23:56–60. doi: 10.1097/00007691-200102000-00011. [DOI] [PubMed] [Google Scholar]
- 20.Houston JB. Drug metabolite kinetics. Pharmacol Ther. 1981;15:521–52. doi: 10.1016/0163-7258(81)90056-5. [DOI] [PubMed] [Google Scholar]
- 21.Rowland M, Tozer TN. Clinical Pharmacokinetics, Concepts and Applications. 3. Baltimore: Lippincott. Williams & Wilkins; 1995. [Google Scholar]
- 22.Mentré F, Escolano S, Diquet B, Golmard JL, Mallet A. Clinical pharmacokinetics of zidovudine: inter and intraindividual variability and relationship to long term efficacy and toxicity. Eur J Clin Pharmacol. 1993;45:397–407. doi: 10.1007/BF00315509. [DOI] [PubMed] [Google Scholar]
- 23.Beal SL. Ways to fit a PK model with some data below the quantification limit. J Pharmacokinet Pharmacodyn. 2001;28:481–504. doi: 10.1023/a:1012299115260. [DOI] [PubMed] [Google Scholar]
- 24.Lindström MJ, Bates DM. Nonlinear mixed-effects models for repeated measures data. Biometrics. 1990;46:673–87. [PubMed] [Google Scholar]
- 25.Pinheiro JC, Bates DM. Mixed-Effect Models in S and Splus. New York: Springer-Verlag; 2000. [Google Scholar]
- 26.Karlsson MO, Sheiner LB. The importance of modelling interoccasion variability in population pharmacokinetic analyses. J Pharmacokinet Biopharm. 1993;21:735–50. doi: 10.1007/BF01113502. [DOI] [PubMed] [Google Scholar]
- 27.Kerbusch T, Wahlby U, Milligan PA, Karlsson MO. Electronic monitoring of variation in drug intakes can reduce bias and improve precision in pharmacokinetic/pharmacodynamic population studies. Br J Clin Pharmacol. 2003;56:639–52. doi: 10.1046/j.1365-2125.2003.01967.x. [DOI] [PMC free article] [PubMed] [Google Scholar]
- 28.Zhang L, Beal SL, Sheiner LB. Simultaneous vs. sequential analysis for population PK/PD data. I. Best-case performance. J Pharmacokinet Pharmacodyn. 2003;30:387–404. doi: 10.1023/b:jopa.0000012998.04442.1f. [DOI] [PubMed] [Google Scholar]
- 29.Moghadamnia AA, Rostami-Hodjegan A, Abdul-Manap R, Wright CE, Morice AH, Tucker GT. Physiologically based modelling of inhibition of metabolism and assessment of the relative potency of drug and metabolite: dextromethorphan vs. dextrorphan using quinidine inhibition. Br J Clin Pharmacol. 2003;56:57–67. doi: 10.1046/j.1365-2125.2003.01853.x. [DOI] [PMC free article] [PubMed] [Google Scholar]
- 30.DiCenzo R, Forrest A, Fischl MA, Collier A, Feinberg J, Ribaudo H, DiFrancecso R, Morse GD the AIDS Clinical Trials Group 388/733/5060 Study Team. Pharmacokinetics of indinavir and nelfinavir in treatment-naive, human immunodeficiency virus-infected subjects. Antimicrob Agents Chemother. 2004;48:918–23. doi: 10.1128/AAC.48.3.918-923.2004. [DOI] [PMC free article] [PubMed] [Google Scholar]
- 31.Brendel K, Legrand M, Taburet AM, Baron G, Goujard C, Mentré F the Cophar 1-ANRS 102 Study Group. Population pharmacokinetic analysis of indinavir in HIV-patients treated with stable antiretroviral therapy. Fundam Clin Pharmacol. 2005 doi: 10.1111/j.1472-8206.2005.00315.x. in press. [DOI] [PubMed] [Google Scholar]
- 32.Vrijens B, Goetghebeur E. Electronic monitoring of variation in drug intakes can reduce bias and improve precision in pharmacokinetic/pharmacodynamic population studies. Stat Med. 2004;23:531–44. doi: 10.1002/sim.1619. [DOI] [PubMed] [Google Scholar]