Abstract
Aim
To explore relationships between sirolimus dosing, concentration and clinical outcomes.
Methods
Data were collected from 25 kidney transplant recipients (14 M/11 F), median 278 days after transplantation. Outcomes of interest were white blood cell (WBC) count, platelet (PLT) count, and haematocrit (HCT). A naive pooled data analysis was performed with outcomes dichotomized (Mann–Whitney U-tests).
Results
Several patients experienced at least one episode when WBC (n = 9), PLT (n = 12), or HCT (n = 21) fell below the lower limits of the normal range. WBC and HCT were significantly lower (P < 0.05) when sirolimus dose was greater than 10 mg day−1, and sirolimus concentration greater than 12 µg l−1. No relationship was shown for PLT and dichotomized sirolimus dose or concentration.
Conclusions
Given this relationship between sirolimus concentration and effect, linked population pharmacokinetic–pharmacodynamic modelling using data from more renal transplant recipients should now be used to quantify the time course of these relationships to optimize dosing and minimize risk of these adverse outcomes.
Keywords: haematological outcomes, concentration–effect, pharmacodynamics, sirolimus
Introduction
Sirolimus has a different mechanism of action and adverse effect profile than the primary drugs used for immunosuppression, calcineurin inhibitors [cyclosporin-A (CsA) or tacrolimus]. Inhibition of calcineurin-mediated transcription of cytokines is associated with nephrotoxicity, neurotoxicity, and diabetogenesis [1, 2]. Sirolimus inhibits interleukin-2-mediated signal transduction. The principal adverse effects of sirolimus include lipid disorders and myelosuppressive effects [2–6].
Thrombocytopenia, leucopenia and anaemia have been reported in kidney transplant recipients who received sirolimus, but there was little information about how these relate to sirolimus exposure [2–5]. In a phase-I ascending-dose study of sirolimus [6], efficacy and safety were assessed in stable, long-term kidney transplant recipients. Fourteen days after the addition of sirolimus, platelet (PLT) counts and white blood cell (WBC) counts were significantly lower compared with patients assigned to a placebo group. PLT declined to a greater extent in the higher dose groups (sirolimus 5–6 mg m−2 and 7–13 mg m−2) compared with the low-dose group (sirolimus 1–3 mg m−2) [6].
To assess the relationship between sirolimus dose or concentration and myelosuppression, a population pharmacokinetic–pharmacodynamic modelling approach with implementation of a semimechanistic model that accounts for the time delay between drug administration and the observed effects on individual cellular components [WBC, PLT, haematocrit (HCT)[ could be useful, similar to the approach used previously to assess myelosuppression of chemotherapeutic drugs [7–9].
In this study, an analysis was undertaken to screen for the possible existence of relationships between sirolimus dose and concentrations, and WBC counts, PLT counts and HCT. A significant relationship shown during this empirical screening would provide the impetus for a larger study involving a more formal, model-based analysis.
Methods
The study received ethical approval from the University of Queensland Medical Research Ethics Committee (2002000668) and the Ethics of Human Research Committee of The Queen Elizabeth Hospital (2003176). Sirolimus concentration–time data and outcome data were retrospectively collected from 25 kidney transplant recipients who received sirolimus as part of their routine clinical care at The Queen Elizabeth Hospital, Woodville, South Australia. The majority of patients (n = 21) received sirolimus as rescue therapy, with sirolimus prescribed after patients had an episode of haemolytic uraemic syndrome (n = 1), delayed graft function (n = 5) or drug toxicity [cyclosporin suspected neurotoxicity (mouth twitch) n = 1, cyclosporin suspected nephrotoxicity n = 5, tacrolimus suspected nephrotoxicity n = 2, unspecified cyclosporin suspected toxicity n = 3] while receiving other immunosuppressive drug(s). Four patients had no reason recorded for the switch and four patients received sirolimus as primary immunosuppression.
Patients were receiving combination immunosuppressive therapy including sirolimus with: mycophenolate mofetil (MMF) and corticosteroids (n = 15); CsA and corticosteroids (n = 3); tacrolimus and corticosteroids (n = 4); corticosteroids alone (n = 2); and MMF alone (n = 1). Sirolimus dose adjustment was based on EDTA-anticoagulated whole-blood trough concentrations, measured using HPLC-UV [10] as part of routine clinical care at The Queen Elizabeth Hospital. The assay had between-run precision [coefficient of variation (CV) %] ranging from 3.8% to 1.9%, and bias 21% to 2% at concentrations ranging from 2.5 to 50 µg l−1, respectively. The within-run equivalent data were: CV% of 9.9% and 1.1%, and bias of 6% and 0.4%, at these same concentrations. The lower limit of quantitation (LLOQ) was set at 2.5 µg l−1. The target range for trough concentrations was 4–12 µg l−1 when sirolimus was given concomitantly with CsA, and 12–20 µg l−1 without CsA.
Laboratory results (WBC, PLT, HCT), measured on the same day as drug concentrations, were gathered from medical notes at the times that sirolimus concentrations were available.
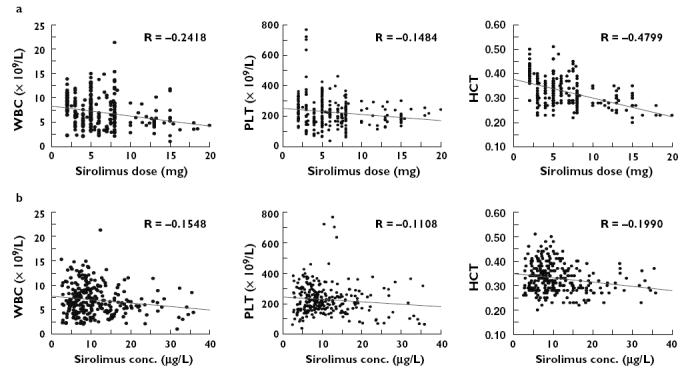
Scatter plots of sirolimus dose, concentration, and WBC count, PLT count and HCT were examined and naive pooled data analysis was performed. Outcomes were also dichotomized. A cut-off sirolimus dose of 10 mg day−1 (based on the data shown in the upper panels in Figure 2) and a cut-off sirolimus concentration of 12 µg l−1 were chosen. The concentration cut-point (12 µg l−1) was chosen based on an upper therapeutic range used in a previous study [11], in which sirolimus was taken in combination with MMF, the most common combination in this study. This concentration was also the lower limit of the target concentration range for the 22 patients not receiving CsA and the upper limit for the three patients receiving CsA, providing another reason for choosing this cut-point.
Figure 2.

Outcomes vs. sirolimus (a) dose and (b) concentration. Graphs are presented as scatter plots with linear regression trend lines
Significance differences in outcomes between the dichotomized groups were tested using Mann–Whitney U-tests as the data were not normally distributed [NCSS 2001 (NCSS Statistical Software., Kaysville UT, USA) with PASS trial]. P < 0.05 was considered statistically significant. The naive pooled screening analysis was not corrected for repeated measures and multiple tests, leading to a higher chance of identifying significant relationships.
Results
Sirolimus was taken at an average dose (± SD) of 6 mg (± 3) per day (range from 2 to 20 mg day−1). Patients were 44 (± 13) years old, were 618 (± 847) days after transplantation, had creatinine clearance 45.3 (± 21.6) ml min−1 (estimated using the Cockcroft–Gault equation) and liver function tests mainly within normal ranges.
A number of times sirolimus concentrations were available without laboratory outcome observations. These were excluded. This accounted for 34, 36 and 34 cases out of the 315 observations for WBC, PLT and HCT, respectively. Further data were excluded when sirolimus concentrations were below the lower limit of quantification (2.5 µg l−1; 13 occasions). A total of 270, 268, and 270 concentration–time pairs from the 25 patients were thus available for the screening for a concentration and effect relationship with WBC, PLT and HCT, respectively. Dose was available for each occasion.
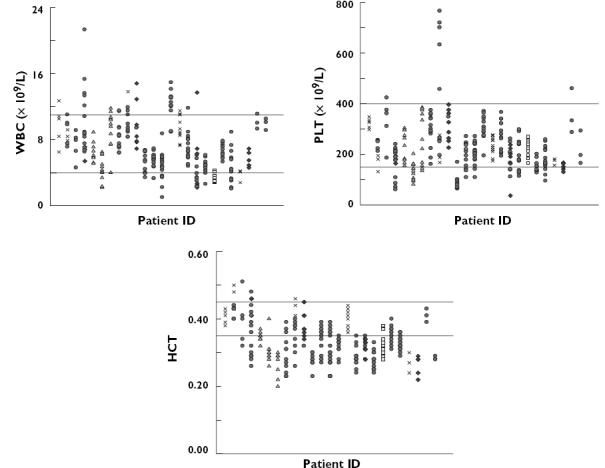
The distribution of the available individual haematological laboratory results is shown in Figure 1. Mean (± SD) WBC, PLT and HCT were 7.3 × 10⁹ l−1 (± 2.5), 233.3 × 10⁹ l−1 (± 77.3), and 0.3 (± 0.05), respectively. During the data collection period, a number of patients experienced at least one episode when WBC (n = 9), PLT (n = 12), or HCT (n = 21) fell below the lower limits of the normal range.
Figure 1.

Individual haematological outcomes during data collection period. The horizontal lines show the normal ranges used at The Queen Elizabeth Hospital, Adelaide, Australia. Normal range: white blood cells (WBC), 4–11 × 109 l−1; platelets (PLT), 150–400 × 109 l−1; haematocrit (HCT), 0.35–0.45. Different symbols are used to indicate the immunosuppressive regimen given concomitantly with sirolimus  , mycophenolate mofetil (MMF)/corticosteroids;
  , cyclosporin-A/corticosteroids;
  , tacrolimus/corticosteroids;
  , corticosteroids; ♦, and
  MMF
MMF
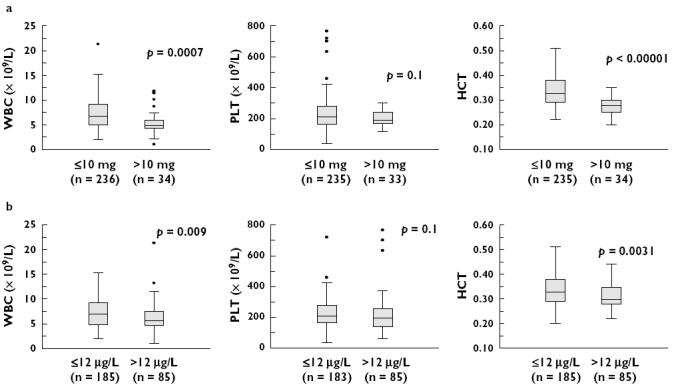
Scatter plots of WBC, PLT, HCT vs. sirolimus dose and concentration are shown in Figure 2. Weak trends were observed between HCT, WBC, PLT and sirolimus dose and concentration (P-values ranged from <0.01 for three of the correlations, to between 0.01 and 0.07 for the other three). WBC counts and HCT were significantly lower (P < 0.05) when sirolimus dose was greater than 10 mg day−1 and sirolimus concentration greater than 12 µg l−1 (Figure 3). Significant relationships were not found between PLT and sirolimus dose or concentration.
Figure 3.

Outcomes vs. dichotomized sirolimus (a) dose and (b) concentration. The middle horizontal lines represent the median value; the top and bottom of the boxes are the 25th and 75th percentiles
Discussion
Sirolimus has been studied in combination with calcineurin inhibitors (e.g. CsA or tacrolimus [12, 13]) and also with other immunosuppressive drugs (e.g. azathioprine or MMF [2, 4, 5]). Sirolimus is associated with the occurrence of leucopenia, thrombocytopenia and anaemia [4].
The present pilot study indicates an association between sirolimus exposure and haematological outcomes. Higher doses of sirolimus were associated with lower WBC counts. Neither sirolimus dose nor concentration (dichotomized) was related significantly to PLT counts. The majority of PLT counts were within the normal range, which may relate to the large amount of data (∼ 85%) that arose after 4 weeks of transplantation, after which time the prevalence of thrombocytopenia is reported to be low [4]. About 60% of patients have been reported to experience leucopenia (WBC <5 × 10⁹ l−1) in the first 4 weeks after transplantation, and about 13% experienced this at 25–52 weeks [4]. The occurrence of these outcomes was not associated with patient demographics (age, gender); pretreatment PLT and WBC counts or pretransplant diabetes [4]. It was suggested that a higher prevalence occurred when trough sirolimus concentrations were ≥16 µg l−1[4].
Although anaemia has been reported in sirolimus-treated patients, there was limited information on any relationship with dose or concentration prior to this study [14].
In our study there was an inverse association of sirolimus dose or concentration and HCT. Based on the prior expectation that the high binding of sirolimus to red blood cells (95%-bound [15]) would result in a positive correlation between HCT and sirolimus concentration, the negative correlation actually observed in our study suggests that the impact of sirolimus toxicity on HCT may indeed be large. Sirolimus therapy has been found to be significantly correlated with low haematocrit in a recent study and also to have a greater impact on erythropoiesis than mycophenolate mofetil [16]. Prediction of the occurrence of anaemia is complex with many factors involved (e.g. other immunosuppressive drugs and kidney function). Confounding may also have occurred if clinicians adjusted the dose of sirolimus based on the observed low HCT which, although not routine, could result in censoring of extreme cases of low HCT. This censoring would almost certainly have occurred in relation to the other endpoints of low WBC and PLT counts. This censoring would result in a blunting of the possible dose–outcome relationship.
Due to the limited number of patients, and the unbalanced number of patients in each treatment group, subanalysis of data for each of the different immunosuppressive regimens was not possible.
Although a previous study has reported an association with thrombocytopenia and leucopenia with sirolimus trough concentrations greater than 16 µg l−1[4], we found a significant association at the lower cut-off concentration of 12 µg l−1, which suggests a stronger relationship than may have been previously expected, since the lower the cut-off value the more difficult it is to show a significant relationship. The previous study, however, did not include patients receiving mycophenolate mofetil and, as this immunosuppressant may also contribute to the leucopenia, this may have led to the lower cut-off concentration suggested by our data [4].
The majority of patients for whom data were analysed were (i) patients who received sirolimus as a rescue drug, and (ii) sirolimus was taken without CsA. To date, there is no information available for the relationship of sirolimus and outcomes in this group of patients. Hence this result, although preliminary, provides useful clinical information.
In conclusion, these preliminary results support a potentially significant relationship between sirolimus dose, concentration and adverse haematological effects (particularly WBC and HCT). Future studies in more patients are required to quantify the time course and extent of these relationships formally and to provide suitable predictive models to improve patient care.
Acknowledgments
Competing interest: None declared.
Australian National Health & Medical Research Council (NHMRC) Project Grant no. 210173 provided financial support for this research.
References
- 1.Mayer AD, Dmitrewski J, Squifflet JP, Besse T, Grabensee B, Klein B, Eigler F, Heemann U, Pichlmayr R, Behrend M, Vanrenterghem Y, Donck J, van Hooff J, Christiaans M, Morales JM, Andres A, Johnson RWG, Short C, Buchholz B, Rehmert N, Land W, Schleibner S, Forsythe JLR, Talbot D, Neumayer H-H, Hauser I, Ericzon B-G, Brattström C, Claesson K, Mühlbacher F, Pohanka E. Multicenter randomized trial comparing tacrolimus (FK506) and cyclosporine in the prevention of renal allograft rejection: a report of the European Tacrolimus Multicenter Renal Study Group. Transplantation. 1997;64:436–43. doi: 10.1097/00007890-199708150-00012. [DOI] [PubMed] [Google Scholar]
- 2.Groth CG, Backman L, Morales JM, Calne R, Kreis H, Lang P, Touraine JL, Claesson K, Campistol JM, Durand D, Wrammer L, Brattstrom C, Charpentier B. Sirolimus (rapamycin)-based therapy in human renal transplantation: similar efficacy and different toxicity compared with cyclosporine. Sirolimus European Renal Transplant Study Group. Transplantation. 1999;67:1036–42. doi: 10.1097/00007890-199904150-00017. [DOI] [PubMed] [Google Scholar]
- 3.Kahan BD, Julian BA, Pescovitz MD, Vanrenterghem Y, Neylan J. Sirolimus reduces the incidence of acute rejection episodes despite lower cyclosporine doses in caucasian recipients of mismatched primary renal allografts: a phase II trial. Rapamune Study Group. Transplantation. 1999;68:1526–32. doi: 10.1097/00007890-199911270-00016. [DOI] [PubMed] [Google Scholar]
- 4.Hong JC, Kahan BD. Sirolimus-induced thrombocytopenia and leukopenia in renal transplant recipients: risk factors, incidence, progression, and management. Transplantation. 2000;69:2085–90. doi: 10.1097/00007890-200005270-00019. [DOI] [PubMed] [Google Scholar]
- 5.Kreis H, Cisterne JM, Land W, Wramner L, Squifflet JP, Abramowicz D, Campistol JM, Morales JM, Grinyo JM, Mourad G, Berthoux FC, Brattström C, Lebranchu Y, Vialtel P. Sirolimus in association with mycophenolate mofetil induction for the prevention of acute graft rejection in renal allograft recipients. Transplantation. 2000;69:1252–60. doi: 10.1097/00007890-200004150-00009. [DOI] [PubMed] [Google Scholar]
- 6.Murgia MG, Jordan S, Kahan BD. The side effect profile of sirolimus: a phase I study in quiescent cyclosporine-prednisone-treated renal transplant patients. Kidney Int. 1996;49:209–16. doi: 10.1038/ki.1996.28. [DOI] [PubMed] [Google Scholar]
- 7.Friberg LE, Karlsson MO. Mechanistic models for myelosuppression. Invest New Drugs. 2003;21:183–94. doi: 10.1023/a:1023573429626. [DOI] [PubMed] [Google Scholar]
- 8.Friberg LE, Henningsson A, Maas H, Nguyen L, Karlsson MO. Model of chemotherapy-induced myelosuppression with parameter consistency across drugs. J Clin Oncol. 2002;20:4713–21. doi: 10.1200/JCO.2002.02.140. [DOI] [PubMed] [Google Scholar]
- 9.Zamboni WC, D’Argenio DZ, Stewart CF, MacVittie T, Delauter BJ, Farese AM, Potter DM, Kubat NM, Turbergen D, Egorin MJ. Pharmacodynamic model of topotecan-induced time course of neutropenia. Clin Cancer Res. 2001;7:2301–8. [PubMed] [Google Scholar]
- 10.French DC, Saltzgueber M, Hicks DR, Cowper AL, Holt DW. HPLC assay with UV detection for therapeutic drug monitoring of sirolimus. Clin Chem. 2001;47:1316–9. [PubMed] [Google Scholar]
- 11.Egidi MF, Cowan PA, Naseer A, Gaber AO. Conversion to sirolimus in solid organ transplantation: a single-center experience. Transplant Proc. 2003;35(3 Suppl):131S–7S. doi: 10.1016/s0041-1345(03)00240-9. [DOI] [PubMed] [Google Scholar]
- 12.Kahan BD, Napoli KL, Podbielski J, Hussein I, Katz SH, Van Buren CT. Therapeutic drug monitoring of sirolimus for optimal renal transplant outcomes. Transplant Proc. 2001;33:1278. doi: 10.1016/s0041-1345(00)02476-3. [DOI] [PubMed] [Google Scholar]
- 13.van Hooff JP, Squifflet JP, Wlodarczyk Z, Vanrenterghem Y, Paczek L. A prospective randomized multicenter study of tacrolimus in combination with sirolimus in renal-transplant recipients. Transplantation. 2003;75:1934–9. doi: 10.1097/01.TP.0000071301.86299.75. [DOI] [PubMed] [Google Scholar]
- 14.Winkelmayer WC, Kewalramani R, Rutstein M, Gabardi S, Vonvisger T, Chandraker A. Pharmacoepidemiology of anemia in kidney transplant recipients. J Am Soc Nephrol. 2004;15:1347–52. doi: 10.1097/01.asn.0000125551.59739.2e. [DOI] [PubMed] [Google Scholar]
- 15.Yatscoff RW. Pharmacokinetics of rapamycin. Transplant Proc. 1996;28:970–3. [PubMed] [Google Scholar]
- 16.Augustine JJ, Knauss TC, Schulak JA, Bodziak KA, Siegel C, Hricik DE. Comparative effects of sirolimus and mycophenolate mofetil on erythropoiesis in kidney transplant patients. Am J Transplant. 2004;4:2001–6. doi: 10.1111/j.1600-6143.2004.00612.x. [DOI] [PubMed] [Google Scholar]


