

Abstract
Aims
To assess the effects of body mass index, renal impairment (creatinine clearance), and hepatic impairment (Child-Pugh Score) on the pharmacokinetics of insulin aspart.
Methods
Pharmacokinetics of insulin aspart (injected subcutaneously in the abdomen immediately before a Boost® standardized meal) were characterized in: (1) diabetic subjects with four ranges of BMI values (n = 23); (2) diabetic subjects with varying degrees of renal impairment (normal, n = 6 vs two ranges of impairment, n = 12); and (3) nondiabetic patients with varying degrees of hepatic impairment (normal, n = 6 vs three ranges of impairment, n = 18).
Results
There was no correlation between any pharmacokinetic variable and the degree of renal or hepatic impairment. Increasing obesity was associated with a decreased apparent clearance per kg body weight (β = −0.0005, SE = 0.0001; P = 0.002), an increased t½ (β = 3.513, SE = 1.636; P = 0.044), and an increased ln(AUC0–360) and ln(AUC0–1440) (β = 0.030, SE = 0.013; P = 0.032 and β= 0.039, SE = 0.0132; P = 0.006, respectively). However, obesity-related changes were smaller than individual variations in parameters.
Conclusions
Renal impairment, hepatic impairment, or BMI do not affect the pharmacokinetics of insulin aspart in a clinically significant manner.
Abbreviations
AUC0–1440, area under the plasma concentration curve; BMI, body-mass index; CLcr, renal clearance of creatinine; CL/F, apparent clearance; CL/F/kg, body weight-adjusted apparent clearance; Cmax, maximal plasma concentration; FBG, fasting blood glucose; GFR, glomerular filtration rate; HI, human insulin; MRT, mean residence time; PK, pharmacokinetics; t½, half life; tmax, time to maximum concentration; Vz/F, apparent volume of distribution.
Keywords: dose adjustment, starting dose, insulin analogues, bolus insulin
Introduction
Insulin aspart is a rapid-acting insulin analogue of human insulin (HI), with aspartic acid substituted for proline at position B28 of the protein sequence. The pharmacokinetics and glucose-lowering actions of insulin aspart are very similar to those of HI following intravenous administration. However, after subcutaneous injection which is typically used in diabetes therapy, insulin aspart is absorbed much more rapidly into blood than HI (producing a higher Cmax), due to more rapid dissociation of insulin aspart hexamers [1].
Diabetes patients frequently have coexisting conditions such as obesity, renal impairment, or hepatic impairment. The potential effects of such conditions on insulin aspart absorption have not been characterized but could be clinically significant.
The effects of obesity on insulin aspart pharmacokinetics have not been examined. Negligible effects of obesity on pharmacokinetics of I125-labelled human insulin (Actrapid® or Novolin® R) have been previously reported in patients with type 2 diabetes: the rate of loss of I125-labelled rapid-acting insulin from injection sites in obese patients was similar to that of nonobese patients [2]. An appreciable degree of interindividual variation was apparent in the I125-insulin study, and insulin absorption in obese subjects was not affected by the differing sites of injection or the depth of subcutaneous fat as measured by ultrasonography.
Renal impairment may also potentially affect insulin aspart pharmacokinetics. DeFronzo et al. (1978) demonstrated that clearance of insulin is decreased in chronic renal failure patients in the absence of dialysis, and that clearance progressively increased after [3]. This finding suggests that some dialysable factors may impair the clearance of insulin. Other studies have also reported that dialysis can reverse the changes in insulin metabolism and its receptor-mediated utilization caused by severe renal impairment [4]. Furthermore, glycaemic clamp studies have indicated that insulin-mediated peripheral glucose uptake into skeletal muscle is decreased by as much as 60% in the uremic patient [5].
It is well established that the liver is a major site of metabolism of circulating insulin [6]. As a result, alterations in glucose metabolism are observed in patients with viral hepatitis, where glucose intolerance occurs during the active phase of the disease, but disappears during recovery [7]. The majority of patients with liver disease (60–80%) have glucose intolerance, and nearly 20% develop diabetes [8]. Glucose intolerance associated with liver disease is commonly accompanied by hyperinsulinaemia and skeletal muscle insulin resistance [9]. Despite indications that insulin pharmacodynamics are significantly altered in liver disease, its effect on the pharmacokinetics of insulin have not been studied.
In the present work, the effects of obesity, renal impairment and hepatic impairment on insulin aspart pharmacokinetics have been characterized.
Methods
Subjects
All subjects provided informed consent before each study, which was approved by an institutional review board (Independent Investigational Review Board, Inc.) and was performed in accordance with the Declaration of Helsinki [10] and the standards of good clinical practice. All subjects gave written informed consent.
Study 1: Type 1 diabetes with obesity
Enrolled subjects (10 males and 13 females ages 18–50 years) had type 1 diabetes (as defined by the American Diabetes Association clinical practice recommendations [11]) and had been treated with human insulin for the previous 12 months, with HbA1c values ≤ 12% and fasting blood glucose (FBG) values between 4.44 and 11.1 mmol L−1. Individuals were categorized by body mass index (BMI): Range I = BMI 19 to <23 kg m−2, Range II = BMI 23–27 kg m−2, Range III = BMI >27–32 kg m−2, Range IV = BMI >32 kg m−2.
Study 2: Type 1 diabetes with renal impairment
Enrolled subjects (8 males and 10 females aged ≥ 18 years) had suffered from type 1 diabetes for at least 2 years (defined and treated as above), and had BMI values of 19–38 kg m−2, HbA1c ≤11%, and fasting blood glucose (FBG) >4.44 mmol L−1 and <8.33 mmol L−1. Individuals were categorized by renal function: normal renal function = creatinine clearance (CLcr) >80 mL min−1, mild renal impairment = CLcr >50–80 mL min−1, moderate renal impairment = CLcr 30–50 mL min−1, severe renal impairment not yet requiring haemodialysis = CLcr <30 mL min−1.
Study 3: Hepatic impairment
Enrolled subjects (15 males and 9 females aged ≥ 18 years) were in good health with the exception of hepatic impairment (with or without ascites) with a BMI ≥19 but ≤38 kg m−2, and FBG <8.33 mmol L−1. A control group of healthy subjects were studied who had hepatic laboratory values within normal limits. Individuals were categorized by Child-Pugh Score: normal hepatic function = Child-Pugh Score 0, mild hepatic impairment = Child-Pugh Score 5–6, moderate hepatic impairment = Child-Pugh Score 7–9, severe hepatic impairment = Child-Pugh Score 10–15.
Exclusion criteria for all groups included: a known or suspected allergy to insulin aspart, related products or an anaphylactic reaction to any drug; the use of an investigational drug within 30 days prior to the study; the use of drugs that may impair or enhance the subcutaneous absorption of insulin or drugs that alter plasma glucose concentration; a history of any condition that requires treatment with prescription drugs other than those pertinent to the trial (i.e. treatments for diabetes and renal and hepatic impairment); clinically significant laboratory abnormalities; blood loss through donation, clinical study participation, trauma or surgery within the last 3 months; recurrent severe hypoglycaemia or ‘hypoglycaemic unawareness’; a daily insulin dose of ≥1.4 IU kg−1; pregnancy or unwillingness to use adequate contraceptive measures; known or suspected abuse of alcohol or narcotics; excessive (>2 servings per day) caffeine consumption; any condition that in either the investigator's or sponsor's opinion would interfere with trial participation or the evaluation of results; abnormal and clinically significant ECG or prolonged (>440 ms) QTc interval; smoking in the last 6 months; consumption of over 2 units of alcohol per day.
Subjects were also excluded on trial days if they tested positive for alcohol, had exercised strenuously within the last 24 h, or had an FBG <80 or >200 mg dL−1.
Study design
All studies were performed at one clinical trial site, the South Florida Bioavailability Clinic, 11190 Biscayne Boulevard, Miami, FL. Each subject was given a single subcutaneous dose of insulin aspart (Batch 9J14050, Novo Nordisk), injected into the left abdomen using a NovoPen® 3 and a NovoFine® 30 G ×8 mm needle. A standardized meal (Boost®) was provided immediately following injection, and consumed within 30 min. Insulin aspart doses were as follows:
Type 1 diabetes with Obesity: 0.10 U kg−1
Type 1 diabetes with Renal Impairment: 0.08 U kg−1
Hepatic Impairment: 0.06 U kg−1
Since the liver is a major site of insulin clearance, a slightly smaller dose was given to subjects with hepatic impairment for reasons of safety.
Serial blood samples (4 mL) were collected at 0, 0.5, 0.75, 1, 1.5, 2, 2.5, 3, 3.5, 4, 4.5, 5, 5.5, 6, 7, 8, 9, 10, 12, 16, and 24 h postdose. Plasma concentrations of insulin aspart were determined by an ELISA assay (limit of quantification 12.5 pmol L−1, coefficient of variation 5.7–12.5% at 146 pmol L−1) at Capio Diagnostik AS, Copenhagen, Denmark (http://www.capiodiagnostik.com). This validated insulin aspart assay showed no cross-reactivity with endogenous insulin or other analogues such as insulin lispro. The coefficient of variation of the glucose assay (glucose oxidase method) was 3% or less for the measurement range of 5.5–16.6 mmol l−1. In addition, glucose concentrations were determined at screening, the day before dosing, and, on the day of dosing, 60 and 30 min before injection of the drug.
Clinical assessment
The protocol called for subjects to have their blood glucose concentrations monitored throughout the study, and to be treating themselves using their customary insulin. Subjects who had fasting blood glucose concentrations outside the ranges noted above at the time of dosing were excluded from further participation in the clinical trial.
Pharmacokinetic analysis
Cmax and tmax were recorded directly from experimental observations. Values of t½ were estimated from the equation t½ = ln(2)/λz, where λz is the first order rate constant associated with the terminal part of the log concentration-vs.-time curve and estimated from linear regression using at least three data points. AUC0–360, AUC0–1440, and AUC0–∞ were determined using the linear trapezoidal rule. The apparent volume of distribution, Vz/F, was calculated using the formula dose/λz* AUC0–∞. The apparent clearance (CL/F) was estimated from the expression dose/AUC0–∞, and body weight-adjusted apparent clearance (CL/F/kg) was estimated by dividing the apparent clearance by the body mass of the subject. MRT was calculated using the formula AUMC0–∞/AUC0–∞, where AUMC0–∞ is the area under the moment curve extrapolated to infinity.
The relationship between the pharmacokinetic variables and renal or hepatic impairment measures were determined using a linear model using log-transformation [12]. For each of these interactions, R2 values were calculated using anova. Based upon prior experience from Novo Nordisk-sponsored pharmacokinetic trials, values of R2 <0.4 were considered to indicate a correlation (if statistically significant) that was not of clinical significance.
Results
A total of 65 subjects participated in the three studies (Table 1). All patients completed the protocols, but the data from one patient in the first group (Subj 001 – Range I) were excluded from pharmacokinetic analysis. This patient was considered to be an outlier due to a Cmax value that was 3–6 times greater, an AUC0–360 value that was 5–8 times greater, and an AUC0–1440 value 8–12 times greater than those of all other subjects in the same group.
Table 1.
Demographic data
| Treatment group | Subjects (n) | Mean age (years) | Gender (M/F) | Mean weight (kg) | Mean BMI (kg m−2) | Mean CLcr (mL min−1) | Mean Child- Pugh Score | Doseinsulin aspart |
|---|---|---|---|---|---|---|---|---|
| Type 1 diabetes: BMI | ||||||||
| Range I | 4 | 48 | 3/1 | 66 | 22.2 | 0.10 U kg−1 body weight | ||
| Range II | 7 | 51 | 1/6 | 67 | 26.3 | |||
| Range III | 6 | 49 | 4/2 | 85 | 30.8 | |||
| Range IV | 6 | 51 | 2/4 | 95 | 35.7 | |||
| Type 1 diabetes: renal impairment | ||||||||
| Normal | 6 | 45 | 3/3 | 94 | 99.8 | 0.08 U kg−1 body weight | ||
| Mild | 7 | 60 | 2/5 | 81 | 60.0 | |||
| Moderate | 3 | 62 | 1/2 | 62 | 35.7 | |||
| Severe | 2 | 28 | 2/0 | 68 | 23.5 | |||
| Volunteers: hepatic impairment | ||||||||
| Normal | 6 | 39.7 | 3/3 | 72 | 0.0 | 0.06 U kg−1 body weight | ||
| Mild | 6 | 55.7 | 5/1 | 89 | 5.7 | |||
| Moderate | 6 | 49.2 | 3/3 | 78 | 7.3 | |||
| Severe | 6 | 53.5 | 4/2 | 78 | 10.2 | |||
The mean concentration-time profiles for insulin aspart in plasma are presented in Figure 1, with respect to BMI, degree of renal impairment, and degree of hepatic impairment. The data for plasma concentration vs. time indicated that the individual variability of Cmax values was much greater than any systematic effects of BMI, renal impairment, or hepatic impairment on this parameter.
Figure 1.
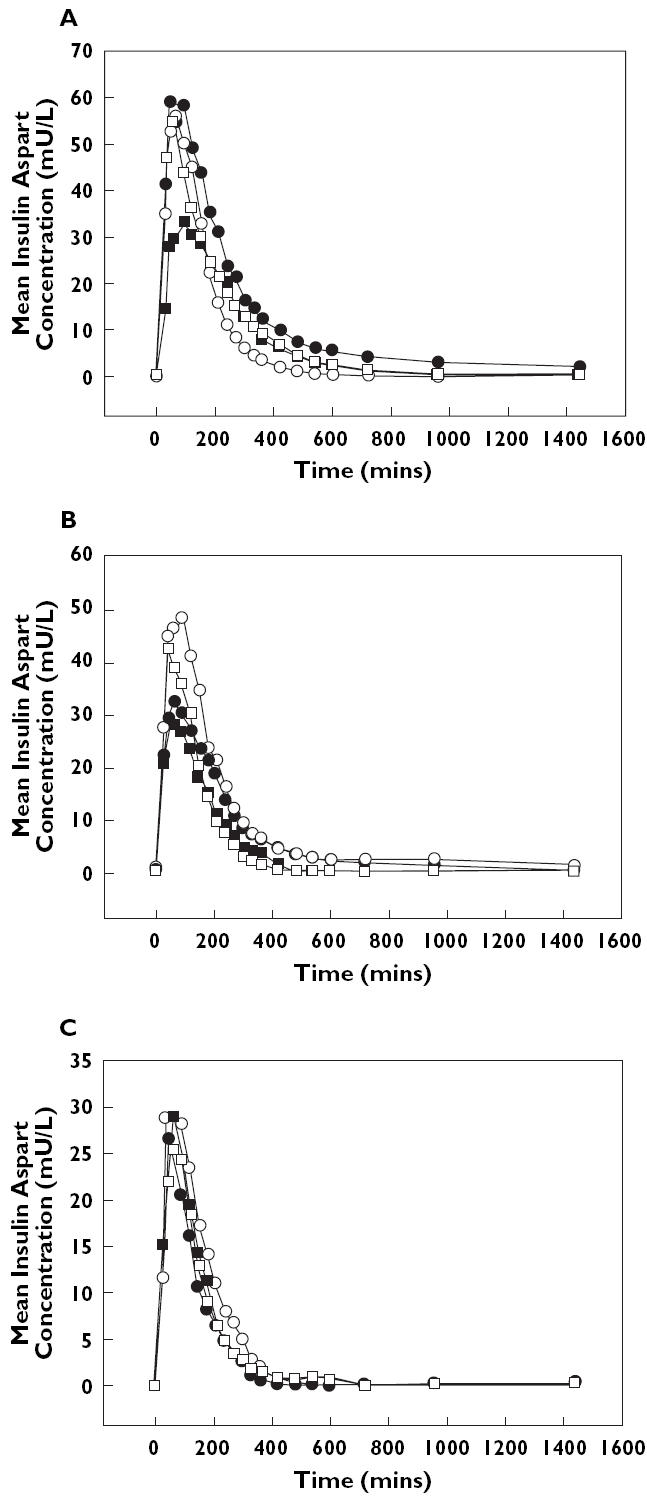
Mean plasma concentration-vs.-time profiles for insulin aspart following subcutaneous injection; Panel A: profiles by BMI category. Range I (•), Rangel II (○), Rangel III (▪), Rangel IV (□). Panel B: profiles for degree of renal impairment. Normal (•), mild (○), moderate (▪), severe (□); Panel C: profiles for degree of hepatic impairment. Normal (•), mild (○), moderate (▪), severe (□)
Although the R2 values were all <0.4 (suggesting poor predictability), the linear associations between BMI and t½, CL/F/kg, ln(AUC0–360), and ln(AUC0–1440) were all statistically significant (P < 0.05, Table 2, Figure 2).
Table 2.
Analysis of the relationship between pharmacokinetic parameters of insulin aspart and BMI, renal impairment (as measured by creatinine clearance), or hepatic impairment (as measured by Child-Pugh Score)
| Parameter | Slope (β) | Standard error | t-value | Observedsignificance level | R2 |
|---|---|---|---|---|---|
| BMI | |||||
| ln(Cmax)* | 0.019 | 0.020 | 0.951 | 0.353 | 0.043 |
| t½ (min) | 3.513 | 1.636 | 2.147 | 0.044 | 0.187 |
| Vz/F (L) | 3.678 | 2.556 | 1.439 | 0.166 | 0.094 |
| CL/F (L min−1) | −0.010 | 0.012 | −0.874 | 0.393 | 0.037 |
| ln(AUC0–360)* | 0.030 | 0.013 | 2.305 | 0.032 | 0.210 |
| ln(AUC0–1440)* | 0.039 | 0.013 | 3.053 | 0.006 | 0.318 |
| MRT (min) | 4.950 | 2.485 | 1.992 | 0.060 | 0.166 |
| CL/F/kg (L kg−1 min−1) | −0.0005 | 0.0001 | −3.572 | 0.002 | 0.390 |
| Creatinine clearance | |||||
| ln(Cmax) * | −0.0003 | 0.003 | −0.10 | 0.92 | 0.001 |
| t½ (min) | 0.224 | 0.49 | 0.46 | 0.65 | 0.013 |
| Vz/F (L) | 0.442 | 0.35 | 1.26 | 0.22 | 0.091 |
| CL/F (L min−1) | 0.003 | 0.003 | 0.73 | 0.48 | 0.032 |
| ln(AUC0–360)* | 0.001 | 0.004 | 0.29 | 0.78 | 0.005 |
| ln(AUC0–1440)* | 0.002 | 0.005 | 0.44 | 0.66 | 0.012 |
| MRT (min) | 0.362 | 0.95 | 0.38 | 0.71 | 0.009 |
| Child-Pugh Score | |||||
| ln(Cmax)* | 0.005 | 0.025 | 0.019 | 0.85 | 0.0016 |
| t½ (min) | −2.47 | 1.41 | −1.75 | 0.09 | 0.1227 |
| Vz/F (L) | −4.97 | 4.33 | −1.15 | 0.26 | 0.0566 |
| CL/F (L min−1) | 0.0016 | 0.024 | 0.068 | 0.94 | 0.002 |
| ln(AUC0–360)* | 0.006 | 0.025 | 0.26 | 0.80 | 0.030 |
| ln(AUC0–1440)* | 0.011 | 0.025 | 0.44 | 0.67 | 0.086 |
| MRT (min) | −0.084 | 2.81 | −0.03 | 0.98 | <0.0001 |
The units of measurement prior to transformation were: Cmax(mU L−1) and AUC (mU L−1 min−1).
Figure 2.
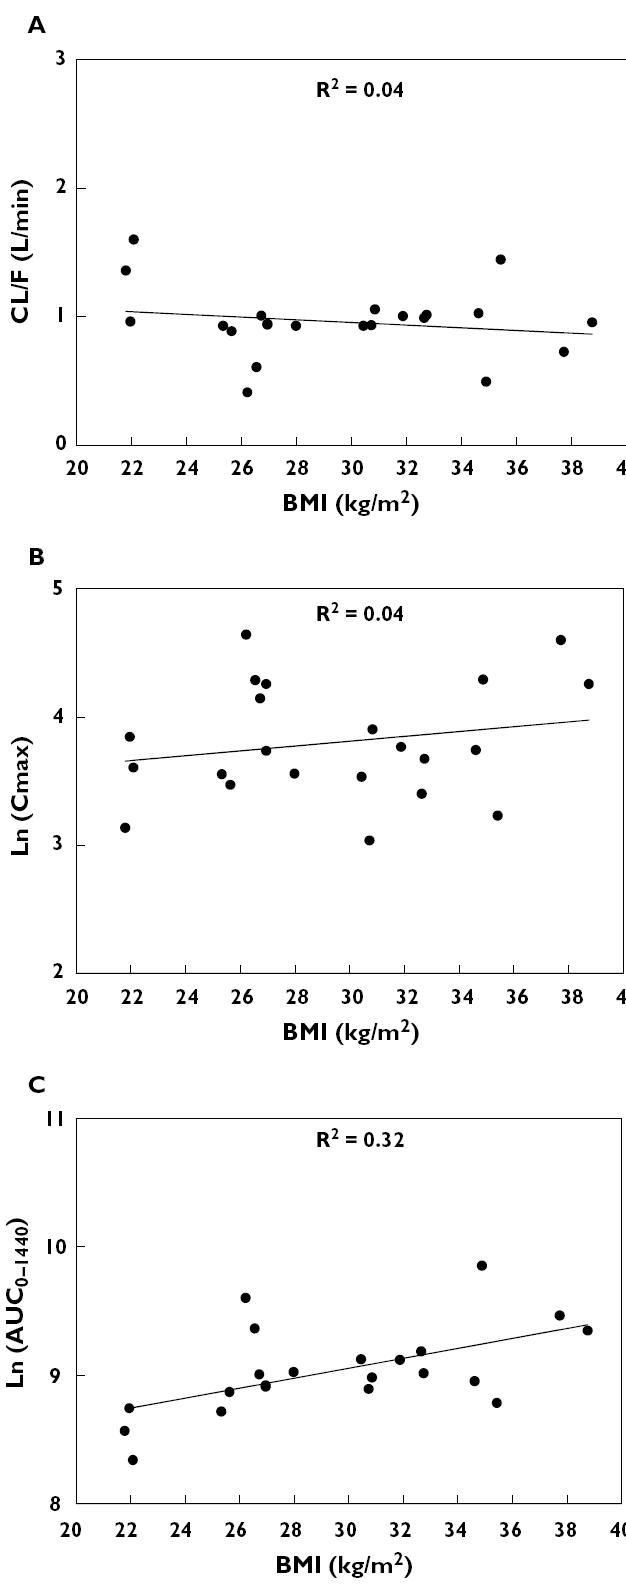
Effects of obesity on the pharmacokinetics of insulin aspart; Panel A: CL/F vs. BMI value; Panel B: ln(Cmax) vs. BMI value; Panel C: ln(AUC0–1440) vs. BMI value
Regression analyses revealed that the pharmacokinetic parameters of insulin aspart did not correlate linearly with creatinine clearance in type 1 diabetic patients with varying degrees of renal failure (Figure 3 and Table 2), or with Child-Pugh Score in nondiabetic subjects with varying degrees of hepatic failure (Figure 4 and Table 3). In both conditions, R2 values were small and no significant differences were detected.
Figure 3.
Effects of renal impairment on the pharmacokinetics of insulin aspart; Panel A: CL/F vs. creatinine clearance; Panel B: ln(Cmax) vs. creatinine clearance; Panel C: ln(AUC0–1440) vs. creatinine clearance
Figure 4.
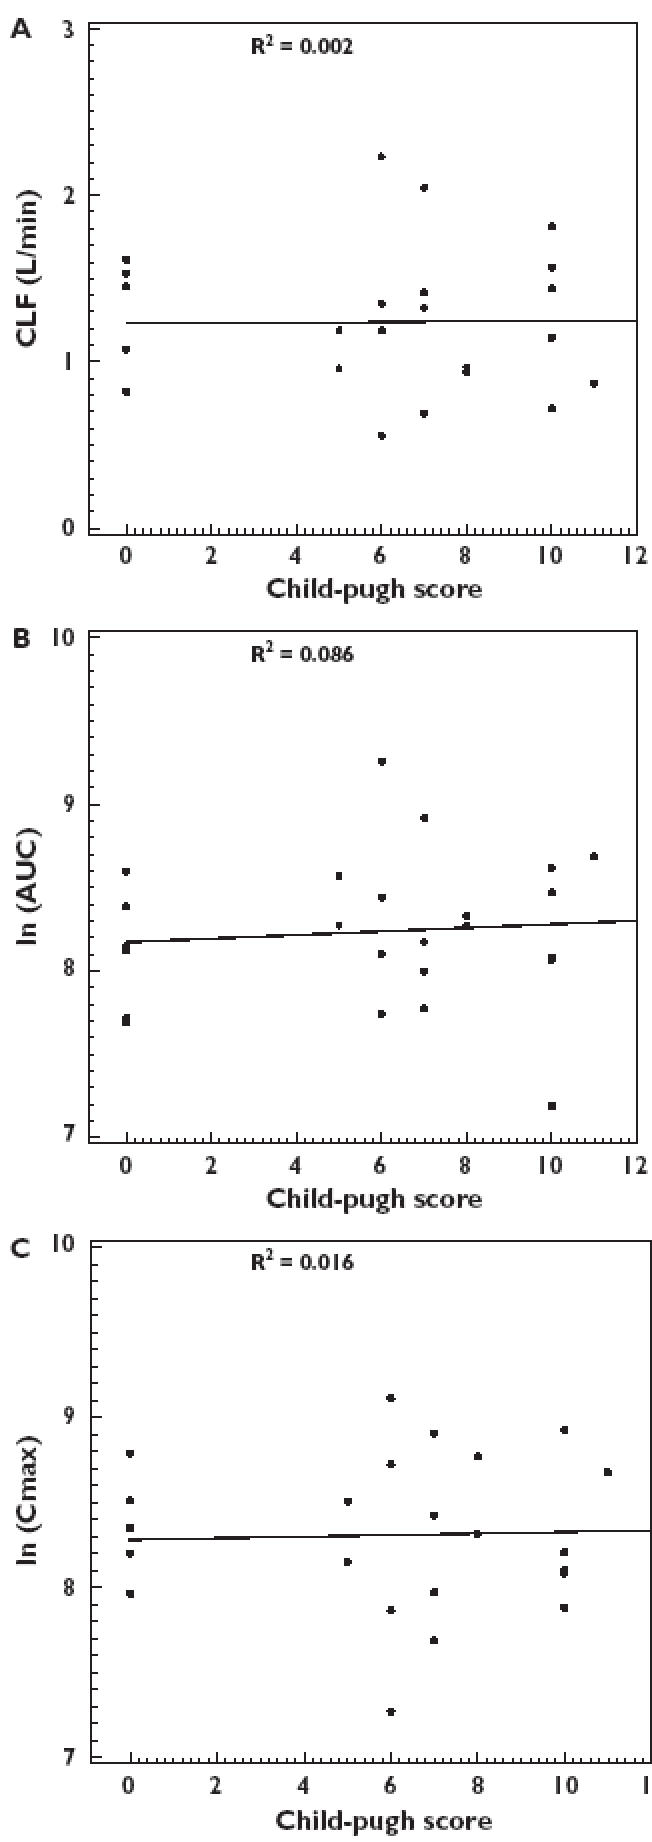
Effects of hepatic impairment on the pharmacokinetics of insulin aspart; Panel A: CL/F vs. Child-Pugh Score; Panel B: ln(Cmax) vs. Child-Pugh Score; Panel C: ln(AUC0–1440) vs. Child-Pugh Score
Table 3.
Mean (SD) of the pharmacokinetic parameters for insulin aspart in the different patient groups
| Parameter ln(Cmax)* | ln(AUC0–1440)* | CL/F (L min−1) | |
|---|---|---|---|
| PK parameters by BMI range | |||
| Range I (n = 3) | 3.53 (0.36) | 8.55 (0.20) | 1.30 (0.32) |
| Range II (n = 7) | 4.02 (0.44) | 9.06 (0.31) | 0.82 (0.22) |
| Range III (n = 6) | 3.53 (0.30) | 9.05 (0.11) | 0.97 (0.05) |
| Range IV (n = 6) | 3.97 (0.51) | 9.23 (0.39) | 0.94 (0.32) |
| PK parameters by degree of renal impairment | |||
| Normal (n = 6) | 3.51 (0.35) | 8.78 (0.65) | 1.17 (0.42) |
| Mild (n = 7) | 3.87 (0.43) | 9.23 (0.45) | 0.68 (0.36) |
| Moderate (n = 3) | 3.42 (0.23) | 8.43 (0.65) | 1.07 (0.45) |
| Severe (n = 2) | 3.74 (0.66) | 8.68 (0.27) | 0.91 (0.19) |
| PK parameters by degree of hepatic impairment | |||
| Normal (n = 6) | 3.30 (0.32) | 8.11 (0.36) | 1.22 (0.36) |
| Mild (n = 6) | 3.27 (0.66) | 8.40 (0.51) | 1.24 (0.56) |
| Moderate (n = 6) | 3.34 (0.46) | 8.25 (0.39) | 1.23 (0.48) |
| Severe (n = 6) | 3.31 (0.40) | 8.19 (0.55) | 1.26 (0.42) |
The units of measurement prior to transformation were Cmax(mU L−1) and AUC0–1440(mU L−1 min−1).
A total of 20 adverse events were reported in 14 subjects. The most frequent was headache (10 subjects) of mild or moderate intensity. This was considered to be possibly related to the drug, and was treated with ibuprofen 200 mg or paracetamol 500 mg. Transitory asthenia was reported by three individuals, and again was considered to be possibly treatment-related. Other adverse events (fatigue, nausea, urinary tract infection, insomnia, skeletal pain, and hypertension) were mild and reported by one subject each.
One serious adverse event occurred during this study. Despite glucose monitoring and allowing subjects to inject their usual insulin, diabetic ketosis occurred in one patient for unknown reasons. The subject, a 24-year-old female in the BMI Range II group, experienced an episode of ketosis on Study Day 1; the event was considered by the investigator to be severe and possibly related to the study medication. The subject had recovered 3 days later and was diagnosed as having a urinary tract infection. The urine ketone test at screening was within normal limits and had a value of 2+ at follow-up.
Discussion
In this study, the effects of obesity, renal impairment, or hepatic impairment upon the pharmacokinetics of a single dose of insulin aspart were evaluated.
No significant interactions were detected between any pharmacokinetic parameter and creatinine clearance in patients with renal failure. None of those with severe renal impairment were undergoing haemodialysis: such patients would presumably have been subject to any of the effects of uremic toxins, metabolic acidosis, and/or abnormal protein catabolism on insulin clearance [4].
Hepatic impairment also did not demonstrate any significant effects upon pharmacokinetic parameters with respect to Child-Pugh Score.
In contrast to an earlier study using radiolabelled insulin [2], obese diabetic patients did demonstrate a significant trend in some pharmacokinetic parameters for insulin as a function of BMI. The lack of effect of BMI on apparent clearance suggests that the latter is determined by lean body mass rather than body weight. The significant decrease in apparent clearance expressed per kilogram with increasing BMI was anticipated since both variables have body mass as a determinant. There was a direct and statistically significant relationship between the AUC of insulin and BMI. Whereas this observation might suggest a need for decreased starting doses in individuals with high BMI values, the degree of individual variation in these pharmacokinetic parameters was too great for the degree of obesity to be used to select the dose.
In conclusion, renal impairment, hepatic impairment or BMI do not affect the pharmacokinetics of insulin aspart in a clinically significant manner.
Acknowledgments
These pharmacokinetic studies received financial support of Novo Nordisk Inc.
References
- 1.Setter SM, Corbett CF, Campbell RK, White JR. Insulin aspart: a new rapid-acting insulin analog. Ann Pharmacother. 2000;34(12):1423–31. doi: 10.1345/aph.19414. [DOI] [PubMed] [Google Scholar]
- 2.Clauson PG, Linde B. Absorption of rapid acting insulin in obese and non-obese NIDDM subjects. Diabetes Care. 1995;18:986–91. doi: 10.2337/diacare.18.7.986. [DOI] [PubMed] [Google Scholar]
- 3.DeFronzo RA, Tobin JD, Rowe JW, Andres R. Glucose intolerance in uremia: Quantification of pancreatic beta cell sensitivity to glucose and tissue sensitivity to insulin. J Clin Invest. 1978;62:425–35. doi: 10.1172/JCI109144. [DOI] [PMC free article] [PubMed] [Google Scholar]
- 4.Foss MC, Gouveia LMFB, Moyses Neto M, Paccola GM, Piccinato CE. Effect of hemodialysis on peripheral glucose metabolism of patients with chronic renal failure. Nephron. 1996;73:48–53. doi: 10.1159/000188997. [DOI] [PubMed] [Google Scholar]
- 5.Fliser D, Pacini G, Engerleither R, Kautzky-Willer A, Prager R, Franek E, Ritz E. Insulin resistance and hyperinsulinemia are already present in patients with incipient renal disease. Kidney Intl. 1998;53:343–1347. doi: 10.1046/j.1523-1755.1998.00898.x. [DOI] [PubMed] [Google Scholar]
- 6.Henriksen JH, Tronier B, Bulow JB. Kinetics of circulating endogenous insulin, C-peptide, and proinsulin in fasting nondiabetic man. Metabolism. 1987;36(5):463–8. doi: 10.1016/0026-0495(87)90044-8. [DOI] [PubMed] [Google Scholar]
- 7.Chupin M, Charbonnel B, LeBodic L, Grolleau JY, Chopin F, Guillon J. Glucose tolerance in viral hepatitis. Diabetes. 1978;27:661–9. doi: 10.2337/diab.27.6.661. [DOI] [PubMed] [Google Scholar]
- 8.Megyesi C, Samols E, Marks V. Glucose tolerance and diabetes in chronic liver disease. Lancet. 1967;2:1051–6. doi: 10.1016/s0140-6736(67)90334-0. [DOI] [PubMed] [Google Scholar]
- 9.Cavallo-Perin P, Cassader M, Bozzo C, Bruno A, Nuccio P, Dallómo AM, Marucci M, Pagano G. Mechanism of insulin resistance in human liver cirrhosis. J Clin Invest. 1985;75:1659–65. doi: 10.1172/JCI111873. [DOI] [PMC free article] [PubMed] [Google Scholar]
- 10.World Medical Association. Declaration of Helsinki. J Am Med Assoc. 1997;277:925–6. [PubMed] [Google Scholar]
- 11.Expert Committee on the Diagnosis and Classification of Diabetes Mellitus. Report of the Expert Committee on the Diagnosis and Classification of Diabetes Mellitus. J Clin Appl Res Educ. 1999;22(Suppl 1):S5–S19. doi: 10.2337/diacare.26.2007.s5. [DOI] [PubMed] [Google Scholar]
- 12.Food and Drug Administration. Guidance for Industry. US Department of Health and Human Services; 1999. Pharmacokinetics in patients with impaired hepatic function: study design, data analysis, and impact on dosing and labelling. November. [Google Scholar]