

Abstract
Objective
The objectives of the study were to develop a population pharmacokinetic model for 11C-flumazenil at tracer concentrations, to assess the effects of patient-related covariates and to derive an optimal sampling protocol for clinical use.
Methods
A population pharmacokinetic model was developed using nonlinear mixed effects modelling (NONMEM) with data obtained from 51 patients with either depression or epilepsy. Each patient received ∼370 MBq (1–4 µg) of 11C-flumazenil. The effects of selected covariates (gender, weight, type of disease and age) were investigated. The model was validated using a bootstrap method. Finally, an optimal sampling design was established.
Results
The population pharmacokinetics of tracer quantities of 11C-flumazenil were best described by a two compartment model. Type of disease and weight were identified as significant covariates (P < 0.002). Mean population pharmacokinetic parameters (percent coefficient of variation) were: CL 1530 mL min−1 (6.6%), V1 24.8 × 10³ mL (3.8%), V2 27.3 × 10³ mL (5.4%), and Q 2510 mL min−1 (6.5%). CL was 20% lower in patients with epilepsy, and the influence of weight on V1 was 0.55% kg−1. For the prediction of the AUC, a combination of two time points at t = 30 and 60 min post injection was considered optimal (bias −0.7% (95% CI −2.2 to 0.8%), precision 5.7% (95% CI 4.5–6.9%)). The optimal sampling strategy was cross-validated (observed AUC = 296 MBql−1 min−1 (95% CI 102–490), predicted AUC = 288 MBql−1 min−1 (95% CI 70–506)).
Conclusions
The population pharmacokinetics of tracer quantities of 11C-flumazenil are well described by a two-compartment model. Inclusion of weight and type of disease as covariates significantly improved the model. Furthermore, an optimal sampling procedure may increase the feasibility and applicability of 11C-flumazenil PET.
Introduction
Positron Emission Tomography (PET) is a rapidly emerging imaging technique. It enables measurements of physiological and pharmacological processes in vivo, both qualitatively and quantitatively.
Unlabelled (‘cold’) flumazenil (Anexate®) is an antagonist of the central benzodiazepine receptor, which is used to antagonize the effects of benzodiazepines in the central nervous system. 11C-labelled flumazenil, administered in tracer amounts (<10 µg), is used for the quantification of benzodiazepine receptors in the brain by means of dynamic PET scanning. Such data are used to localize epileptic foci in patients who are candidates for surgery, particularly when MRI and EEG provide contradictory results.
11C-flumazenil has several properties that make it an excellent radiopharmaceutical. Its uptake into brain is rapid, it binds selectively and reversibly to benzodiazepine receptors in the central nervous system, and it has no pharmacological activity when administered in tracer quantities [1]. Furthermore, although several (radioactive) metabolites are formed (Figure 1), only the parent compound is able to cross the blood–brain barrier [2].
Figure 1.
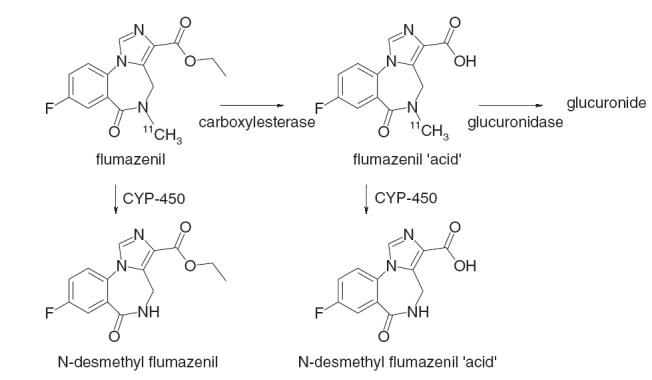
The metabolism of 11C-flumazenil
Benzodiazepine receptors are quantified in the brain from measurements of cerebral concentrations of 11C-flumazenil by PET, together with those of arterial plasma concentrations, and the appropriate kinetic model [3, 4]. The characterization of arterial plasma pharmacokinetics is of crucial importance in this procedure. The amount of 11C in blood (measured, for example using an on-line detection system) cannot be used to quantify 11C-flumazenil in plasma, since several radioactive metabolites are present. Usually a number of additional arterial blood samples are taken during the 60 min scanning period. These samples are used for calibration purposes, to convert whole blood to plasma concentration, and to correct for the contribution of radioactive 11C-flumazenil metabolites. However, processing of these samples is extremely time consuming, in particular because of the need to use HPLC to separate parent compound from labelled metabolites. Moreover, processing has to be carried out immediately after sampling due to the rapid decay of 11C (t1/2 = 20 min). Thus, there is an urgent need to simplify this procedure for measuring 11C-flumazenil plasma concentrations in order to increase its feasibility and applicability. The use of population pharmacokinetics, Bayesian estimates and optimal sampling may allow the achievement of this goal. Unlabelled flumazenil has a clearance of 500–1300 mL min−1 and a volume of distribution of 40–90 × 103 mL [1, 5]. However, tracer doses of 11C-flumazenil used in PET are approximately 1000-fold lower than therapeutic doses of the drug. Thus, extrapolation of the pharmacokinetics of these pharmacological doses to those from tracer concentrations of 11C-flumazenil may not be valid. At present, information on the pharmacokinetics of 11C-flumazenil is limited [6].
Use of individualized radioactive doses may improve the safety of radiopharmaceuticals. Intersubject variability may be due to many factors, such as gender and disease. If the covariates with significant effects on the pharmacokinetic properties of 11C-flumazenil could be defined, it might be possible to tailor radioactive doses to individual patients, as required by the ALARA (As Low As Reasonably Achievable) principle.
The objectives of the present study were to develop a population pharmacokinetic model for 11C-flumazenil at tracer concentrations and to identify patient characteristics that influence its pharmacokinetics. A further objective was to define and validate an optimal sampling protocol for 11C-flumazenil PET studies, based on this model.
Methods
Patients
Data were collected retrospectively from successive 11C-flumazenil studies in patients with epilepsy and depression, between 1999 and 2003. In all patients ∼370 MBq 11C-flumazenil was injected intravenously. All patients gave informed consent, and none of the patients had taken any benzodiazepines for at least 1 week prior to the study. All PET protocols were approved by the Medical Ethics Committee of the VU University Medical Center.
Sampling and analysis of 11C-flumazenil
As part of the scan procedure, seven arterial blood samples were taken from each patient at 2.5, 5, 10, 20, 30, 40 and 60 min after injection of 11C-flumazenil. Samples which were corrected for radioactive decay back to the time of injection were analysed using a validated HPLC method with both UV and radiometric detection [7–9]. This method was linear over a wide range of radio-activity levels (9.7 × 10⁻⁴ to 1.4 kBq). Precision ranged from ≤1% for samples taken after dosing (high activity) to 9% for samples taken late after dosing (low activity) [7].
Pharmacokinetic analysis
All analyses were performed using a nonlinear mixed effects modelling program (NONMEM, version V, level 1.1, Globomax LLC, Hanover, MD, USA). The FOCE method (First Order Conditional Estimation) with INTERACTION between interindividual and residual variability was used throughout. Standard errors for all parameters were calculated using the COVARIANCE option of NONMEM.
The performance of various models was evaluated using both graphical and statistical methods. The minimum value of the objective function (equal to minus twice the log likelihood of the data) was used to determine goodness-of-fit. An increase in the latter is reflected by a decrease in the objective function, and a change >6.6 points was considered a significant (P < 0.01) improvement in goodness-of-fit. Graphical analysis was performed using predicted vs. observed concentrations, individually predicted vs. observed concentrations, and predicted concentrations vs. weighted residuals.
Basic pharmacokinetic model
Based on data from unlabelled flumazenil a two compartment model with first-order elimination from the central compartment was chosen as a starting point for model development. For the two compartment model with bolus intravenous injection NONMEM subroutines ADVAN 3 and TRANS 4 were used. The entire population was used to estimate population means and coefficients of variation of the pharmacokinetic parameters for 11C-flumazenil. The distributions of individual clearance (CL), volumes of distribution (V1 (central) and V2 (peripheral)) and intercompartmental clearance (Q) were assumed to be log-normal, based on the following equation:
in which CLi is the clearance of the ith subject, CL is the typical value of the clearance of the whole population, and ηi is the intersubject variability of the ith subject (η is assumed to be normally distributed, with a mean of zero and a variance of ω2).
A full variance-covariance matrix was estimated for the different distributions of ηi. It was assumed that intrasubject (residual) variability could be described by a proportional error distribution as follows:
in which Cij is the jth concentration measurement from the ith patient, Cij the model predicted drug concentration of that individual, and ɛ the residual error (ɛ is assumed to be normally distributed, with a mean of zero and a variance of σ2). The residual error due to correction for radioactive decay was very small compared with the overall residual error and therefore was not taken into account. One and three compartment models were also tested.
Covariate model building
In order to establish possible relationships between pharmacokinetics of 11C-flumazenil and patient characteristics, the following covariates were defined: gender, type of disease (epilepsy or depression), weight and age. Effects of age and weight were examined as continuous variables, and type of disease and gender as dichotomous variables:
Model 1: θ1 × θ2SEX
Model 2: θ1 × θ2PROT
Model 3: θ1× (1 + θ2× (WGT −70))
Model 4: θ1× (1 + θ2× (AGE −33))
in which SEX is 0 for male and 1 for female, PROT is 0 for depression and 1 for epilepsy, and the continuous variables weight (WGT) and age (AGE) are related to the population means (70 kg and 33 years of age, respectively).
A covariate was included in an intermediate model when its addition to the basic model was both statistically significant (Δ objective function >−6.6, P < 0.01) and relevant. The latter was assumed when the typical value of a parameter changed at least 20% within the observed range of that covariate in the population. Finally, a stepwise backward elimination procedure was performed, in which each of the covariates was deleted sequentially. Again, a covariate was only retained in the model when its influence was statistically significant and relevant (as defined earlier).
The level of significance of those covariates that were included in the model was assessed using a randomization test, in which a large number of data sets was generated based on the null hypothesis (i.e. that the covariate is not related to the pharmacokinetic parameter). Wings for NONMEM (version 405) was used to perform the randomization test [10]. Data sets were generated by random permutation of the empirical distribution of the covariate in the original data set. The final model was applied to these data sets. The distribution of the difference in objective function between models with and without the randomly permutated covariate was obtained and the level of significance calculated. For each significant covariate that remained in the model, at least 1000 data sets were generated.
Model validation
Internal model validation was performed using the bootstrap option of Wings for NONMEM. Bootstrap replicates were generated by randomly sampling 65% from the original data set with replacement. The final model was fitted to over 2000 of these replicate data sets and parameter estimates were obtained. The stability of the model was evaluated by visual inspection of the distribution of the model parameters. Furthermore, the median parameter values and the 2.5–97.5 percentile of the bootstrap replicates were compared with the estimates of the original data set [11].
Optimal sampling
Based on the results of the parameter estimates obtained in the population analysis, different sampling strategies were investigated. These were aimed at minimizing the number of arterial blood samples needed for routine 11C-flumazenil studies. To this end, three practical considerations were taken into account. First, sampling was within 60 min after injection because of the rapid decay of 11C and the duration of the PET procedure. Second, no samples were taken during the first 10 min after injection, as this would significantly disturb the on-line curve. Third, sampling times should ideally be at least 20 min apart, in order that a single HPLC system can be used. Because of these practical considerations, a maximum of two sampling times was chosen. A Bayesian method was used to perform the optimal sampling analysis [12]. The area under the curve (AUC) was chosen as representative parameter for the pharmacokinetics of 11C-flumazenil, as the input curve is one of the factors used to quantify the benzodiazepine receptor density in the brain. For each sampling strategy, 1000 simulated data sets (consisting of the same population as included in the final analysis) were generated based on the pharmacokinetic parameter estimates from the original data set. For each individual a true CL was simulated (using the ONLYSIMULATION option). Next, Bayesian estimates of individual predicted CL values were generated with the POSTHOC option of NONMEM. Observed and predicted individual AUC values were calculated from the equation:
Using these AUC values, the relative prediction error (PE) was calculated for each individual from the equation:
To avoid bias towards high values of the AUC, the relative prediction error (PE) was calculated using its natural logarithm. This was also in concordance with the assumption that true and predicted AUC values were log-normally distributed. PEs were used to calculate the percentage mean prediction error (%MPE) and the percentage root mean squared prediction error (%RMSE) with their standard errors per simulated data set (equations 9 and 10). By repeating this procedure at least 1000 times, prediction intervals for %RMSE and %MPE could be estimated. The latter is a measure of bias, the former a measure of precision.
 |
 |
in which n is the number of AUC pairs (i.e. calculated and predicted values) [13]. Finally, the optimal sampling strategy was tested using cross-validation. First, reference values for the AUC were generated for each patient in the original data set, using noncompartmental analysis (WinNonlin professional 4.1, Pharsight, Mountain View, CA, USA) with the log-trapezoidal rule and extrapolation to infinity. Next, the original data set was randomly divided into five groups. The final model was tested for data from four of these five groups. The pharmacokinetic parameters from these analyses were then used for a Bayesian estimation of the AUC values for the remaining group, using only the data points from the final optimal sampling procedure. This procedure was repeated five times, in order to obtain a predicted AUC for all patients. Again, performance was assessed using bias (%MPE) and precision (%RMSE).
Results
Data from 51 patients were available, and their characteristics are presented in Table 1. A total number of 330 11C-flumazenil plasma concentrations were available for pharmacokinetic analysis. Drug concentration vs. time curves for all patients are shown in Figure 2. One patient showed significantly higher blood concentrations of 11C-flumazenil due to premature injection, resulting in a higher dose of radioactivity.
Table 1.
Characteristics of the study population
| Parameter | Mean | Median | Range |
|---|---|---|---|
| Gender M/F | 26/25 | – | – |
| Disease E/D | 34/17 | – | – |
| Weight (kg) | 69.7 | 75 | 38–105 |
| Age (year) | 32.8 | 36 | 11–54 |
| Height (cm) | 171.7 | 177 | 150–197 |
M, male; F, female; E, epilepsy; D, depression.
Figure 2.
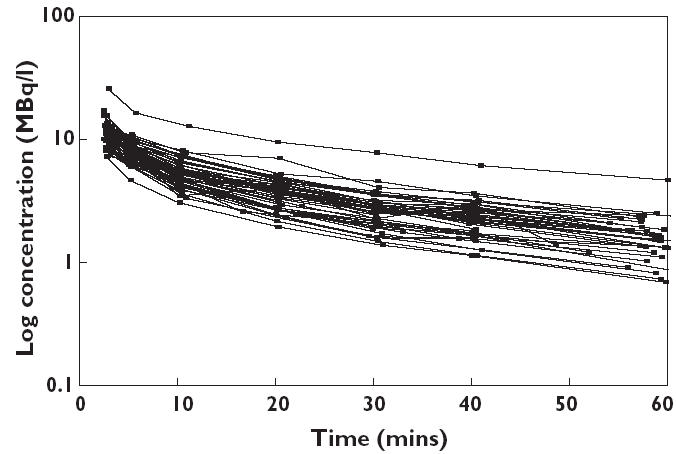
log concentration of 11C-flumazenil as function of time for all subjects
The results of the basic two compartment pharmacokinetic model are summarized in Table 2. Figure 3 shows both model predicted and individually predicted concentrations against observed concentration of 11C-flumazenil using this two compartment model. The one compartment model gave inferior results for the Objective Function, and the three compartment model did not show any improvement. Visual inspection showed no difference between the two and three compartment models, whereas the one compartment model was significantly worse with major differences between observed and predicted plasma concentrations. Thus, the two compartment model was chosen as the basic model.
Table 2.
Pharmacokinetic parameters of the basic two-compartment model, the final model including covariates, and the results using the Bootstrap Validation Procedure
| Parameter | Basic model, No covariates Original data set Estimate (COV*) | Final model, Including covariates Original data set Estimate (COV*) | Final model, including covariates Bootstrap replicates Median (2.5–97.5%) |
|---|---|---|---|
| Structural model cursive | |||
| CL (mL min−1) | 1330 (4.3) | 1530 (6.6) | 1530 (1.36–1.75) |
| CL, type of disease† | – | 0.80 (8.6) | 0.80 (0.68–0.92) |
| V1 (× 1000 mL) | 24.5 (4.4) | 24.8 (3.8) | 24.8 (22.8–26.7) |
| V1, weight (%)‡ | – | 0.55 (27.1) | 0.56 (0.26–1.33) |
| V2 (× 1000 mL) | 27.5 (6.5) | 27.3 (5.4) | 27.4 (24.7–30.3) |
| Q (mL min−1) | 2580 (9.2) | 2510 (6.5) | 2520 (2.20–2.87) |
| Interindividual variability (ω) | |||
| CoCL (%) | 25.1 (23.7) | 25.2 (22.5) | 25.0 (19.3–30.4) |
| CoV1 (%) | 22.6 (58.2) | 21.7 (26.9) | 20.7 (11.5–29.9) |
| CoV2 (%) | 20.2 (56.3) | 31.6 (35.1) | 85.7 (34.3–99.6) |
| CoQ (%) | 31.0 (49.5) | 20.9 (45.0) | 73.3 (19.9–97.1) |
| Residual variability cursive | |||
| Proportional error (%) | 8.26 (25.4) | 8.16 (24.2) | 7.92 (6.42–9.64) |
COV, % coefficient of variation;
Effect of disease (epilepsy) on plasma clearance of 11C-flumazenil;
Effect per kg body weight (scaled to 70 kg) on the central volume of distribution of 11C-flumazenil.
Figure 3.
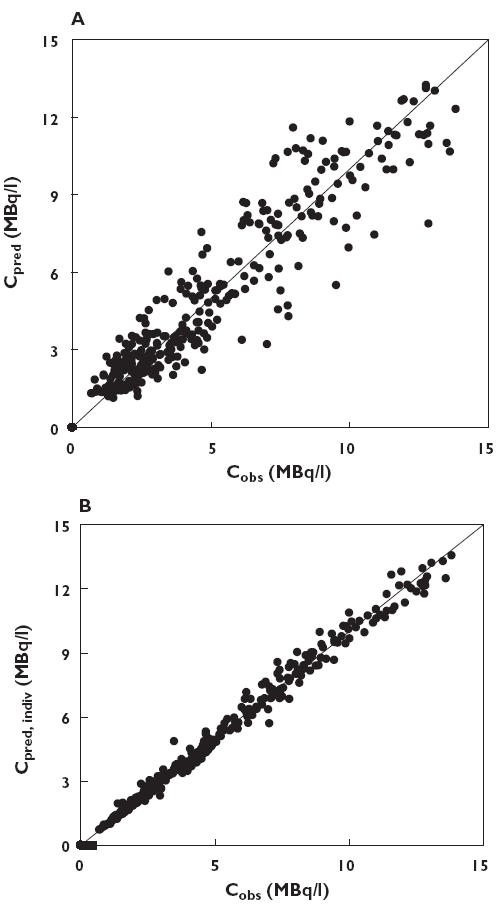
(A) Model predicted plasma concentration (Cpred) and (B) individual predicted plasma concentration (Cpred, indiv) plotted against observed plasma concentration (Cobs). Predictions were obtained using the two compartment model without covariates. The solid line represents the line of identity
The next step was to add different covariates to the basic model. The type of disease was significantly related to CL and weight to V1 and V2. In the stepwise backward elimination procedure, the influence of weight on V2 proved nonsignificant and was removed from the final model. The latter was subjected to the randomization test, which showed that type of disease was significantly related to CL (P < 0.002) and weight to V1 (P < 0.002). The final population estimates of the pharmacokinetic parameters of 11C-flumazenil are summarized in Table 2. Estimated half-life was 3 min for the first and 28 min for the second elimination phase.
In the type of disease analysis, epilepsy changed the clearance of 11C-flumazenil by −20% from the mean value of 1530 mL min−1, and the influence of weight on V1 was + 0.55% per kg scaled for a mean weight of 70 kg. All parameters were estimated with a very low coefficient of variation (3.8–6.6%). Figure 4 shows the plots of the weighted residuals against the predicted concentrations of 11C-flumazenil based on the two compartment model, and Figure 5 the plots of the weighted residuals against time. In Figure 6, model predicted and individually predicted plasma concentrations are shown. The model-based predictions are distributed symmetrically around the line of identity (Figure 6A) and it is evident that the model can accurately predict individual plasma concentrations (Figure 6B).
Figure 4.
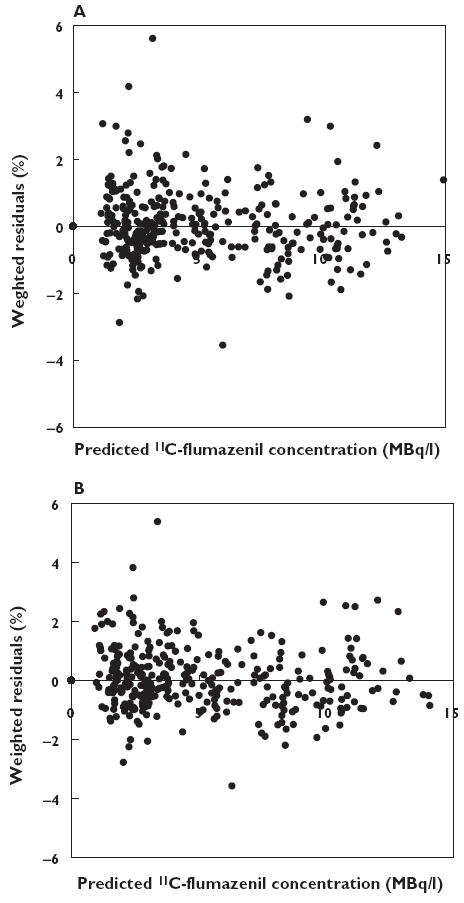
Weighted residuals against predicted concentrations using the two compartment model without (A) and with (B) covariates
Figure 5.
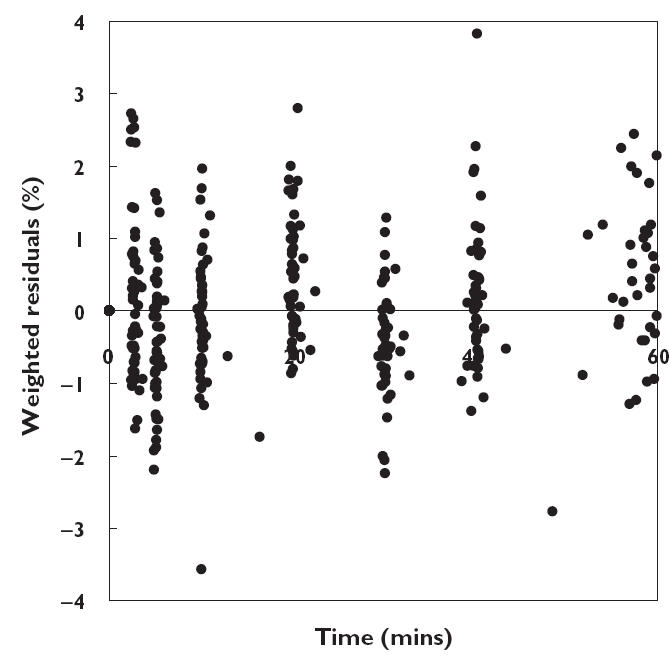
Weighted residuals of the two compartment model with covariates as function of time
Figure 6.
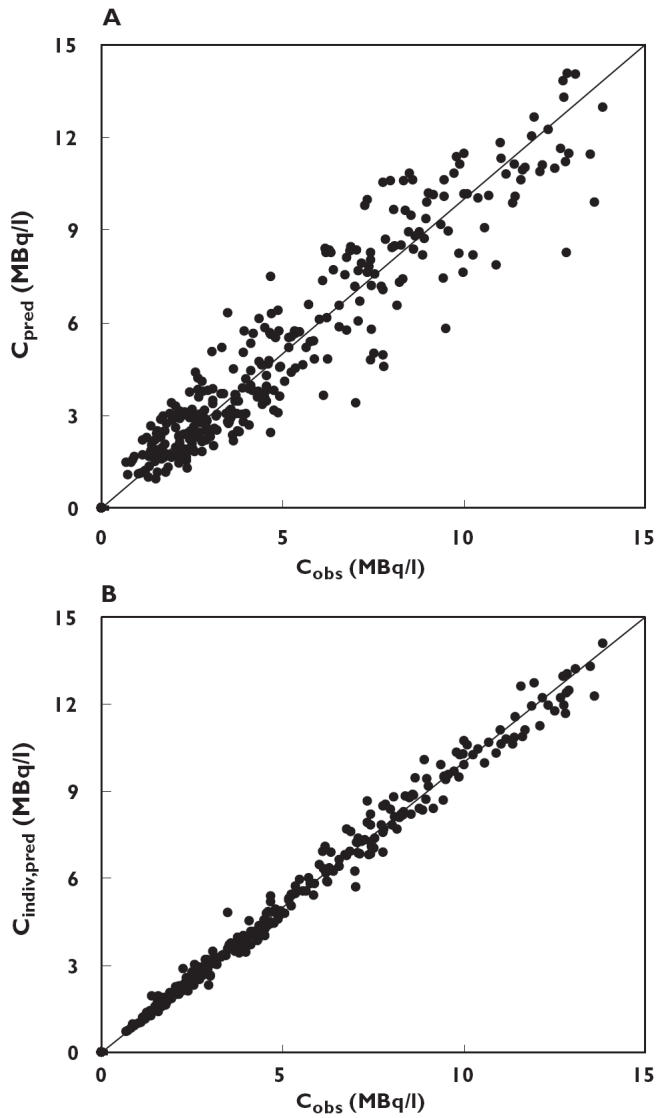
(A) Model predicted plasma concentration (Cpred) and (B) individual predicted plasma concentration (Cpred, indiv) plotted against observed plasma concentration (Cobs). Predictions were obtained using the final model including covariates. The solid line represents the line of identity
Table 2 lists the results of the bootstrap procedure (n = 2000), presented as median and 2.5–97.5 percentiles. Comparison with the original data set resulted in similar figures, indicating that the model is precise. The only exception was the interindividual variability in V2 and Q, which was larger in the bootstrap analysis. Visual analysis of the data showed that all parameters were normally distributed.
The different sampling protocols tested, together with the corresponding results, are summarized in Table 3. All sampling schemes, including the single sample protocols were unbiased (no significant %MPE) and reasonably precise (%RMSE <15%). In general, any sampling scheme with at least one sample taken at 30 min or longer after dosing was acceptable. Sampling at later time points (preferably at 60 min) gave better precision than sampling early after injection (<20 min). When all seven samples were included, the bias was −0.8% (−2.0 to 0.4%) and precision 4.3% (3.4–5.2%). Based on practical considerations, optimum was sampling at t = 30 and t = 60 min. This protocol gave the best precision with a %RMSE of 5.7% (4.5–6.9%), and had further advantages in that it requires no sampling before t = 10 min, and only one HPLC system. Cross-validation results for this sampling protocol are shown in Figure 7, in which experimental AUC values are plotted against predicted values.
Table 3.
Predictive performance of the different sampling schemes with respect to the pharmacokinetics of 11C-flumazenil
| Scheme | Number of samples | Sampling times (min) | %MPE (95%CI) | %RMSE (95%CI) | |
|---|---|---|---|---|---|
| 1 | 1 | 10 | – | −2.6 (−5.7–0.6) | 12.1 (9.7–14.9) |
| 2 | 1 | 20 | – | −1.3 (−4.2–1.4) | 10.2 (8.2–12.5) |
| 3 | 1 | 30 | – | −1.3 (−3.8–1.0) | 8.9 (7.1–10.8) |
| 4 | 1 | 40 | – | −1.3 (−3.4–0.8) | 7.9 (6.3–9.6) |
| 5 | 1 | 50 | – | −1.1 (−3.1–0.9) | 7.2 (5.8–8.8) |
| 6 | 1 | 60 | – | −0.8 (−2.8–1.2) | 7.0 (5.5–8.5) |
| 7 | 2 | 5 | 30 | −1.7 (−3.7–0.7) | 8.2 (6.5–9.9) |
| 8 | 2 | 5 | 45 | −1.5 (−3.3–0.3) | 6.8 (5.4–8.4) |
| 9 | 2 | 5 | 60 | −1.3 (−2.9–0.3) | 6.1 (4.9–7.4) |
| 10 | 2 | 10 | 40 | −1.2 (−3.0–0.8) | 7.3 (5.9–8.8) |
| 11 | 2 | 10 | 60 | −1.0 (−2.5–0.6) | 6.1 (4.9–7.4) |
| 12 | 2 | 15 | 45 | −1.0 (−2.7–0.9) | 6.8 (5.5–8.3) |
| 13 | 2 | 15 | 60 | −0.7 (−2.3–0.9) | 6.0 (4.8–7.3) |
| 14 | 2 | 20 | 50 | −0.8 (−2.5–0.9) | 6.4 (5.1–7.7) |
| 15 | 2 | 20 | 60 | −0.7 (−2.2–0.9) | 5.9 (4.7–7.1) |
| 16 | 2 | 30 | 60 | −0.7 (−2.2–0.8) | 5.7 (4.5–6.9) |
95% CI, 95% confidence interval; %MPE, percentage mean prediction error; %RMSE, percentage root mean squared predictive error.
Figure 7.
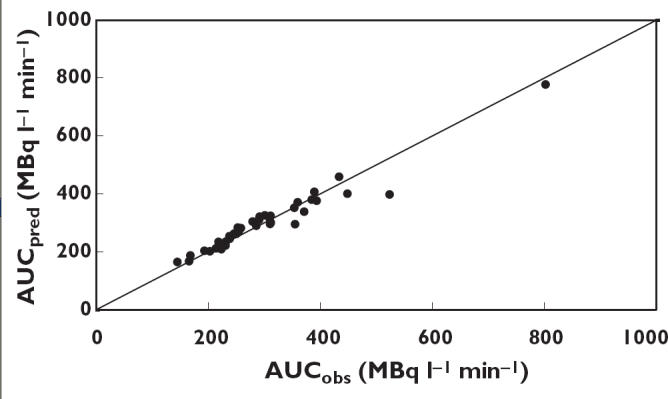
Predicted values of AUC (AUCpred) based on the optimal sampling protocol against measured values of AUC (AUCobs). The solid line represents the line of identity
The data from one patient were left out of the validation procedure, because no samples were available after 20 min. All patients providing two samples (at t = 30 and t = 60 min) were included (n = 38). In addition, all patients providing one at either 30 or 60 min (n = 12) were included. The experimental AUC was 296 MBq L−1 min−1(95% CI 102–490) and the predicted value was 288 MBq L−1 min−1 (95% CI 70–506). Bias was nonsignificant (4.0% (95% CI −15.1 to 23.1%)), and precision was acceptable (10.3% (95% CI 7.1–13.5%)).
Discussion
The aims of the present study were to characterize the plasma pharmacokinetics of 11C-flumazenil at tracer concentrations, to define significant covariates and to establish an optimal sampling protocol. The pharmacokinetics of 11C-flumazenil as tracer were best described by a two compartment model. The type of disease proved to be a significant covariate for the clearance of 11C-flumazenil, which was 20% lower in patients with epilepsy. The reason for this effect is as yet unknown, and probably cannot be accounted for. Inhibition of the hydrolysis of flumazenil by anticonvulsant medication was rejected because of the large amount of carboxylesterase present in the human body. An increase in body weight of 1 kg (scaled to 70 kg) caused an increase of 0.55% in volume of distribution. However, the interindividual variability in peripheral volume of distribution and intercompartmental clearance was increased rather than decreased. In addition, the relationship between observed and predicted concentrations, did not improve with the addition of covariates. These observations indicate that, although the above covariates make a statistically significant contribution to the pharmacokinetics of 11C-flumazenil, they are probably not clinically relevant.
The parameters estimated for 11C-flumazenil are close to those reported for unlabelled flumazenil, indicating that the pharmacokinetics of tracer and pharmacological doses of the drug are similar [5]. It is evident that the total plasma clearance of 11C-flumazenil (1580 mL min−1) is of the same magnitude as normal liver blood flow (1000–1500 mL min−1), indicating a very high hepatic extraction ratio.
Using the proposed model, pharmacokinetic parameters for 11C-flumazenil were estimated with high degree of precision. When the number of arterial blood samples was decreased to two taken at 30 and 60 min, the prediction of 11C-flumazenil plasma AUC was excellent, with a precision of 5.7%. Theoretically it is possible to collect only one plasma sample (at a time later than 30 min after dosing) and still maintain good precision. However, taking two samples decreases the risk of sampling failure. If one sample is compromised, the second can still be used for adequate prediction of the pharmacokinetic parameters. These results indicate that it should be possible to decrease the number of manual arterial plasma samples during an 11C-flumazenil PET scan. However, a prospective study is required to confirm these findings.
Competing Interests
None declared.
References
- 1.Klotz U, Kanto J. Pharmacokinetics and clinical use of flumazenil (Ro 15–1788) Clin Pharmacokinet. 1988;14:1–12. doi: 10.2165/00003088-198814010-00001. [DOI] [PubMed] [Google Scholar]
- 2.Halldin C, Stone-Elander S, Thorell JO, Persson A, Sedvall G. 11C-labelling of Ro 15–1788 in two different positions, and also 11C-labelling of its main metabolite Ro 15–3890, for PET studies of benzodiazepine receptors. Int J Rad Appl Instrum. 1988;39:993–7. doi: 10.1016/0883-2889(88)90044-5. [DOI] [PubMed] [Google Scholar]
- 3.Koeppe RA, Holthoff VA, Frey KA, Kilbourn MR, Kuhl DE. Compartmental analysis of [11C]flumazenil kinetics for the estimation of ligand transport rate and receptor distribution using positron emission tomography. J Cereb Blood Flow Metab. 1991;11:735–44. doi: 10.1038/jcbfm.1991.130. [DOI] [PubMed] [Google Scholar]
- 4.Lassen NA, Bartenstein PA, Lammertsma AA, Prevett MC, Turton DR, Luthra SK, Osman S, Bloomfield PM, Jones T, Patsalos PN. Benzodiazepine receptor quantification in vivo in humans using [11C]flumazenil and PET. application of the steady-state principle. J Cereb Blood Flow Metab. 1995;15:152–65. doi: 10.1038/jcbfm.1995.17. [DOI] [PubMed] [Google Scholar]
- 5.Amrein R, Hetzel W. Pharmacology of drugs frequently used in ICUs: midazolam and flumazenil. Intensive Care Med. 1991;17S1:S1–10. doi: 10.1007/BF01731147. [DOI] [PubMed] [Google Scholar]
- 6.Debruyne D, Abadie P, Barre L, Albessard F, Moulin M, Zarifian E, Baron JC. Plasma pharmacokinetics and metabolism of the benzodiazepine antagonist [11C]Ro 15–1788 (flumazenil) in baboon and human during positron emission tomography. Eur J Drug Metab Pharmacokinet. 1991;16:141–52. doi: 10.1007/BF03189951. [DOI] [PubMed] [Google Scholar]
- 7.Greuter HNJM, van Ophemert PLB, Luurtsema G, Franssen EJF, Boellaard R, Lammertsma AA. Validation of a multiwell ã-counter for measuring high-pressure liquid chromatography metabolite profiles. J Nucl Med Technol. 2004;32:28–32. [PubMed] [Google Scholar]
- 8.Luthtra SK, Osman S, Turton DR, Vaja V, Dowsert K, Brady F. An automated system based on solid phase extraction and HPLC for routine determination in plasma of unchanged [11C]-l-deprenyl, [11C]diprenorphine, [11C]flumazenil, [11C]raclopride and [11C]schering 23390. J Labeled Comp Radiopharm. 1993;32:518–20. [Google Scholar]
- 9.Pike VW, Halldin C, Crouzel C, Barre L, Nutt DJ, Osman S, Shah F, Turton DR, Waters SL. Radioligands for PET Studies of Central Benzodiazepine Receptors and PK (Peripheral Benzodiazepine) Binding Sites-Current Status. Nuc Med Biol. 1993;20:503–25. doi: 10.1016/0969-8051(93)90082-6. [DOI] [PubMed] [Google Scholar]
- 10.Holford NHG. Wings for NONMEM. [September 2003]; http://wfn.sourceforge.net/ accessed.
- 11.Parke J, Holford NH, Charles BG. A procedure for generating bootstrap samples for the validation of nonlinear mixed-effects population models. Comput Meth Programs Biomed. 1999;59:19–29. doi: 10.1016/s0169-2607(98)00098-4. [DOI] [PubMed] [Google Scholar]
- 12.Huitema ADR, Mathôt RAA, Tibben MM, Schellens JHM, Rodenhuis S, Beijnen JH. Validation of techniques for the prediction of carboplatin exposure: Application of Bayesian methods. Clin Pharmacol Ther. 2000;67:621–30. doi: 10.1067/mcp.2000.106827. [DOI] [PubMed] [Google Scholar]
- 13.Beal SL, Sheiner LB. Some suggestions for measuring predictive performance. J Pharmacokinet Biopharm. 1981;9:503–12. doi: 10.1007/BF01060893. [DOI] [PubMed] [Google Scholar]