Abstract
Aims
Our objective was to develop a population pharmacokinetic (PPK) model for epinastine, a histamine H1 receptor antagonist, in adults and children and to obtain pharmacokinetic information to support dosing recommendations in children.
Methods
A total of 1510 plasma samples were collected from 62 healthy adult volunteers and 62 paediatric atopic dermatitis patients. The data were analysed using the NONMEM program according to a two-compartment model with first-order absorption. In addition, the final PPK model was evaluated by means of bootstrapping resampling.
Results
The oral clearance (CL/F) was found to be associated with body weight, formulation and food status. The volume of distribution of the central compartment (V1/F) was related to body weight and food status. An absorption lag time was apparent in fed subjects. On the other hand, other covariates (formulation on V1/F, volume of distribution of the peripheral compartment (V2/F), first-order absorption rate constant (Ka) and absorption lag time (ALAG); food status on V2/F and Ka; body weight on V2/F) were not statistically significant. No effect of age on CL/F, V1/F or V2/F was found. The mean parameter estimates obtained with an additional 200 bootstrap replicates of data were within 90–117% of those obtained with the original data set. These results suggest that the pharmacokinetics of epinastine are similar in adults and in children, except for the effect of the difference of body weight. The result of the application of the PPK model to the clinical trial in paediatric patients, in which dosage was determined based on the body weight (from14 kg to less than 24 kg; 10 mg dose, 24 kg or more; 20 mg dose), showed that the Cmax and AUC (25.6 ± 6.9 ng ml−1 and 246.8 ± 68.2 ng h ml−1) were almost same levels with those of adults after administration of 20 mg (26.9 ± 9.1 ng ml−1 and 281.6 ± 90.5 ng h ml−1).
Conclusions
A PPK model for epinastine was established and further evaluation by bootstrapping indicated that this model is stable. The model shows that, if dosage is adjusted based on the body weight, the epinastine exposure in paediatric patients is similar to that in adults.
Keywords: epinastine, population pharmacokinetics, adult, child, paediatric dosage
Introduction
Epinastine is a histamine H1 receptor antagonist and a nonsedative antiallergic drug [1, 2]. Based on its physicochemical properties, such as hydrophilicity and cationic charge in the physiological pH range, it was assumed that epinastine does not readily enter the central nervous system, and indeed epinastine penetrates very poorly into the human brain as shown by positron emission tomography (PET) [3–5]. The absolute bioavailability of epinastine is about 40% and a linear relationship was demonstrated between epinastine dose and both Cmax and AUC after administration of epinastine in the dose range of 10–40 mg [6]. Epinastine is poorly metabolized by human liver microsomes. Following a single oral dose of 20.6 mg [14C] epinastine to healthy volunteers, about 70% of 14C activity (per cent of dose) was found in the faeces and about 25% of administered dose was recovered in urine.
In Japan, epinastine has been used as tablets for the treatment of bronchial asthma, allergic rhinitis and skin diseases with pruritus in adult patients. Epinastine is prescribed for patients at a dose of 10–20 mg once daily. Recently, a dry syrup formulation has been developed for paediatric patients. However, the dose should be adjusted for paediatric patients. Pharmacokinetic data can support the development of paediatric formulations, and evaluation of the pharmacokinetic behaviour of a drug in children can be useful as a basis for dosing recommendations. As frequent blood sampling in children is undesirable for ethical and practical reasons, the use of population pharmacokinetics and sparse sampling based on optimal sampling theory to minimize the number of samples required from each patient is a useful approach to minimize the amount of blood drawn [7, 8].
So, we collected small numbers of blood samples from paediatric patients in a phase III open-label trial [9] and performed a PPK analysis using these data together with the adult data. The objective of this study was to develop a PPK model for epinastine in adult subjects and paediatric patients, and not only to identify the factors that affect the pharmacokinetics of epinastine, but also to obtain pharmacokinetic information that would support dosing recommendations in children.
Methods
Subjects and trial design
A total of 1510 plasma concentration data were collected from 124 subjects (62 healthy adult subjects, 62 paediatric atopic dermatitis patients) who participated in six clinical trials conducted in Japan (Table 1).
Table 1.
Sources of plasma epinastine concentration data collected in clinical trials
| Trial no | Subjects | Dose (mg) | Formulation | Number of subjects | Number of measurements |
|---|---|---|---|---|---|
| 1 | Children with atopic dermatitis | 10, 20 | Dry syrup | 62 | 179 |
| 2 | Healthy male volunteers | 20 | Tablet | 18 | 214 |
| Dry syrup | 217 | ||||
| 3 | Healthy male volunteers | 10, 20, 40 | Tablet | 9 | 95 |
| 4 | Healthy male volunteers | 20 | Tablet | 12 | 373 |
| 5 | Healthy male volunteers | 20 | Tablet | 7 | 94 |
| 6 | Healthy male volunteers | 20 | Tablet | 16 | 338 |
All studies were performed in accordance with the Declaration of Helsinki with the ethics approval in each institution, and with the written informed consent of each subject.
Trial 1 was a phase III open-label trial performed to obtain the safety data in paediatric patients with atopic dermatitis [9]. In this trial, small numbers of blood samples were collected to obtain pharmacokinetic data in paediatric patients. Sixty-two patients were given 10 or 20 mg epinastine as dry syrup once daily for 12 weeks. Dosage was determined according to body weight in this trial. Patients weighing from 14 kg to less than 24 kg and those weighing 24 kg or more were given 10 mg and 20 mg epinastine, respectively. Three blood samples were drawn from the vein of each patient at 2–6 weeks, 6–10 weeks and 10–14 weeks after the first administration. The trials described in the following were all performed in healthy male subjects. Trial 2 was a bioequivalence study of 2.0 g dry syrup (containing 20 mg epinastine) compared with 20 mg tablets, performed in 18 healthy male subjects in a cross-over design. In trial 3, pharmacokinetic data were obtained after single oral administration of 10, 20 or 40 mg epinastine tablets in 9 healthy male subjects [6]. Trial 4 provided pharmacokinetic data after multiple oral administration in healthy male subjects [6]. Twelve subjects were given a 20 mg epinastine tablet once or twice daily for 7 days. Trial 5 was a chronopharmacological trial in which 20 mg epinastine was administered as tablets to seven healthy male subjects [10]. Trial 6 investigated the effect of food. Sixteen healthy male subjects received 20 mg epinastine tablets orally as a single dose in a fasted or fed state. This trial was performed in a cross-over design.
Analysis of epinastine
Plasma concentrations of epinastine in paediatric patients were determined by means of a validated high-performance liquid chromatography combined with triple-stage mass-spectrometry (HPLC-MS/MS) method. In brief, sample preparation was based on liquid-liquid extraction using diethyl ether, and then back-extraction with 0.5% formic acid. Chromatographic separation was achieved on an Inertsil ODS2 reversed-phase analytical column (5 µm, 150 × 2.1 mm) and HPLC-MS/MS with electrospray ionization in the positive mode was used for detection of analytes. The limit of quantification was 0.6 ng ml−1. Intra- and interday variation of assay precision was less than 9.9% and the average bias was within 2.0%.
All plasma samples collected from adults in the five clinical studies were analysed by means of the same validated HPLC method. The method involves solid phase extraction and derivatization of epinastine with dansylchloride, followed by isocratic separation (column: Lichrosorb Si60, 7 µm, 250 × 4.0 mm) and fluorescence detection (excitation 355 nm, emission 535 nm). The limit of quantification was 2 ng ml−1. Intra- and interday variation of assay precision was less than 7.7% and the average bias was within 13%.
All samples were measured at the Department of Drug Metabolism and Pharmacokinetics, Kawanishi Pharma Research Institute, Nippon Boehringer Ingelheim Co., Ltd.
Demographic background of the subject population
Demographic and clinical characteristics of the subjects are summarized in Table 2. A total of 124 subjects (62 healthy adult volunteers and 62 paediatric patients) were enrolled in the study. A total of 1510 observations (1331 from healthy adult volunteers and 179 from paediatric patients) were used for analysis. The pooled study subjects comprised 100 males and 24 females. The ages of healthy adult subjects or paediatric patients ranged from 20 to 26, and from 2 to 15 years old, respectively, and the body weights from 50 to 82 kg, and from 14.1 to 68 kg, respectively. These subjects were given 10, 20 or 40 mg epinastine daily. Epinastine was administered as tablet or dry syrup to subjects in a fed or fasted state.
Table 2.
Description of the population participating in the present study
| Total number of subjects | 124 | |
| Number of healthy adult volunteers | 62 | |
| Number of atopic dermatitis patients | 62 | |
| Adult | Child | |
|---|---|---|
| Gender | ||
| Male | 62 | 38 |
| Female | 0 | 24 |
| Dose | ||
| 10 mg | 9 | 15 |
| 20 mg | 62 | 47 |
| 40 mg | 9 | – |
| Formulation | ||
| Tablet | 62 | – |
| Dry syrup | 18 | 62 |
| Food status | ||
| Fasting state (Number of measurements) | 607 | 10 |
| Non-fasting state (Number of measurements) | 724 | 169 |
| Age (year) | 22.3 ± 1.7* | 10.2 ± 3.8 |
| [20–26]† | [2–15] | |
| Weight (kg) | 63.0 ± 6.9 | 36.9 ± 15.5 |
| [50–82] | [14.1–68] | |
Mean ± SD,
Minimum–maximum values.
Model development
The analysis was performed using the NONMEM program (double precision, version V, Globo Max LLC, Hanover, MD, USA) [11]. The first-order method was used.
An additive error model, an exponential error model and a combined error model were evaluated to describe the residual variability.
The minimum value of the NONMEM objective function (MOF) was used to discriminate between various models during the model-building process. The difference in the MOF values obtained for the general and restricted models is approximately χ2 distributed with degrees of freedom equal to the number of fixed parameters in the restricted model. A difference in MOF of 3.8 for 1 degree of freedom (P < 0.05) was considered statistically significant during the full model building.
Step 1: Basic population model for adults
In order to determine the basic population model, one- and two-compartment pharmacokinetic models with first-order absorption were tested. The modelling of intraindividual variability, the additive error model, exponential error model and combined error model were compared. The necessity of interindividual variability for each pharmacokinetic parameter was investigated.
Step 2: Modelling of covariates for adults
Covariates considered for inclusion in the regression analysis were food status (fasted or fed) and formulation (tablet or dry syrup).
Covariates were incorporated stepwise into the basic model to develop a full model. Once the full model was developed, each covariate was tested by removing it, to see if it should remain in the model, using a more stringent difference in MOF of 6.63 (P < 0.01).
Step 3: Modelling of covariates for adults and children
The effect of age was modelled separately for the two groups, adult subjects and paediatric patients, because the age ranges did not overlap, as shown in Table 2, and the range of age in adults was narrow (20–26 years).
Covariates were incorporated stepwise into the basic model to develop a full model. Once the full model was developed, each covariate was tested by removing it, to see if it should remain in the model, using a more stringent difference in MOF of 6.63 (P < 0.01).
Simulation
In order to evaluate the effect of covariates on plasma concentration of epinastine, typical plasma profiles were predicted for various subject subgroups. These were calculated using a two-compartment model with first-order absorption. The software used was Microsoft Excel® 97.
Non-compartmental analysis
Individual pharmacokinetic parameters (Cmax and AUC) in noncompartmental analysis for adult subjects were calculated using WinNonlin® professional software (version 3.1, Pharsight Corporation, Mountain View, CA, USA). As the blood samples collected from the paediatric patients were too few to allow calculation of the pharmacokinetic parameters for each subject, the comparisons between the pharmacokinetic parameters predicted by the PPK model and determined by the noncompartmental analysis were only performed for adult data.
Model validation
The bootstrap resampling method was used to evaluate the stability of the final model [12]. The final PPK model was fitted repeatedly to 200 additional bootstrap samples. The mean pharmacokinetic parameters calculated with parameter estimates obtained from the 200 bootstrap replications were compared with those calculated with parameter estimates obtained from the original data set.
Results
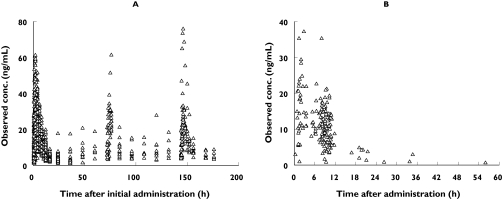
Figure 1 shows the plasma concentration-time data of epinastine used for the present population pharmacokinetic analysis in healthy adults (left panel) and paediatric patients (right panel).
Figure 1.
Observed plasma concentrations and sampling times of epinastine in (A) healthy adults after the initial dose and (B) paediatric atopic dermatitis patients in the steady state
Model building
Step 1: Basic population model for adults
The basic PPK model was a two-compartment model with first-order absorption. Interindividual variability was necessary for CL/F, V1/F, Q, V2/F and Ka. The combined error model was best for modelling of intraindividual variability compared with the additional error model and exponential error model.
Step 2: Modelling of covariates for adults
Starting from a simple structural model, covariates that were considered likely to influence the pharmacokinetics of epinastine were added one by one and tested for statistical significance (forward selection method). For CL/F, V1/F, V2/F, Ka and ALAG, covariates, such as food status and formulation were tested.
Among the examined covariates, food status on CL/F, V1/F and ALAG, and formulation on CL/F significantly improved the population model (P < 0.05). The covariate with the largest effect was food status on CL/F (ΔMOF = 93.00). Other covariates, formulation on V1/F, food status and formulation on V2/F, food status and formulation on Ka, and formulation on ALAG, were not statistically significant. Food status and formulation were then combined in the following full model.
CL/F(litres h−1) = θ1 FOODCL/F FORMCL/F exp(ηCL/F)
Model refinement was then done by backward selection, in which statistically insignificant covariates were removed from the above full model. Remaining statistically significant factors (P < 0.01) provided the PPK model for adult subjects. Through this process, no covariate was removed from the full model.
Step 3: Modelling of covariates for adults and children
After building the PPK model for adult subjects, data from paediatric patients were combined with the adult data and a PPK model for adult subjects and children was developed. The effects of body weight and age were investigated on CL/F, V1/F and V2/F.
Among covariates examined for CL/F, V1/F and V2/F, body weight on CL/F and V1/F significantly improved the population model (P < 0.05). Other covariates, body weight on V2/F, and age on CL/F, V1/F and V2/F, were not statistically significant. Model refinement was then done by backward selection, in which statistically insignificant covariates were removed from the above full model, and remaining statistically significant factors (P < 0.01) provided the final PPK model. Through this process, no covariate was removed from the full model (Table 3).
Table 3.
Hypothesis testing for possible factors affecting pharmacokinetics of epinastine
| θ | Factor | Parameter | Estimated value | Hypothesized value | δMOF | P-value |
|---|---|---|---|---|---|---|
| θ6 | Food status | CL/F | 1.41 | 1 | −135.72 | P < 0.01 |
| θ7 | Food status | V1/F | 1.75 | 1 | −130.56 | P < 0.01 |
| θ8 | Food status | ALAG | 0.234 | 0 | −21.39 | P < 0.01 |
| θ9 | Formulation | CL/F | 1.06 | 1 | −7.87 | P < 0.01 |
| θ10 | Body weight | CL/F | 0.805 | 0 | −119.40 | P < 0.01 |
| θ11 | Body weight | V1/F | 3.95 | 0 | −16.84 | P < 0.01 |
The final model is described by the following equations.
The PPK parameter estimates given by this model are summarized in Table 4.
Table 4.
Final estimates for population pharmacokinetic parameters of epinastine
| Final model equations | ||
| CL/F = (q1+ WT θ10) FOODCL/F FORMCL/F | ||
| V1/F = (θ2+ WT θ11) FOODV1/F | ||
| Q = θ3 | ||
| V2/F = θ4 | ||
| Ka = θ5 | ||
| ALAG = FOODALAG | ||
| FOODCL/F = θ6 if fed, 1 if fasted | ||
| FORMCL/F = θ9 if dry syrup, 1 if tablet | ||
| FOODV1/F = θ7 if fed, 1 if fasted | ||
| FOODALAG = θ8 if fed, 0 if fasted | ||
| Parameter | Estimate | SE |
|---|---|---|
|
| ||
| θ1 | 19.1 | 6.93 |
| θ2 | 174 | 68.4 |
| θ3 | 34.4 | 4.05 |
| θ4 | 452 | 106 |
| θ5 | 1.18 | 0.102 |
| θ6 | 1.41 | 0.0839 |
| θ7 | 1.75 | 0.169 |
| θ8 | 0.234 | 0.0354 |
| θ9 | 1.06 | 0.0601 |
| θ10 | 0.805 | 0.137 |
| θ11 | 3.95 | 1.04 |
|
| ||
| Interindividual variability (CV%) | ||
| ωCL/Φ = 31.8% | ||
| ωV1/F = 32.7% | ||
| ωQ = 47.5% | ||
| ωV2/F = 119.6% | ||
| ωKa = 56.8% | ||
| Residual variability | ||
| Proportional (%) 27.9 | ||
| Additive (ng ml−1) 0.425 | ||
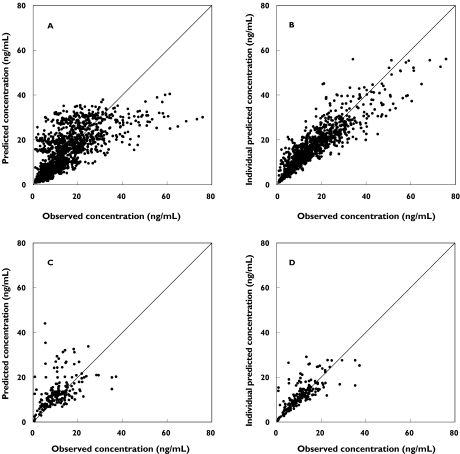
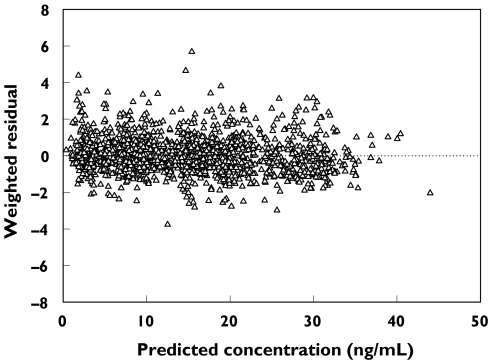
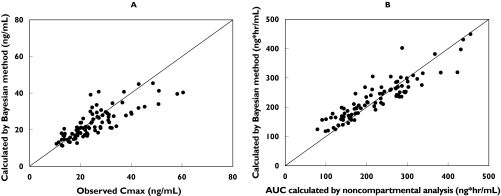
In order to confirm that the final PPK model actually reflects the observed plasma concentrations, the concentrations predicted by the final model are plotted vs. the observed concentrations in Figure 2 and individual weighted residual plots for the final model are shown in Figure 3. The values were generally distributed around zero and were relatively symmetric. No obvious bias pattern was apparent in the plot of the predicted concentration vs. the weighted residual. The pharmacokinetic parameters (Cmax and AUC) calculated from PPK model were compared with those calculated with noncompartmental analysis (Figure 4A,B). There is an excellent correlation between the results of calculation by noncompartmental analysis and estimation by the PPK model.
Figure 2.
Plot of observed epinastine concentration vs. final model-predicted epinastine concentration. (A) predicted concentration and (B) individual predicted concentration in healthy adults; (C) predicted concentration and (D) individual predicted concentration in paediatric atopic dermatitis patients. The line represents the line of identity
Figure 3.
Plots of weighted residuals vs. predicted concentrations (PRED). The horizontal line represents the zero level
Figure 4.
Comparison of individual exposures to epinastine (A: Cmax, B: AUC) observed or calculated by the noncompartmental method vs. those predicted by Bayesian estimation based upon the final population pharmacokinetic model. The solid line represents the unit line
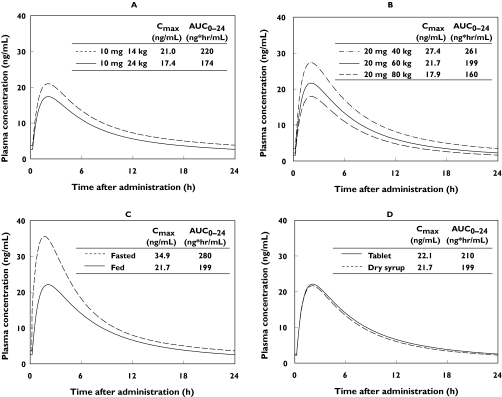
In order to evaluate the effect of covariates on plasma concentration of epinastine, typical plasma profiles and pharmacokinetic parameters (Cmax and AUC) predicted for various subject subgroups are shown in Figure 5. As the dosage for the clinical trial in paediatric patients was determined according to the body weight, the extremes of the body weight, 14 kg and 24 kg, were selected for simulation.
Figure 5.
Typical plasma concentration-time profiles of epinastine in the steady state, simulated for various patient subgroups. (A) 10 mg dose as dry syrup in the fed state, 14 vs. 24 kg (B) 20 mg dose as dry syrup in the fed state, 40, 60, 80 kg (C) 20 mg dose as dry syrup in the fasted state vs. the fed state, 60 kg (D) 20 mg dose as tablet vs. dry syrup in the fed state, 60 kg
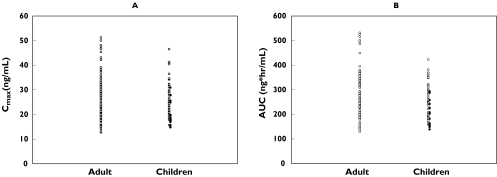
In order to evaluate the appropriateness of the dose setting based on body weight defined in the trial in paediatric patients, the PK parameters (Cmax and AUC) in adults (20 mg dose) and children (10 mg or 20 mg dose) calculated from PPK model were shown in Figure 6. The Cmax and AUC in adults were 26.9 ± 9.1 ng ml−1 and 281.6 ± 90.5 ng h ml−1 (Mean ± SD) and those of children were 25.6 ± 6.9 ng ml−1 and 246.8 ± 68.2 ng h ml−1, respectively. The distribution of both parameters overlapped well.
Figure 6.
Comparison of individual exposures to epinastine (A: Cmax, B: AUC) predicted by Bayesian estimation based upon the final population pharmacokinetic model between adult (20 mg dose) and children (14 kg to less than 24 kg; 10 mg dose, 24 kg or more; 20 mg dose). 10 mg dose (•); 20 mg dose (○)
The final PPK model was fitted repeatedly to 200 additional bootstrap samples. The mean parameter estimates obtained from the 200 bootstrap replicates are summarized in Table 5. These arithmetic mean parameter estimates were within 17% of those obtained with the original data set.
Table 5.
Summary of bootstrap validation on the present population pharmacokinetic model
| Final estimates of the model parameters | Results of 200 bootstrap simulations Mean | SE | Bootstrap mean/final estimate ratio (%)> | |
|---|---|---|---|---|
| CL/F | 19.1 | 18.1 | 7.48 | 95.0 |
| V1/F | 174 | 203 | 102.9 | 116.7 |
| Q | 34.4 | 34.8 | 3.94 | 101.2 |
| V2/F | 452 | 515 | 199 | 114.0 |
| Ka | 1.18 | 1.21 | 0.114 | 102.6 |
| CL/F: FOOD | 1.41 | 1.43 | 0.100 | 101.2 |
| V1/F: FOOD | 1.75 | 1.76 | 0.165 | 100.5 |
| Absorption lag time: FOOD | 0.234 | 0.232 | 0.039 | 99.2 |
| CL/F: FORM | 1.06 | 1.07 | 0.063 | 100.9 |
| CL/F: WT | 0.805 | 0.811 | 0.149 | 100.8 |
| V1/F: WT | 3.95 | 3.56 | 1.63 | 90.2 |
| ω2CL/Φ | 0.101 | 0.104 | 0.028 | 103.4 |
| ω2V1/Φ | 0.107 | 0.105 | 0.034 | 97.9 |
| ω2Q | 0.226 | 0.217 | 0.134 | 95.9 |
| ω2V2/Φ | 1.43 | 1.42 | 0.476 | 99.3 |
| ω2Ka | 0.323 | 0.363 | 0.093 | 112.3 |
| σ2 (proportional) | 0.0776 | 0.0755 | 0.010 | 97.3 |
| σ2 (additive) | 0.181 | 0.164 | 0.125 | 90.6 |
Discussion
The PPK model of epinastine in healthy adult volunteers and paediatric atopic dermatitis patients was built based on a two-compartment model with first-order absorption. Though there are some reports on the pharmacokinetics of epinastine in adults [6, 10], the pharmacokinetics of epinastine in children has not been reported so far. So, this PPK model is expected to be useful for paediatric patients. In this study, we built a PPK model in two steps, that is, a PPK model for adults was built first, followed by a model for adults and children. As frequent blood sampling was only performed in adults, data from adults were considered to be suitable for building a basic PPK model for epinastine. If the PK profiles were not similar between adults and children, it would be difficult to build a PPK model using merged data for adults and children. For these reasons, the two-step procedure of PPK modelling was selected.
In the present PPK model, the body weight, food status (fed or fasted) and formulation were found to affect the pharmacokinetics of epinastine. On the other hand, no effect of age was found. From this result, considering the difference of body weight, we can conclude that the pharmacokinetics of epinastine is not affected by age within the range examined in this study, that is, the pharmacokinetic profile of epinastine is similar in adults and children. It is suggested that, if dosage is adjusted based on body weight, the epinastine exposure in paediatric patients is similar to that in adults. Concerning the effect of age, we could only compare a group of children with a group of adults, because the age range of the adults was narrow (20–26 years). If we obtain pharmacokinetic data from adults with a wider range of age, useful information on the effect of increasing age could be obtained.
According to the results of food effect trial conducted in adults, it was shown that food intake reduced Cmax and AUC. The ratios of Cmax and AUC in fed subjects to those in fasted subjects were 0.67 and 0.62, respectively. On the other hand, tmax was not affected by food intake. A similar tendency was also observed in the simulated PK profile, as shown in Figure 5. This result suggests that the effect of food is described appropriately by this model.
A clinical trial to investigate the relative bioavailability of the dry syrup to the tablet was conducted and the ratios of Cmax and AUC after administration of dry syrup to those after administration of tablet were 0.82 and 0.91, respectively. A similar tendency was observed in the simulated PK profile, as shown in Figure 5. Based on this result, the effect of formulation on the pharmacokinetic profile of epinastine was less than that of body weight or food status.
The plots of the predicted vs. measured concentrations for adult and paediatric subjects (Figure 2) and a comparison of the pharmacokinetic parameters predicted by the PPK model with those calculated by noncompartmental analysis based on the data from adult subjects (Figure 4) show that the PPK model well describes the plasma concentrations of epinastine, although a tendency of slight under-estimation was observed in higher concentration range. In the present analysis, the data in absorption phase were not so rich compared with those in elimination phase, therefore prediction of rapid absorption might be difficult. It might cause the under-estimation for higher concentration, e.g. Cmax, observed in Figures 2 and 4A. However, the predicted values for lower concentration range and AUC were closer to identical line (Figures 2 and 4B), indicating that the present PPK model well described the exposure after oral administration. The result of model validation by the bootstrapping method indicates that the final model is stable.
Our PPK model shows that, if dosage is adjusted based on body weight, the epinastine exposure in paediatric patients is similar to that in adults (Figures 5A, B). The result of the application of the PPK model to the present clinical trial in paediatric patients, in which dosage was determined based on the body weight (from 14 kg to less than 24 kg; 10 mg dose, 24 kg or more; 20 mg dose), showed that the Cmax and AUC were almost same levels with those of adults after administration of 20 mg (Figure 6). These results provide a good basis for estimating the exposure in paediatric patients after administration of epinastine and also for supporting dosing recommendations in children. It was considered that dose adjustment based on body weight is clinically useful especially for low weight children.
In conclusion, a PPK model for epinastine in healthy adult subjects and paediatric patients was developed in this study and it was shown that this model well describes the plasma concentration of epinastine and is stable. Several covariates that affect the pharmacokinetics of epinastine were identified, but no effect of age was found. It was shown that if dosage is adjusted based on body weight, the epinastine exposure in paediatric patients is similar to that in adults.
References
- 1.Fugner A, Bechtel WD, Kuhn FJ, Mierau J. In vitro and in vivo studies of the non-sedating antihistamine epinastine. Arzneimittelforschung. 1988;38:1446–53. [PubMed] [Google Scholar]
- 2.Okuda M, Okubo K. Double-blind comparative study of epinastine dry syrup with ketotifen dry syrup in children with perennial allergic rhinitis [written in Japanese, abstract in English] Zibi Rinsyo Supplement. 2003;114:1–21. [Google Scholar]
- 3.Yanai K, Ryu JH, Watanabe T, et al. Positron emission tomographic study of central histamine H1-receptor occupancy in human subjects treated with epinastine, a second-generation antihistamine. Meth Find Exp Clin Pharmacol. 1995;17(Suppl C):64–9. [PubMed] [Google Scholar]
- 4.Yanai K, Ryu JH, Watanabe T, et al. Histamine H1 receptor occupancy in human brains after single oral doses of histamine H1 antagonists measured by positron emission tomography. Br J Pharmacol. 1995;116:1649–55. doi: 10.1111/j.1476-5381.1995.tb16386.x. [DOI] [PMC free article] [PubMed] [Google Scholar]
- 5.Tasaka K. Epinastine: An update of its pharmacology, metabolism, clinical efficacy and tolerability in the treatment of allergic diseases. Drugs Today (Barc) 2000;36:735–57. doi: 10.1358/dot.2000.36.11.1136048. [DOI] [PubMed] [Google Scholar]
- 6.Azuma J, Yoshida H, Seto Y, et al. Phase I study of WAL 801 CL [written in Japanese, abstract in English] J Clin Therap Med. 1992;8:3–24. [Google Scholar]
- 7.Note for Guidance on Clinical Investigation of Medicinal Products in Children. 1997. [14 October 2004]. CPMP/EWP/462/95. Available at: http://www.emea.eu.int/pdfs/human/ich/271199EN.pdf.
- 8.Clinical investigation of medicinal products in the pediatric population. 2000. [14 October 2004]. ICH harmonised tripartite guideline. Available at: http://www.fda.gov/cder/guidance/4099FNL.PDF. [PubMed]
- 9.Harada S, Nakagawa H, Onoda S, et al. Phase III Open-labeled study of epinastine hydrochloride dry syrup in pediatric patients with atopic dermatitis -evaluation of safety for 3 months administration- [written in Japanese, abstract in English] Rinsyoiyaku. 2003;19:1307–25. [Google Scholar]
- 10.Nakano S, Naruo T, Watanabe K, et al. Chronopharmacological study of a nonsedative H1-blocking agent (WAL 801CL, Epinastine) [written in Japanese, abstract in English] Jpn J Pharmacol Ther. 1991;22:617–26. [Google Scholar]
- 11.Boeckmann AJ, Sheiner LB, Beal SL. California: NONMEM Project Group. University of California at San Francisco; 1998. NONMEM users guide. [Google Scholar]
- 12.Ette EI. Stability and performance of a population pharmacokinetic model. J Clin Pharmacol. 1997;37:486–95. doi: 10.1002/j.1552-4604.1997.tb04326.x. [DOI] [PubMed] [Google Scholar]


