In three recent letters to the editor of this journal, Drs Hauben and Reich undertake a performance comparison of two methods to detect over-represented associations of drug–event combinations (‘signals’) in the Adverse Events Reporting System (AERS) database maintained by the US Food and Drug Administration (FDA) [1–3]. The two methods discussed in these letters, the Multi-item Gamma Poisson Shrinker (MGPS) [4–6] and the Proportional Reporting Ratio (PRR), can be used to classify adverse events as signals based on the disproportionality of these events in databases. The three letters acknowledge the potential utility of disproportionality analyses as a pharmacovigilance tool and thus seek to compare the utility of the two methods in signal detection.
AERS contains over 2.5 million adverse event reports spontaneously submitted by health care providers, pharmaceutical companies, and the public since 1968. For coding adverse events AERS currently utilizes the Medical Dictionary for Regulatory Activities (MedDRA) classification system with over 15 000 preferred terms (PT). AERS currently has about 10 000 PTs and 4000 decoded generic drug names in use; thus, approximately 43 million drug–event combinations (DECs) are possible in this database. However, considered as a two-way (drug-by-event) table, the AERS database is quite sparsely populated – approximately 2.8 million (0.7%) of approximately 43 million possible DECs have ever been reported. A large proportion (67%) of the 2.8 million DECs that have ever been reported contain fewer than three reports, and approximately half of the DECs exist only once [5]. The sparsity of AERS is important to consider when comparing MGPS and PRR [4, 5].
In the first letter [1], the author selects for analysis the currently labelled association between trimethoprim and hyperkalaemia, and assumes this DEC to be detectable as early as 1979 in the AERS data. In the second letter [2], the authors select the association of pancreatitis with various drugs based upon ‘definite causal relationships’ from external published reports and observational studies and assume that signals should be detectable during early, but unspecified time periods in AERS. In the third letter [3], the authors select the association of rhabdomyolysis with four anti-infectives (pentamidine, isoniazid, trimethoprim/sulfamethoxazole, and lamivudine) based upon at least two published case reports out of 765 Medline citations of rhabdomyolysis with drug products and assume that signals should be detectable during early, but unspecified time periods in AERS. In this third letter, the authors assert that they selected ‘replicated’ findings (i.e. two drug-specific case reports) in the published literature. However, the authors fail to mention in this letter that the specific drug–event in the title, ‘rhabdomyolysis with pentamidine’[3], never reaches an n > 1 throughout all the years of suspect cases in AERS.
In these three letters and in similar publications by the same authors [7–14] the authors assume that the DECs they selected should be signalled in the AERS data, and assume that the DECs are true causal associations if either MGPS or PRR signals them in AERS. The authors also assume that if the selected DECs are not signalled by either MGPS or PRR in AERS, the method has failed to signal true positive associations.
In this paper we discuss the flaws with three major aspects of the comparative analyses used by these authors [1–3,7–14]: (i) the disparate decision rules these authors choose to define signals for each method; (ii) the focus of the analyses on generating additional signals while excluding an analysis of specificity; and (iii) the use of a stratified MGPS vs. an unstratified PRR.
Disparate decision rules
Implicit in the three letters and in similar publications by the same authors is that well established, commonly cited, and objective decision rules are used to define safety signals to perform comparative analyses. However, when defining signals for the PRR analysis, these authors appear to use an ad hoc modification of the signalling criteria described by Evans [15]. Evans has stated: ‘A signal was defined as a PRR of at least 2, chi-square value of at least 4, and 3 or more cases’[5]. However, a lower threshold is used by these authors by allowing a PRR signal to be defined on the basis of fewer than three reports. The pancreatitis letter [2] states: ‘The number of reports required to generate a signal with PRRs ranged from 1 to 19 …’ and ‘The majority of signals highlighted by PRRs (9/15) were based on three or fewer reports.’ The rhabdomyolysis letter presents PRR signals with only one report [3]. In other publications these authors also use less stringent PRR signalling criteria than those recommended by Evans by decreasing the number of reports required to one and using smaller chi-square and PRR thresholds [9, 10]. The allowance of a single report to generate a signal for PRR greatly increases the number of signals in PRR, but in our experience dramatically reduces specificity.
When analysing MGPS, all three letters and similar publications by the same authors use a fixed definition of an EB05 ≥ 2 as a signal definition [1–3,7–14]. (The EB05 is the lower bound of the 90% confidence interval for the EBGM, or Empiric Bayes Geometric Mean. The EBGM is the adjusted value of an observed:expected ratio as calculated by MGPS. The lower and upper limits of a 90% confidence interval of the EBGM are denoted as EB05 and EB95, respectively). Using this threshold to define a signal is reasonable when searching for DECs that are at least twice the expected ratio relative to all other drugs and events in the database. But for serious events, such as hyperkalaemia, pancreatitis, and rhabdomyolysis, defining a signal based upon an adjusted observed : expected ratio that is twice the expected would be too lax. For serious events, a much stricter signalling criterion that detects adjusted ratios of DECs that are simply higher than expected would be in order. Using an EB05 >1 as a signal definition corresponds to being 95% confident that the DEC in question occurs at least at a higher-than-expected ratio. When analysing fatal events [6], it may even be appropriate to study the whole range of signal scores and corresponding confidence intervals, as some upper confidence limits may display values >1. Thus, Drs Hauben and Reich should have considered using a lower signal threshold to evaluate MGPS, especially when choosing a lower threshold to evaluate PRR.
There is not, nor should there be, a single, fixed definition of a signal threshold when using MGPS; rather, it is important to consider the severity of the DEC and the severity of the condition being treated. This was not only recommended in an Editorial by Szarfman et al.[6] in response to a similar paper by Hauben [7], but also in a guidance document from FDA [16] and in the PhRMA-FDA Collaborative Working Group on Safety Evaluation Tools paper that Hauben coauthored [17]. In addition, Szarfman et al.[5] discussed the use of other EB05 threshold values (i.e., 1.5, 2, 4, 8) and the differences in sensitivity and specificity of signal elicitation through time when various signal thresholds are used.
Number of signals vs. specificity
Clearly the method that would generate the largest number of safety signals would be one that declares every DEC a signal. However, such a method would not provide useful information to manage risk, because specificity would be zero. We often do not have specific markers for drug toxicity or pathognomonic clinical findings that can separate an inherent disease process from the unknown adverse effects of a drug or concomitant drugs [6]. Therefore, for assessing adverse events using signalling tests, these tests should be specific as well as sensitive to avoid overwhelming the reviewer with false signals. In all three letters and in other similar publications by the same authors the same claim is made that PRR is more sensitive than MGPS (when using the authors’ disparate signalling criteria), but this claim is not placed in context. The less conservative decision rules used to define PRR signals result in generating additional signals, but specificity information is not provided by these authors for the dissimilar decision rules.
When analysing AERS data, the effect of generating additional, potentially false positive signals at the cost of specificity is important to consider because approximately half of the DECs contained in AERS exist only once. Our analyses show that PRR classifies >50% of the DECs for 90% of the drugs in AERS as signals the first year an event is coded with a drug, regardless of the clinical plausibility (unpublished information). MGPS systematically identifies and ‘shrinks’ volatile observed : expected ratios with small numbers of events and expectations that are common in this database. By shrinking the EBGM scores of DEC combinations with limited data towards 1, MGPS guards against generating multiple false-positive signals due to multiple comparisons.
Stratification
In the three letters and in other publications [1–3,7–14], the authors do not compare the two methods using an equivalent stratification scheme. While both MGPS and PRR utilize a disproportionality approach to detect signals, MGPS also incorporates complex and computer-intensive stratified analyses to detect signals. MGPS routinely incorporates over 1000 stratification categories when calculating scores. This systematic adjustment helps to minimize potentially false positive signals in heterogeneous populations (e.g., different background rates of events and drug use by age). The importance of this adjustment cannot be overstated in a database containing millions of DEC reports. Comparing a stratified MGPS analysis with an unstratified PRR will result in an ‘apples to oranges’ comparison unless the drugs and events are homogeneously distributed across strata.
Comparing MGPS with PRR using confidence intervals
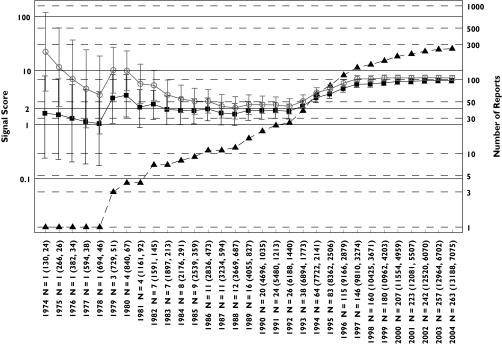
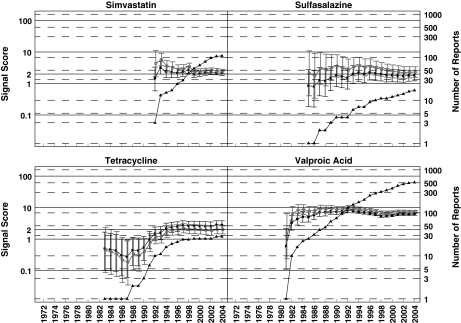
A more direct way of comparing the observed : expected ratios (or signal scores) of the two methods is to construct 90% confidence intervals for both MGPS and PRR values. Evans has previously suggested the use of confidence intervals for PRR values [15] and MGPS routinely calculates confidence intervals for its analyses. When confidence intervals for MGPS and PRR values are calculated (as presented in Figures 1–3), two general observations can be made:
Figure 1.
Hyperkalaemia analysis: progression of cumulative data mining signal scores and confidence intervals with MGPS and PRR for hyperkalaemia associated with trimethoprim described in the first letter to the editor [1]. Signal scores are shown for reports having an n = 1 before 1979 to an n = 263 in July 2004. Left y-axis, signal scores for the MGPS (dark squares) and PRR (light circles) and the lower and upper 90% confidence interval limits; right y-axis, number of reports (dark triangles) for trimethoprim-associated hyperkalaemia; x-axis, time in years; n = total number of reports containing a trimethoprim–hyperkalaemia association. In parenthesis, the total number of trimethoprim reports and of hyperkalaemia reports in the database. Note that the wide and overlapping confidence intervals for MGPS and PRR with a small number of reports in the early years are inconsistent with the first letter's implication that PRR performed more robustly than MGPS in the detection of this drug–event combination [1]. For every data point, there is overlapping between the confidence intervals for MGPS and PRR. Using a lower confidence limit >1 as a comparable signal definition for both methods, it can be seen that both PRR and MGPS generate a signal in 1979. For MGPS, the lower confidence limit remains around or above 1 between 1980 and 1992 while PRR begins decreasing after 1980 until the point estimates of both methods converge in 1992 to the point estimate value predicted by MGPS since 1981. After 1992, when the potassium sparing activity of trimethoprim at the distal nephron became elucidated [22], both methods show a similar increase in their estimated signal score of around 6 times higher than expected, given the data. In contrast, higher and inflated estimates of around 10 times higher than expected occur with PRR in the early years (1974 and 1975) when only one report exists. In the letter [1] it is assumed that a signal for trimethoprim-hyperkalaemia should be seen early in AERS because hyperkalaemia was eventually added to trimethoprim's labelling. However, this assumption is not necessarily valid. While it is true that hyperkalaemia was ultimately incorporated into the labelling for both Septra® and Bactrim® (trade names for trimethoprim-sulfamethoxazole) in 1995 and 2001, respectively, use of these drugs changed over time. Initially, these drugs were indicated for urinary tract or upper respiratory infections. However, by the mid-1990s, these drugs were also given in higher doses to immunocompromised patients for the treatment of Pneumocystis carinii infections. Such patients would likely be taking other medications for other complex medical conditions. Given that the population exposed to trimethoprim changed over time, it should not be assumed that, simply because hyperkalaemia appeared in the drug's labelling, that a strong signal for hyperkalaemia should be expected early in the drug's postmarketing history. EBGM (▪), N (▴), PRR ( )
)
Figure 3.
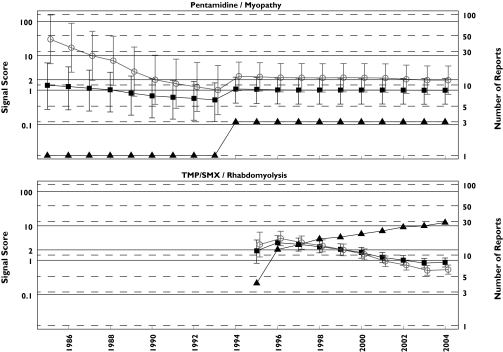
Rhabdomyolysis analysis: progression of cumulative data mining signal scores for the MGPS and PRR methods for pentamidine associated myopathy and TMP/SMX associated rhabdomyolysis described in Table 1 of the third letter as having negative signals with MGPS and positive ones with PRR [3]. Left y-axis, signal scores for the MGPS (dark squares) and PRR (light circles) and the lower and upper 90% confidence interval limits; right y-axis, number of reports (dark triangles); x-axis, time in years labelled biennially. The figure shows that for every data point, there is overlapping between the confidence intervals for MGPS and PRR for these two DECs. Note that the PRR positive association between pentamidine with myopathy never reaches an n > 3 in 20 years of observation. However, the authors of the letter declare that ‘With respect to pentamidine, a disproportional PRR for myopathy could have been generated in 1985 based on one case, which in this instance happened to be the first literature report, 17 years in advance of Delobel and Parinaud's case’. EBGM (▪), N (▴), PRR (○)
MGPS, due to Bayesian adjustments, generates a much more stable series of confidence intervals through time for all drugs analysed; and
Overlapping of MGPS and PRR confidence intervals occurs for the vast majority of data points presented.
Space does not permit us to identify and describe the factors that might have contributed to the evolution of the MGPS and PRR confidence intervals for all the signals discussed. A few points are made in the captions of Figures 1–3 but readers may identify other potential factors and make their own assessments about the performance of these methods by reviewing our figures. Consistent with the analyses done in the letters, the MGPS analysis is stratified by age, sex, and year, while the PRR analysis is unstratified.
Discussion
Challenges in analysing disproportionality methods
In three letters to this journal and in other publications [1–3,7– 14], these authors seek to verify whether MGPS and PRR generate signals (using their dissimilar signalling criteria) for various selected DECs. The selection of DECs was based upon the appearance of events in the product label or from published case series of event reports and/or observational studies not always appearing in the labelling. However, only AERS data were considered by these authors as the sole source for generating their selected signals.
The authors assume that the DECs chosen for analyses represent valid, true-positive drug–event associations. However, there is no guarantee that the DECs chosen by these authors are in fact true positives (causally related). Even in the cases when the event appears in the product labelling, many factors other than a true causal relationship between a drug and an event may influence the labelling, such as some class effects, litigation and publicity.
When a disproportionality method fails to generate signals in AERS for the DECs selected from sources outside of AERS, it does not necessarily mean that the method has limited capability to signal adverse drug events. Such is the case with the thalidomide-associated toxic epidermal necrolysis (TEN) signal, the subject of another publication by the same authors [8] and referenced in another letter to the editor [18]. A 1998 controlled trial that found thalidomide detrimental in treating TEN [19] carried more weight in getting this event labelled than AERS data. This study was stopped because there was excess mortality in the thalidomide-treated group: 10 of 12 patients died compared with 3 of 10 in the placebo group [19]. AERS may not have enough information submitted to detect a signal for the DEC being analysed. However, such a scenario represents a limitation of the database, not a failure of a disproportionality method.
In our analysis of this paper and other papers by the same authors, many of the events that ‘failed’ to signal actually did demonstrate signals when additional terms were analysed. For example, in a paper [20] analysing the potential association between parkinsonism and valproate, the authors concluded that no signals occurred; however, signals do appear for the terms ‘ataxia’ and ‘tremors.’ Such examples underscore the need for broad analyses of multiple terms to leave ‘no stone unturned’, as we have recommended [6]. Because adverse event coding is so granular, limiting the analyses to preconceived event terms often hides safety signals.
We agree with these authors that disproportionality analyses are promising tools that should be considered as supplements to and not substitutes for traditional pharmcovigilance methods, as we previously recommended [5, 6, 21]. But it is also important to remember that systematically signalling true drug–event associations using traditional methods also presents challenges [5, 6]. Thus, the results obtained from traditional methods may not be an infallible measure of a drug–event association nor the extent of this association.
The obstacles in systematically assessing true drug–event associations make it difficult to ‘validate’ safety analyses, including disproportionality analyses. However, by using similar software and data we can validate each other's selection criteria, results, and interpretation, as is the case with the publications that we are discussing herein.
In the clinical diagnosis area, there are already objective standards in place for validating new methods when these new methods are being investigated. Unfortunately, when evaluating simultaneous drug safety analyses of huge databases, there are no standards in place that could be systematically utilized to validate the results of these new analytical methods. Efforts to validate data mining systems and traditional methods are complicated by the lack of systematic knowledge about true drug toxicities in different collections of medical data, the magnitude of the specific toxic drug effects in specific subpopulations, and the absence of a gold standard tool for identifying these toxicities. Historically, it has been very difficult to systematically analyse in real-time these multiple collections of medical data and to cross-reference the results in a systematic way. This assessment is complicated by the discordant ways in which medical data are generated in the first place. These are the lessons that need to be appropriately considered, taught, and learned.
Conclusions
The three letters and similar publications by the same authors comparing MGPS and PRR methods using the AERS database have several serious methodological flaws. By only considering positive signals for a small number of DECs at the exclusion of a formal analysis of sensitivity and specificity, the authors leave unanswered the question of the relative accuracy of the two methods. Even if we accept that considering a few positive signals is a useful way to evaluate the methods, the use of ambiguous and statistically noncomparable decision rules for the two methods makes their comparison of the two methods inappropriate. Furthermore, the use of a stratified analysis for MGPS while using an unstratified analysis for PRR makes it impossible to determine if any observed differences in signal scores are due to differences in MGPS and PRR, or are due to differences in the strata. While the goal of comparing MGPS and PRR is laudable, the methodology used by the authors falls short of providing a useful comparison.
Figure 2.
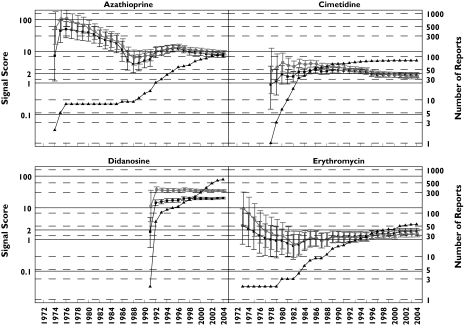
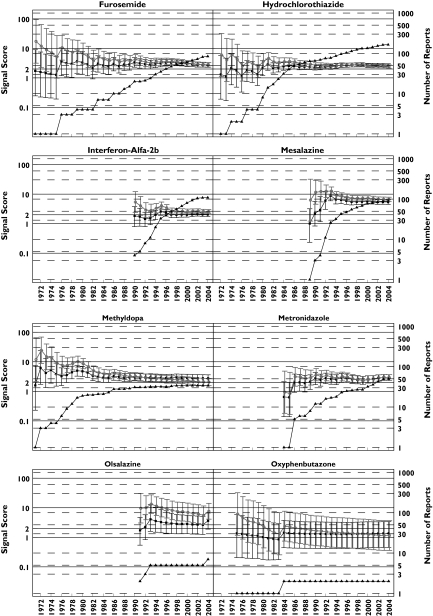
Pancreatitis analysis: progression of cumulative data mining signal scores and confidence intervals with MGPS and PRR for pancreatitis associated with the 16 drugs described in the second letter to the editor [2]. Left y-axis: signal scores for the MGPS (dark squares) and PRR (light circles) and the lower and upper 90% confidence interval limits; right y-axis, number of reports (dark triangles); x-axis, time in years labelled biennially. The wide and overlapping confidence intervals of MGPS and PRR are inconsistent with the letter's implication that PRR performed more robustly than MGPS in the detection of these drug–event combinations [2]. One notable exception is didanosine, a drug used to treat AIDS patients which shows a large signal for both PRR and MGPS, with PRR and MGPS confidence intervals that do not overlap as with the other drugs analysed. This is very likely a result of stratifying by age, sex, and year with MGPS, but not with PRR, since the drug–event combination is concentrated in a small number of strata. This figure shows signals for drugs having a wide range of reports throughout the years. Note that didanosine and valproic acid reach the highest number of reports with 597 and 511 reports, respectively, in July 2004. However, for these 16 drugs, n-values of 1 and 2 are the most frequent. For example, a total of 29 data points have an n = 1. They included, 9 years for oxyphenbutazone, 7 years for furosemide, 5 years for tetracycline, 2 years each for hydrochlorothiazide, metronidazole, and sulfasalazine; and 1 year each for cimetidine, mesalazine, methyldopa, and valproic acid. These low frequency counts give inflated PRR estimates. EBGM (▪), N (▴), PRR (○)
Acknowledgments
Drs Paul Seligman and Rita Ouellet-Hellstrom provided valuable and helpful discussions. The views in this article represent the views of the authors and do not necessarily represent the views of the US Food and Drug Administration or the United States government. This project was supported in part by an appointment to the Research Fellowship Program for the US Food and Drug Administration administered by the Oak Ridge Associated Universities through a contract with FDA.
References
- 1.Hauben M. Trimethoprim-induced hyperkalaemia – lessons in data mining. Br J Clin Pharmacol. 2004;58:338–9. doi: 10.1111/j.1365-2125.2004.02153.x. [DOI] [PMC free article] [PubMed] [Google Scholar]
- 2.Hauben M, Reich L. Drug-induced pancreatitis: lessons in data mining. Br J Clin Pharmacol. 2004;58:560–2. doi: 10.1111/j.1365-2125.2004.02203.x. [DOI] [PMC free article] [PubMed] [Google Scholar]
- 3.Hauben M, Reich L. A case report of rhabdomyolysis with pentamidine that prompted a retrospective evaluation of a pharmacovigilance tool under investigation. Br J Clin Pharmacol. 2004;58:675–6. doi: 10.1111/j.1365-2125.2004.02215.x. [DOI] [PMC free article] [PubMed] [Google Scholar]
- 4.DuMouchel W, Pregibon D. Proceedings of the Seventh ACM SIGKDD International Conference on Knowledge Discovery and Data Mining, San Diego, CA August 26–29, 2001. New York: ACM Press; 2001. Empirical Bayes Screening for Multi–Item Associations; pp. 67–76. In. Available from http://portal.acm.org. [Google Scholar]
- 5.Szarfman A, Machado SG, O'Neill RT. Use of screening algorithms and computer systems to efficiently signal higher-than-expected combinations of drugs and events in the US FDA's spontaneous reports database. Drug Saf. 2002;25:381–92. doi: 10.2165/00002018-200225060-00001. [DOI] [PubMed] [Google Scholar]
- 6.Szarfman A, Tonning JM, Doraiswamy PM. Pharmacovigilance in the 21st century: new systematic tools for an old problem. Pharmacotherapy. 2004;24:1099–104. doi: 10.1592/phco.24.13.1099.38090. [DOI] [PubMed] [Google Scholar]
- 7.Hauben M. Application of an empiric Bayesian data mining algorithm to reports of pancreatitis associated with atypical antipsychotics. Pharmacotherapy. 2004;24:1122–9. doi: 10.1592/phco.24.13.1122.38098. [DOI] [PubMed] [Google Scholar]
- 8.Hauben M. Early postmarketing drug safety surveillance: data mining points to consider. Ann Pharmacother. 2004;38:1625–30. doi: 10.1345/aph.1E023. [DOI] [PubMed] [Google Scholar]
- 9.Hauben M, Reich L. Safety related drug-labelling changes: findings from two data mining algorithms. Drug Saf. 2004;27:735–44. doi: 10.2165/00002018-200427100-00004. [DOI] [PubMed] [Google Scholar]
- 10.Hauben M, Reich L. Data mining, drug safety, and molecular pharmacology: potential for collaboration. Ann Pharmacother. 2004;38:2174–5. doi: 10.1345/aph.1E373. [DOI] [PubMed] [Google Scholar]
- 11.Hauben M, Reich L, Chung S. Postmarketing surveillance of potentially fatal reactions to oncology drugs: potential utility of two signal-detection algorithms. Eur J Clin Pharmacol. 2004;60:747–50. doi: 10.1007/s00228-004-0834-0. [DOI] [PubMed] [Google Scholar]
- 12.Hauben M, Reich L. Case reports of dobutamine-induced myoclonia in severe renal failure: potential of emerging pharmacovigilance technologies. Nephrol Dial Transplant. 2005;20:471–2. doi: 10.1093/ndt/gfh549. [DOI] [PubMed] [Google Scholar]
- 13.Hauben M, Reich L. Potential utility of data-mining algorithms for early detection of potentially fatal/disabling adverse drug reactions: a retrospective evaluation. J Clin Pharmacol. 2005;45:378–84. doi: 10.1177/0091270004273936. [DOI] [PubMed] [Google Scholar]
- 14.Hauben M, Reich L. Endotoxin-like reactions with intravenous gentamicin: results from pharmacovigilance tools under investigation. Infect Control Hospital Epidemiol. 2005;26:391–4. doi: 10.1086/502556. [DOI] [PubMed] [Google Scholar]
- 15.Evans SJW, Waller PC, Davis S. Use of proportional reporting ratios (PRRs) for signal generation from spontaneous adverse drug reaction reports. Pharmacoepidemiol Drug Saf. 2001;10:483–6. doi: 10.1002/pds.677. [DOI] [PubMed] [Google Scholar]
- 16.US Department of Health and Human Services, Food and Drug Administration, Center for Drug Evaluation and Research (CDER), Center for Biologics Evaluation and Research (CBER) Guidance for Industry. Good Pharmacovigilance Practices and Pharmacoepidemiologic Assessment. 2005 March Available from http://www.fda.gov/cder/guidance/6359OCC.htm.
- 17.Almenoff J, Tonning JM, Gould AL, Szarfman A, Hauben M, Ouellet-Hellstrom R, Ball R, Hornbuckle K, Walsh L, Yee C, Sacks ST, Yuen N, Patadia V, Blum M, Johnston M, Gerrits C, Seifert H, LaCroix K. Perspectives on the use of data mining in pharmacovigilance. Drug Saf. doi: 10.2165/00002018-200528110-00002. In press. [DOI] [PubMed] [Google Scholar]
- 18.Hauben M, van Puijenbroek EP. Evaluation of suspected adverse drug reactions. JAMA. 2005;293:1324. doi: 10.1001/jama.293.11.1324-a. [DOI] [PubMed] [Google Scholar]
- 19.Wolkenstein P, Latarjet J, Roujeau JC, Duguet C, Boudeau S, Vaillant L, Maignan M, Schuhmacher MH, Milpied B, Pilorget A, Bocquet H, Brun-Buisson C, Revuz J. Randomised comparison of thalidomide versus placebo in toxic epidermal necrolysis. Lancet. 1998;352:1586–9. doi: 10.1016/S0140-6736(98)02197-7. [DOI] [PubMed] [Google Scholar]
- 20.Hauben M, Reich L. Valproate-induced parkinsonism: use of a newer pharmacovigilance tool to investigate the reporting of an unanticipated adverse event with an ‘old’ drug. Mov Disord. 2005;20:387. doi: 10.1002/mds.20357. [DOI] [PubMed] [Google Scholar]
- 21.O'Neill RT, Szarfman A. Some FDA perspectives on data mining for pediatric safety assessment. Current Therapeutic Res Clin Experimental. 2001;62:650–63. [Google Scholar]
- 22.H, Velázquez MA, Perazella FS, Wright, Ellison DH. Renal mechanism of trimethoprim-induced hyperkalemia. Ann Intern Med. 1993;119:296–301. doi: 10.7326/0003-4819-119-4-199308150-00008. [DOI] [PubMed] [Google Scholar]


