Abstract
Aim
To assess the likelihood of a sustained virological response (SVR) vs. the likelihood of anaemia in patients with chronic hepatitis C.
Methods
Data from 1732 patients treated with peginterferon alfa-2a (40KD) plus ribavirin in two randomized, multinational studies were pooled. Probabilities of SVR and anaemia were modelled using the generalized additive logistic model, with numerous clinical variables considered for entry into the model. Baseline haemoglobin was only considered in the analysis for anaemia.
Results
The probability of anaemia increased from 6 to 16% as a function of the ribavirin dose kg−1 (12–16 mg kg−1), whereas the relationship between SVR and ribavirin dose kg−1 was influenced by hepatitis C virus (HCV) genotype. The probability of an SVR was not influenced by the ribavirin dose kg−1 in patients with HCV genotype 2 or 3 infection, but increased as a function of ribavirin dose kg−1 in patients with HCV genotype 1 infection (40–50% increase in probability of SVR for 12–16 mg kg−1 dose ribavirin increase). The probability of an SVR in patients included with HCV genotype 1 decreased with increasing HCV RNA level to about 3 million copies ml−1, but was relatively independent of increasing HCV RNA level thereafter. In addition, older age, a higher ribavirin apparent oral clearance and cirrhosis had a negative impact on achieving an SVR, but improved with increasing alanine aminotransferase (ALT) quotient. Sex and ribavirin dose kg−1 were the most important prognostic factors for anaemia, followed by baseline haemoglobin, age, baseline ALT quotient and cirrhosis.
Conclusion
This study supports individualizing ribavirin dosages by HCV genotype and body weight, and highlights several clinical variables that influence the likelihood of an SVR compared with anaemia in chronic hepatitis C patients treated with peginterferon alfa-2a (40KD) plus ribavirin.
Keywords: anaemia, hepatitis C, peginterferon alfa-2a (40KD), ribavirin, sustained virological response
Introduction
Hepatitis C virus (HCV) infection is a global public health problem. Globally, an estimated 170 million people are chronically infected with HCV, and 3–4 million people are newly infected each year [1]. Approximately 80% of newly infected patients progress to chronic infection. Cirrhosis develops in about 10–20% of those with chronic infection and liver cancer develops in 1–5% of those with chronic infection over a period of 20–30 years [1].
Pegylated interferon plus ribavirin is the treatment of choice for patients with chronic hepatitis C. HCV genotype and baseline serum HCV RNA level are important predictors for sustained virological response (SVR) [2–4]. Other factors such as age, gender, race, obesity, histological status and serum alanine aminotransferase (ALT) level also influence SVR rates [4, 5]. Recently, a number of studies have suggested that higher ribavirin concentrations result in higher SVR rates [6–10]. However, any potential increase in SVR rates achieved with higher doses of ribavirin must be balanced against the increased potential for ribavirin-associated adverse events. Low baseline haemoglobin levels and high serum ribavirin concentrations have been shown to predict the occurrence of anaemia with ribavirin therapy [6, 9, 10].
We undertook this pooled analysis of data from two randomized multinational studies of peginterferon alfa-2a (40KD) plus ribavirin to assess how patient- and disease-related factors influence the chance of achieving SVR vs. the likelihood of anaemia in relation to ribavirin dose.
Materials and methods
Data from two randomized, multinational, Phase III studies were pooled. Treatment-naive adults with chronic hepatitis C, quantifiable HCV RNA in serum, elevated ALT levels and compensated liver disease were eligible for these studies [11, 12]. Patients in the study by Fried et al. [11] were randomized to 48 weeks of treatment with peginterferon alfa-2a (40KD) 180 µg week−1 plus ribavirin (1000 mg day−1 for patients weighing < 75 kg or 1200 mg day−1 for patients weighing ≥ 75 kg), conventional interferon alfa-2b plus ribavirin 1000 or 1200 mg day−1, or peginterferon alfa-2a (40KD) monotherapy. In the study by Hadziyannis et al. [12] patients were randomized to treatment with peginterferon alfa-2a (40KD) 180 µg week−1 plus ribavirin for either 24 or 48 weeks and with either a low dose (800 mg day−1) or standard dose (1000 or 1200 mg day−1 as described above) of ribavirin. Thus, there were four treatment groups that included ribavirin across the two studies. The inclusion criteria, exclusion criteria, study design and primary results of these studies have been published elsewhere [11, 12].
The primary efficacy parameter in these trials was SVR, defined as undetectable HCV RNA in serum at the end of treatment and during the untreated follow-up phase [12–24 weeks in the trial by Hadziyannis et al. (i.e. at week 48 in patients treated for 24 weeks, at week 72 in patients treated for 48 weeks), at least 20 weeks in the trial by Fried et al. [11, 12]), by qualitative polymerase chain reaction assay (COBAS AMPLICOR™ HCV Test, v2.0; lower limit of detection 50 IU ml−1].
Data on SVR and incidence of anaemia, available for 1732 patients from the two trials, were included in logistic regression analyses. Anaemia was defined as haemoglobin concentration < 10 g dl−1 documented on at least one occasion during the studies. We chose to analyse SVR and anaemia as binary outcomes: SVR vs. no SVR and anaemia vs. no anaemia.
Data analysis
SVR and incidence of anaemia were modelled using a generalized additive logistic model as follows:
| (1) |
It was assumed that the log-odds of the probability P of an event yi can be described as functions fj of the prognostic factors xi1 up to xip. Each fj is an unspecified function which was estimated in a flexible manner using an algorithm whose basic building block is a scatter plot smoother. The smoother used was the so-called cubic B-spline smooth [13]. However, not all functions need to be nonlinear and linear parametric forms can be easily mixed with nonlinear terms. More details about the methodology of generalized additive models (GAM) can be found in a textbook by Hastie and Tibshirani [13]. The data were modelled using S-PLUS 6.1 Professional Edition (MathSoft, Seattle, WA, USA).
The baseline disease or demographic factors considered (based on results from previous analyses) for entry into the model included: baseline ALT quotient (ALT value divided by upper limit of normal range); age; histological diagnosis (noncirrhosis vs. cirrhosis); HCV genotype (1 vs. 2 or 3); HCV RNA level; race (White vs. nonWhite people); sex (male vs. female); ribavirin dose kg−1; treatment duration (24 weeks vs. 48 weeks) in patients with HCV genotype 2 or 3 infection; and apparent oral clearance (CL/F) of ribavirin. Baseline haemoglobin concentration was also considered in the analysis for anaemia. Although body weight and AUC were tested initially, the factors ribavirin dose kg−1 and CL/F were found to have a stronger prognostic value and were therefore selected for the final model development.
In the initial generalized additive regression analysis, the assigned ribavirin dose kg−1 body weight was evaluated as a prognostic factor for both SVR and incidence of anaemia. Separate analyses were undertaken for SVR rates in patients infected with HCV genotype 1 (1036 patients) and genotypes 2 or 3 (631 patients). Although the number of 49 patients with HCV genotype 4 was limited, the SVR rate in these patients was evaluated separately because of the scarce amount of available information on HCV genotype 4 patients to date. The number of seven patients with HCV genotype 5 and 11 patients with HCV genotype 6 was considered to be too small to undertake separate analyses for the SVR rate. In contrast, a combined analysis (1732 patients) was undertaken for the incidence of anaemia because it was assumed that the risk of anaemia is independent of HCV genotype.
A population pharmacokinetic model for orally administered ribavirin has recently been developed using data from five studies including the two used as the basis for this study (published with this article) [14]. The model developed was a three-compartment model with a sequential zero-order followed by a first-order absorption process. Interoccasion variability and food effects were included in the absorption model. The covariates weight, lean body weight, height, body mass index, age, sex, race, haemoglobin, albumin, serum creatinine and creatinine clearance were tested in the population pharmacokinetic model for their statistical and clinical significance [14]. Prior to testing any of the given covariates, total oral clearance was separated into renal and nonrenal components and the effect of potential covariates was tested on the two components. This was not found to describe the data better and so covariate effects were subsequently tested on total oral clearance. Lean body weight was the only covariate that met the predefined criteria for influence on both clearance (CL) and the volume of the largest of the peripheral compartments (V2). There was a linear relationship between lean body weight and both CL and V2. For the purpose of the present analysis, individual CL/F values in 242 of the patients were estimated based on the population pharmacokinetic analysis and individual ribavirin plasma concentrations. Clearly, lean body weight and total body weight are highly correlated and so total body weight was used in the present analysis since ribavirin dosing instructions are based on total body weight. Due to the absence of ribavirin plasma concentrations, the individual CL/F of the remaining 1490 patients in the present dataset was calculated using the following general formula derived from that population pharmacokinetic analysis:
| (2) |
where CL / Fi is the individual apparent clearance (l h−1) and BWi is the individual total body weight (kg).
Initially, the estimated CL/F values in the 242 HCV patients were used to calculate the AUC0−24 h of ribavirin at steady state, which was then used in a separate generalized additive logistic regression analysis to evaluate graphically the relationship between AUC0−24 h as a prognostic factor for both SVR and incidence of anaemia in these patients.
In order to use the models to simulate various ribavirin dosing schemes, the potential interaction of the ribavirin daily dose kg−1 body weight with other prognostic factors was evaluated so that the relevant interaction terms could be included in the final models. An automated step-wise search was used to select the best GAM given the range of models to consider. A ‘regimen’ of candidate forms in which a particular prognostic factor may enter the model was defined for every factor and the final model was built up by evaluating all candidate forms for each prognostic factor. A record was kept of all models ever visited. The Akaike statistic was used to select the best model [15]. The step-wise search ends when the maximum number of steps has been used or when the Akaike statistic criterion cannot be decreased by any of the eligible steps.
Model uncertainty was quantified by the ‘bootstrapping technique’ [16]. Datasets were bootstrapped 1000 times and for every bootstrap sample, the final GAMs for SVR and anaemia were fitted to the bootstrapped data. Subsequently, the chance of SVR and the likelihood of anaemia were predicted for each individual patient based on each of the 1000 GAMs. In addition, the median and 95% confidence intervals (CIs) of the SVR rates and incidence of anaemia were calculated.
Evaluation of predictive performance
The SVR rate and incidence of anaemia were predicted based on 1000 GAMs fitted to 1000 bootstrapped samples of the original dataset. Subsequently, the predicted distributions of the independent statistic’s overall SVR rates and incidence of anaemia were graphically compared with the actual observed values. The predictive performance of the final models was considered acceptable in the case that the observed values fell within the predicted distributions.
Results
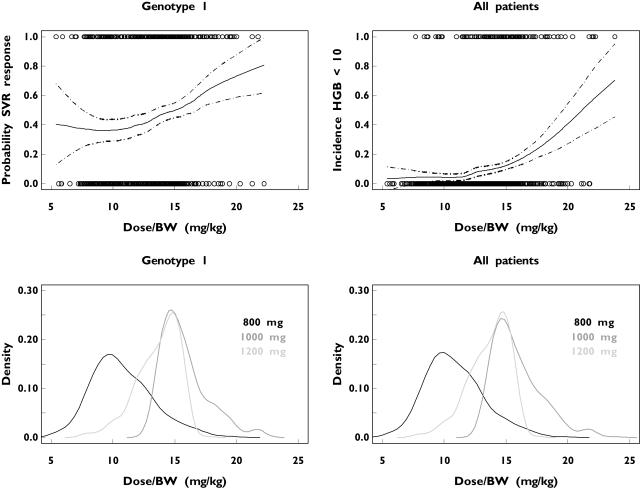
The initial GAM analyses were undertaken by using the ribavirin dose kg−1 as the only prognostic factor. The relationship between ribavirin dose kg−1 and the probability of an SVR in patients infected with HCV genotype 1 or the probability of anaemia in all patients is shown in Figure 1; both the probabilities of SVR and anaemia increased with increasing ribavirin dose kg−1. The probability of SVR was estimated to increase from approximately 40% to 54% and the incidence of anaemia was estimated to increase from approximately 6% to 16% for a ribavirin dose increase from 12 mg kg−1 to 16 mg kg−1 (Figure 1). The probability density plots of the ribavirin dose kg−1 are also depicted in Figure 1. Patients with HCV genotype 1 receiving a standard dose of ribavirin (1000 or 1200 mg day−1) had a higher probability of achieving an SVR than those receiving 800 mg day−1. The steepness of the anaemia–dose curve indicates that a small increase in the daily dose of ribavirin above 15 mg kg−1 will result in a substantial risk of anaemia. The overall incidence of anaemia was observed to be approximately 7.5% for all 48-week treatments with daily doses up to 15 mg kg−1 and almost 20% for all 48-week treatments with daily doses of > 15 mg kg−1 ribavirin.
Figure 1.
The probability of a sustained virological response (SVR) in patients with hepatitis C virus (HCV) genotype 1 (upper left) and anaemia in all HCV patients (upper right) as a function of the ribavirin dose kg−1 after 48 weeks’ treatment with low-dose (800 mg day−1) or standard-dose (1000 or 1200 mg day−1) ribavirin. Observed values are presented as circles. The dashed lines in the upper graphs are the 95% pointwise confidence intervals. The nonparametric probability density plots of the administered ribavirin dose kg−1 in the HCV genotype 1 patient population and in all HCV patients are shown in the lower right and lower left panels, respectively
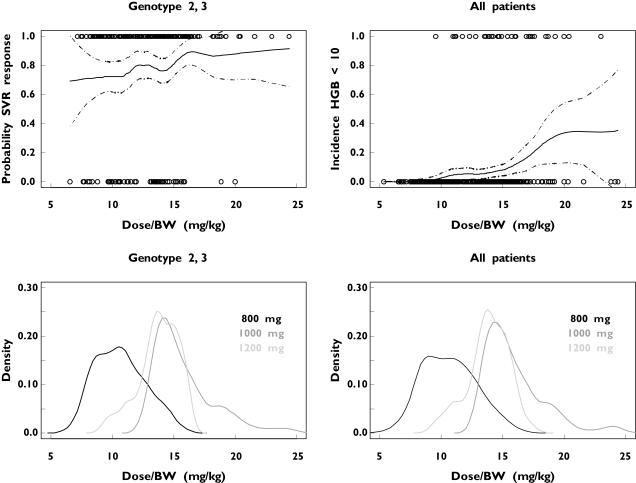
The relationship between ribavirin dose kg−1 and the probability of an SVR in patients infected with HCV genotypes 2 or 3, the probability of anaemia in all patients as well as the probability density plots are shown in Figure 2. In contrast to findings for patients infected with genotype 1, the probability of an SVR does not appear to be strongly correlated with the ribavirin dose kg−1 in these individuals. The overall SVR in patients infected with genotypes 2 or 3 was observed to be approximately 81%. This implies that a low dose of ribavirin (800 mg day−1) is as effective as the higher standard dose (1000 or 1200 mg day−1) in these patients. In addition, low-dose ribavirin would be associated with a low risk of anaemia in patients infected with HCV genotypes 2 or 3 (Figure 2). The incidence of anaemia (HgB < 10 g dl−1) was observed to be almost 3.5% for a 24-week treatment of 800 mg day−1 and approximately 10% for a 24-week treatment of 1000 or 1200 mg day−1 according to body weight.
Figure 2.
The probability of a sustained virological response (SVR) in patients with hepatitis C virus (HCV) genotype 2 or 3 (upper left) and anaemia in all HCV patients (upper right) as a function of the ribavirin dose kg−1 after 24 weeks’ treatment with low-dose (800 mg) or standard-dose (1000 or 1200 mg day−1 depending on weight) ribavirin. Observed values are presented as circles. The dashed lines in the upper graphs are the 95% pointwise confidence intervals. The nonparametric probability density plots of the administered ribavirin dose kg−1 in the HCV genotype 2 or 3 patient population and in all HCV patients are shown in the lower right and lower left parts, respectively
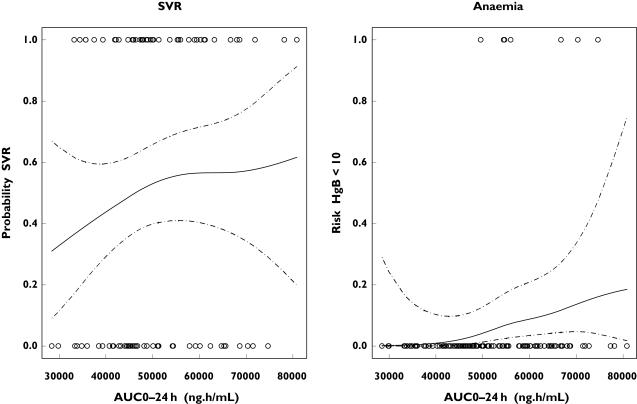
The relationship between ribavirin AUC0−24 h and the probability of an SVR in patients included with HCV genotype 1 and the probability of anaemia in all HCV patients treated for 48 weeks are shown in Figure 3. Despite the smaller number of patients infected in this analysis (n = 242) compared with the other GAM analyses, the probability of an SVR seems to increase with an increasing AUC0−24 h in this patient population, with a steeper initial increase followed by a more flat increase. Also, the risk of anaemia is estimated to increase gradually with an increasing AUC0−24 h of ribavirin (Figure 3). The 95% CIs for both the probability of SVR and risk of anaemia are relatively wide (Figure 3).
Figure 3.
The probability of a sustained virological response (SVR) in patients with hepatitis C virus (HCV) genotype 1 (left) and anaemia in all HCV patients (right) as a function of the ribavirin AUC0−24 h at steady state after 48 weeks’ treatment with low-dose (800 mg) or standard-dose (1000 or 1200 mg day−1 depending on body weight) ribavirin. Observed values are presented as circles. The dashed lines are the 95% pointwise confidence intervals
In the GAM analyses, viral load, age, baseline ALT quotient, ribavirin dose kg−1 (RBVDkg), cirrhosis (Cirr), apparent oral ribavirin clearance (CL/F) and the interaction between age and ribavirin dose kg−1 (Age:RBVDkg) were retained as prognostic factors for an SVR in patients with HCV genotype 1. The best GAM for SVR in HCV genotype 1 patients was:
| (3) |
A smoothing term for log(RNA), age and CL/F, as indicated by ‘s’ in equation 3, combined with a linear term for log(ALT) and ribavirin dose kg−1 (RBVDkg) appeared to form the best generalized additive models in terms of the Akaike statistic. The degrees of freedom of the smoothing splines are indicated by the number within the parentheses of the ‘s’ terms. HCV RNA level was the most important prognostic factor in terms of the Akaike statistic criterion, followed by age, baseline ALT quotient, ribavirin dose kg−1 body weight, cirrhosis and finally ribavirin CL/F.
The following factors were retained for the GAM developed for SVR in patients with HCV genotype 2 or 3: cirrhosis (Cirr); treatment duration; log ribavirin dose/kg (RBVDkg); race (White); the interactions between cirrhosis and log baseline ALT quotient; and the interactions between cirrhosis and ribavirin dose kg−1. The best GAM for SVR in HCV genotype 2 or 3 patients was:
| (4) |
In the 49 patients infected with HCV genotype 4, the likelihood of an SVR appeared to increase with an increasing ribavirin dose kg−1. In addition, the chance of an SVR appeared to be higher after 48 weeks of treatment compared with 24 weeks of treatment with ribavirin.
With respect to anaemia, sex (male vs. female), ribavirin dose kg−1 (RBVDkg), log baseline haemoglobin (HgB0), age, log baseline ALT quotient, cirrhosis (Cirr) and the interaction between sex and ribavirin dose kg−1 (Sex:RBVDkg) were retained as prognostic factors for the incidence of anaemia. The best GAM for the incidence of anaemia was:
| (5) |
Sex (male vs. female) and ribavirin dose kg−1 appeared to be the most important prognostic factor for the incidence of anaemia in terms of the Akaike statistic criterion, followed by baseline haemoglobin levels, age, baseline ALT quotient and cirrhosis (cirrhotic vs. noncirrhotic).
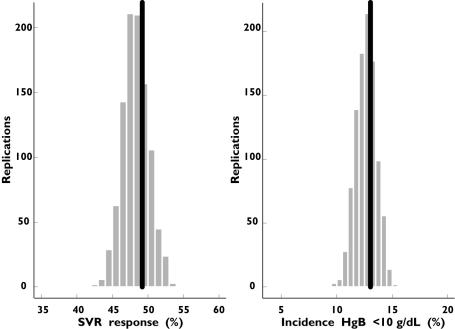
The final GAMs for SVR and anaemia were evaluated by comparing the predicted SVR rates and incidence of anaemia with the actual data from the trials. For patients with HCV genotype 1 infection who received a standard dose of ribavirin (1000 or 1200 mg day−1), the predictive performance of the two GAMs was satisfactory because the actual SVR rate of approximately 49% and the incidence of anaemia of approximately 13% fell well within the predicted range (Figure 4).
Figure 4.
Observed (black) and predicted distribution of the total sustained virological response (SVR) and incidence of anaemia in patients with hepatitis C virus (HCV) genotype 1 receiving 48 weeks’ treatment with standard-dose (1000 or 1200 mg according to body weight) ribavirin
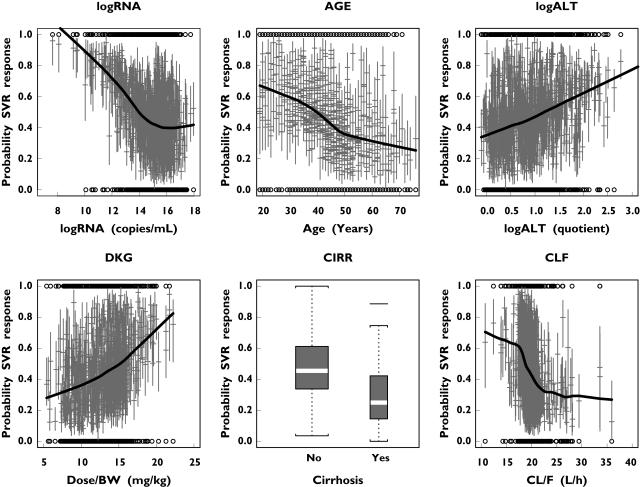
Figure 5 shows the probability of a SVR as a function of the prognostic factors retained. The uncertainty in every individual prediction was quantified by bootstrapping and by fitting the original SVR dataset 1000 times. The probability of a SVR decreased with increasing serum HCV RNA concentration up to about 3 million copies ml−1 (corresponding to a log(RNA) of approximately 15 in Figure 5), but remained relatively independent of HCV RNA level thereafter. The probability of an SVR decreased almost linearly with increasing age. In contrast, it was predicted to increase linearly with baseline ALT quotient. The probability of an SVR also increased with increasing ribavirin dose kg−1. A higher apparent ribavirin CL/F appeared to have a negative influence on the probability of achieving an SVR. In addition, patients with a histological diagnosis of cirrhosis were predicted to have a lower probability of a SVR compared with patients without cirrhosis.
Figure 5.
Median (with 95% confidence intervals) probability of a sustained virological response (SVR) as a function of the prognostic factors in each individual hepatitis C virus (HCV) genotype 1 patient treated for 48 weeks, based on generalized additive models fitted to 1000 bootstrap samples of the original dataset
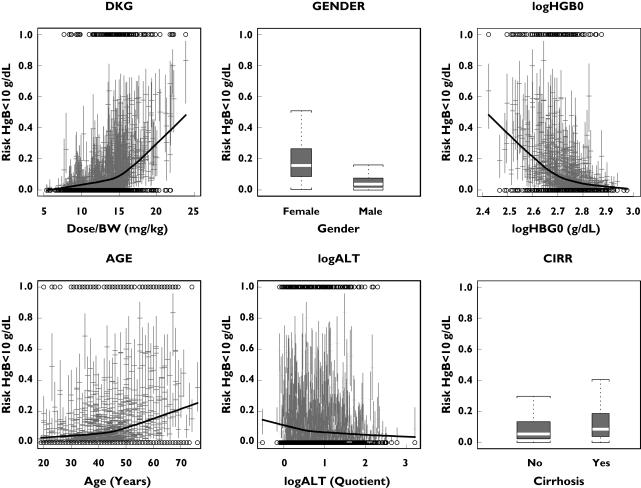
Figure 6 shows the probability of anaemia as a function of gender, daily ribavirin dose kg−1, baseline haemoglobin level, age, baseline ALT quotient and histological diagnosis (no cirrhosis vs. cirrhosis). The probability of anaemia increased with increasing ribavirin dose kg−1, with a steeper increase from about 15 mg kg−1 onwards. In general, females were predicted to have a higher likelihood of becoming anaemic compared with male patients. In addition, a relatively low baseline haemoglobin value was identified as a risk factor for anaemia. The incidence of anaemia was predicted to increase with increasing age, especially from age 50 years onwards. In contrast, the incidence of anaemia was negatively correlated with the baseline ALT quotient. Patients with cirrhosis were predicted to have a higher chance of becoming anaemic compared with noncirrhotic patients.
Figure 6.
Median (with 95% confidence intervals) probability of anaemia as a function of the prognostic factors in each individual hepatitis C virus (HCV) patient treated for 48 weeks, based on generalized additive models fitted to 1000 bootstrap samples of the original dataset
Discussion
Our pooled analysis of two large randomized, controlled clinical trials demonstrates that the relationship between SVR and ribavirin dose is dependent on HCV genotype and that the probability of developing anaemia increases with ribavirin dose, especially at doses above 15 mg kg−1. In patients infected with HCV genotype 1, the probability of achieving an SVR increased as a function of the ribavirin dose kg−1. In comparison, the probability of achieving an SVR was not strongly correlated with the dose of ribavirin in patients infected with HCV 2 or 3 genotypes (approximately 90% of non-1 genotypes were genotypes 2 or 3). These observations suggest that low-dose ribavirin (800 mg day−1) is sufficient to maximize the probability of achieving an SVR in patients infected with genotypes 2 or 3 and is associated with a lower risk of anaemia. Consistent with these findings, recent data from the WIN-R study examining pegylated interferon alfa-2b (12KD) plus ribavirin in genotype 2/3 patients show that SVR rates were similar in the weight-based (800–1200 mg day−1) and fixed-dose ribavirin (800 mg day−1) groups [18].
In 242 patients, the individual values of CL/F were estimated by a population pharmacokinetic analysis [14]. As no pharmacokinetic information in the remaining 1490 patients was available, the data of this subgroup of 242 patients were used to assess whether exposure of ribavirin (AUC0−24 h at steady state) was a prognostic factor for the likelihood of SVR and the risk of anaemia. In patients infected with HCV genotype 1, the probability of an SVR seemed to increase with an increasing AUC0−24 h. This finding was in line with the results of previous studies showing that plasma concentrations of ribavirin were correlated with SVR [7, 8]. Also, in a small study in HIV–HCV coinfected patients, ribavirin plasma levels were correlated with the achievement of a virological response at weeks 4 and 12 [19]. The risk of anaemia was also estimated to increase gradually with an increasing AUC0−24 h of ribavirin, in line with previous observations [7, 9, 20].
Our pooled analysis also showed that baseline serum HCV RNA concentration, age, ALT quotient, ribavirin dose kg−1, histological diagnosis and ribavirin CL/F influenced the likelihood of achieving an SVR in patients infected with HCV genotype 1. These factors are consistent with those previously reported to have predictive value for treatment outcomes in patients with chronic hepatitis C treated with interferon-based therapies [2–5]. In another pharmacodynamic study, baseline HCV RNA concentration, age, ribavirin concentration at steady state and duration of treatment influenced the likelihood of an SVR [7].
Although the number of HCV genotype 4 patients was relatively small (only 49 out of 1732 patients infected with HCV), our analysis indicated that the likelihood of an SVR appeared to increase with increasing treatment duration and an increasing ribavirin dose kg−1. Our analysis thus seems to support the previous suggestion, based on an investigation in HCV patients coinfected with HIV, that patients infected with genotype 4 seem more to resemble genotype 1 patients rather than patients infected with HCV genotypes 2 or 3 [21]. For this reason, it is recommended to provide patients infected with HCV genotype 4 with a standard daily dose of 1000 or 1200 mg according to body weight.
Although anaemia is a well-documented adverse effect of ribavirin therapy, prognostic factors for anaemia in patients treated with combination therapy have not been thoroughly assessed. In an earlier study [6], baseline haemoglobin level and ribavirin concentration at steady state influenced the occurrence of haematological toxicity. Our study shows that gender and ribavirin dose kg−1 are the most important factors influencing the likelihood of anaemia (haemoglobin < 10 g dl−1); baseline haemoglobin level, age, baseline ALT quotient and histological diagnosis also influenced the likelihood of developing anaemia. Our results extend earlier observations in that they highlight baseline characteristics beyond which the likelihood of anaemia increases dramatically, e.g. treatment with ribavirin doses > 15 mg kg−1 (approximately 37% of all patients receiving 1000 or 1200 mg day−1 depending on body weight).
As anaemia is not a universal risk in all patients, the recommended dosing strategy of ribavirin in order to obtain a high likelihood of an SVR in individual patients infected with HCV genotype 1 is to start with an initial treatment of 1000 or 1200 mg day−1 according to body weight. Indeed, it may be that for heavier patients, ribavirin doses > 1200 mg day−1 may be initiated as these are likely to be associated with an additional efficacy benefit and a manageable anaemia risk, provided that the dose does not greatly exceed 15 mg kg−1 day−1.
In clinical practice, dose reductions are a commonly used strategy for resolving treatment-related anaemia. Our study suggests that the dose-modification regimen approved in the USA, a reduction to 600 mg day−1 in a single step, irrespective of the initial dose, would probably have a greater impact on the likelihood of achieving an SVR rather than the incidence of anaemia because there is little difference in the incidence of anaemia when the dose of ribavirin is < 15 mg kg−1 day−1. A more gradual dose reduction regimen, e.g. in 200-mg decrements, may be more appropriate in that it may prevent the development of anaemia while maintaining a high probability of achieving an SVR. Such a strategy would be particular important in patients infected with HCV genotype 1, where ribavirin dose appears to be more important to therapeutic outcome, and in whom the recommended initial dose of ribavirin is 1000 or 1200 mg day−1 [17].
An alternative strategy for managing anaemia is the use of erythropoietin. The use of erythropoietin would presumably increase the overall probability of achieving an SVR because the dose of ribavirin could be maintained. This potential of this strategy was recently demonstrated in a small pilot study [10]. It must be noted that the use of erythropoietin was prohibited in the two studies on which our analysis was based.
The applicability of our observations to other patient populations such as those with HIV–HCV coinfection must be confirmed in clinical trials.
In conclusion, our study shows that the probability of anaemia increases as a function of the ribavirin dose kg−1 in patients treated with peginterferon alfa-2a (40KD) plus ribavirin, while the relationship between the likelihood of SVR and ribavirin dose is influenced by HCV genotype. Low-dose ribavirin (800 mg day−1) is sufficient to maximize the likelihood of SVR in patients infected with genotypes 2 or 3 and is associated with a lower risk for anaemia. In contrast, patients infected with HCV genotype 1 require the standard dose of ribavirin (1000 or 1200 mg day−1), but may be exposed to a higher risk of anaemia. In addition, viral load at baseline, age, baseline ALT quotient, ribavirin dose kg−1, cirrhosis status and the apparent oral clearance of ribavirin influenced the likelihood of a SVR, while the likelihood of anaemia was influenced by gender, ribavirin dose kg−1, baseline haemoglobin level, age, baseline ALT level and cirrhosis status.
Conflict of interest
F.D., M.L. and K.J. are employees of F. Hoffmann-La Roche. J.R.W. and E.S. from Exprimo have been contracted to perform the analysis on behalf of F. Hoffmann-La Roche.
References
- 1.World Health Organization. Hepatitis C. Available at http://www.who.int/mediacentre/factsheets/fs164/en/ Last accessed 25 July 2005.
- 2.Berg T, Sarrazin C, Herrmann E, Hinrichsen H, Gerlach T, Zachoval R, Wiedenmann B, Hopf U, Zeuzem S. Prediction of treatment outcome in patients with chronic hepatitis C: significance of baseline parameters and viral dynamics during therapy. Hepatology. 2003;37:600–9. doi: 10.1053/jhep.2003.50106. [DOI] [PubMed] [Google Scholar]
- 3.Lee SS. Review article: indicators and predictors of response to anti-viral therapy in chronic hepatitis C. Aliment Pharmacol Ther. 2003;17:611–21. doi: 10.1046/j.1365-2036.2003.01463.x. [DOI] [PubMed] [Google Scholar]
- 4.Zeuzem S. Heterogeneous virologic response rates to interferon-based therapy in patients with chronic hepatitis C: who responds less well? Ann Intern Med. 2004;140:370–81. doi: 10.7326/0003-4819-140-5-200403020-00033. [DOI] [PubMed] [Google Scholar]
- 5.Foster GR, Fried MW, Hadziyannis SJ, Chaneac M. Treatment of chronic hepatitis C with peginterferon alfa-2a (40KD) (PEGASYS (R) and ribavirin (COPEGUS (R): patient age has a marked influence on the individual estimated probability of achieving a sustained virological response. Hepatology. 2003;38(Suppl. 1):246A. [Google Scholar]
- 6.Jen J, Laughlin M, Chung C, Heft S, Affrime MB, Gupta SK, Glue P, Hajian G. Ribavirin dosing in chronic hepatitis C: application of population pharmacokinetic–pharmacodynamic models. Clin Pharmacol Ther. 2002;72:349–61. doi: 10.1067/mcp.2002.127112. [DOI] [PubMed] [Google Scholar]
- 7.Jen JF, Glue P, Gupta S, Zambas D, Hajian G. Population pharmacokinetic and pharmacodynamic analysis of ribavirin in patients with chronic hepatitis C. Ther Drug Monit. 2000;22:555–65. doi: 10.1097/00007691-200010000-00010. [DOI] [PubMed] [Google Scholar]
- 8.Larrat S, Stanke-Labesque F, Plages A, Zarski JP, Bessard G, Souvignet C. Ribavirin quantification in combination treatment of chronic hepatitis C. Antimicrob Agents Chemother. 2003;47:124–9. doi: 10.1128/AAC.47.1.124-129.2003. [DOI] [PMC free article] [PubMed] [Google Scholar]
- 9.Lindahl K, Schvarcz R, Bruchfeld A, Stahle L. Evidence that plasma concentration rather than dose per kilogram body weight predicts ribavirin-induced anaemia. J Viral Hepatol. 2004;11:84–7. doi: 10.1046/j.1365-2893.2003.00475.x. [DOI] [PubMed] [Google Scholar]
- 10.Lindahl K, Stahle L, Bruchfeld A, Schvarcz R. High-dose ribavirin in combination with standard dose peginterferon for treatment of patients with chronic hepatitis C. Hepatology. 2005;41:275–9. doi: 10.1002/hep.20563. [DOI] [PubMed] [Google Scholar]
- 11.Fried MW, Shiffman ML, Reddy KR, Smith C, Marinos G, Goncales FL, Jr, Haussinger D, Diago M, Carosi G, Dhurmeaux D, Craxi A, Lin A, Hoffman J, Yu J. Peginterferon alfa-2a plus ribavirin for chronic hepatitis C virus infection. N Engl J Med. 2002;347:975–82. doi: 10.1056/NEJMoa020047. [DOI] [PubMed] [Google Scholar]
- 12.Hadziyannis SJ, Sette HJ, Morgan TR, Balan V, Diago M, Marcellin P, Ramadori G, Bodenheimer H, Jr, Berstein D, Rizzetto M, Zeuzem S, Pockros PJ, Lin A, Ackrill A Pegasys International Study Group. Peginterferon alfa-2a and ribavirin combination therapy in chronic hepatitis C. Randomized study of treatment duration and ribavirin dose. Ann Intern Med. 2004;140:346–55. doi: 10.7326/0003-4819-140-5-200403020-00010. [DOI] [PubMed] [Google Scholar]
- 13.Hastie TJ, Tibshirani RJ. Monographs on Statistics and Applied Probability 43. London: Chapman & Hall; 1990. Generalized Additive Models. [Google Scholar]
- 14.Wade JR, Snoeck E, Duff F, Lamb M, Jorga K. Pharmacokinetics of ribavirin in patients with hepatitis C virus. Br J Clin Pharmacol. 2006 doi: 10.1111/j.1365-2125.2006.02704.x. in press. [DOI] [PMC free article] [PubMed] [Google Scholar]
- 15.Sakamoto Y, Ishiguro M, Kitagawa G. Akaike Information Criterion Statistics: D. Dordrecht: Reidel Publishing Co.; 1986. [Google Scholar]
- 16.Efron B, Tibshirani RJ. An Introduction to the Bootstrap. San Francisco: Chapman & Hall; 1993. [Google Scholar]
- 17.Strader DB, Wright T, Thomas DL, Seeff LB. Diagnosis, management, and treatment of hepatitis C. Hepatology. 2004;39:1147–71. doi: 10.1002/hep.20119. [DOI] [PubMed] [Google Scholar]
- 18.Brown RS, Jr, Jacobson IM, Afdhal N, Freilich B, Pauley BP, Regenstein F, Flamm S, Kwo P, Griffel L, Brass CA., and the WIN-R Study Group Differences in Treatment Outcome to Antiviral Therapy Based on Genotype and Viral Load in Hepatitis C Genotypes 2 and 3 in the WIN-R Trial. EASL 2006 Congress Abstract 41. [Google Scholar]
- 19.Rendon AL, Nunez M, Romero M, Barreiro P, Martin-Carbonero L, Garcia-Samaniego J, Jimenez-Nacher I, Gonzalez-Lahoz J, Soriano V. Early monitoring of ribavirin plasma concentrations may predict anemia and early virologic response in HIV/hepatitis C virus-coinfected patients. J Acquir Immune Defic Syndr. 2005;39:401–5. doi: 10.1097/01.qai.0000170034.90438.68. [DOI] [PubMed] [Google Scholar]
- 20.Maeda Y, Kiribayashi Y, Moriya T, Maruhashi A, Omoda K, Funakoshi S, Murakami T, Takano M. Dosage adjustment of ribavirin based on renal function in Japanese patients with chronic hepatitis C. Ther Drug Monit. 2004;26:9–15. doi: 10.1097/00007691-200402000-00004. [DOI] [PubMed] [Google Scholar]
- 21.Zeuzem S. Heterogenous virologic response rates to interferon-based therapy in patients with chronic hepatitis C: who responds less well? Ann Intern Med. 2004;140:370–81. doi: 10.7326/0003-4819-140-5-200403020-00033. [DOI] [PubMed] [Google Scholar]


